To do a global cash flow analysis, combine the cash flow of a borrower, its affiliated businesses and its guarantors, remove the money that only moves between them, take off the guarantors' taxes and living costs, and divide what is left by every debt payment the group owes, including the new loan. The result is global debt service coverage, the figure credit committees usually read first on an owner-managed business. It is hard to get right because the same dollar appears on several returns: as the business's profit, as the owner's taxable income on Schedule E and as a cash distribution on a K-1. Botminds' Commercial Financial Spreading builds global cash flow from the spread itself, counting pass-through income once, at the entity, and never from a page it has not read.
The worked example uses fictional sample data from the solution: Halvorsen Precision Machining, an S corporation; Halvorsen Properties LLC, the partnership that owns its plant; and two guarantor households. The bank's policy asks for 1.25x global and 1.20x on the business alone.
What the rules say global coverage must include, and how much
Both
borrowers’ and guarantors’ cash flow, and their combined obligations, including contingent ones, in the interagency definition
1.15x
SBA’s floor for a 7(a) borrower’s own debt service coverage, historical or projected
1:1
SBA’s floor on a global basis
What is global debt service coverage, and what is the formula?
It is cash available from every party to the credit divided by the debt service of every party to the credit. The federal banking agencies' 2023 policy statement on commercial real estate workouts gives the definition most banks now quote: "Global debt service coverage is inclusive of the cash flows generated by both the borrower(s) and guarantor(s), as well as the combined financial obligations (including contingent obligations) of the borrower(s) and guarantor(s)" (88 FR 43115). The same statement asks lenders to have "analyzed the borrower's global debt service coverage, including realistic projections".
SBA puts the same idea into its 7(a) rules. A lender's financial analysis must address "Global cash flow analysis that includes assessment of impact on cash flow to/from any affiliate business", and must justify additions and subtractions such as "Expenses and distributions; Distributions for S-Corp taxes; Rent payments; Owner's Draw" (SOP 50 10 8.1). Each of those words names a place where a dollar can be counted twice.
The formula is short. Global coverage = (entity cash flows after eliminating payments between the entities + guarantors' income that does not come from those entities − guarantors' income taxes − guarantors' living expenses) ÷ (debt service of every entity and guarantor, with the proposed loan). The work is in the brackets.
The global cash flow formula: four terms above the line, one below
Entity cash flow
Σ EBITDA or NOI of each entity in the credit, payments between them eliminated
From the statements or the return; pass-through income is counted here and only here.
Guarantors’ outside income
wages + interest + dividends + income from entities outside the credit
Form 1040 and its schedules; K-1 cash only for entities not already on the entity side.
Guarantors’ income tax
federal + state tax actually due
From the households’ own returns.
Living expenses
policy allowance or the personal financial statement, whichever is higher
A credit-policy setting, not an assumption made per deal.
How to calculate global debt service coverage ratio: a worked example
Here is fiscal 2025 for the sample borrower, built the way the solution builds it under the bank's "combined entity cash flow" method. Every amount on the left comes from a page: the operating company's EBITDA from its reviewed statements, the property company's net operating income from Form 8825, the guarantors' wages from Form 1040 line 1a.
Fiscal 2025 global cash flow, combined entity method
| Line | Where it comes from | FY2025 |
|---|---|---|
| Halvorsen Precision Machining, EBITDA | Reviewed statements, after the rent paid to the property company | $1,696,000 |
| Halvorsen Properties LLC, net operating income | Form 8825, including the rent received from the operating company | $386,000 |
| Rent between the two entities | $504,000 paid and $504,000 received: left in on both sides, so it nets to zero | $0 |
| Guarantors’ wages, interest and dividends | Form 1040 line 1a and schedules: Erik $420,000, Ingrid $68,000, Marcus $200,000 in wages | $702,200 |
| Less income tax, federal and Michigan | Both households’ returns | ($284,200) |
| Less living expenses | Bank policy: $48,000 plus $12,000 per dependant, $96,000 and $72,000 | ($168,000) |
| Cash available for debt service | Sum | $2,332,000 |
| Debt service, pro forma | Existing term notes and line interest $742,000, proposed term loan $511,230, and the other debts in the credit | $1,588,430 |
| Global debt service coverage | $2,332,000 ÷ $1,588,430 | 1.47x |
Three lines are absent, and their absence is the method. The owners' Schedule E income is not there. The K-1 distributions from the operating company are not there. The guarantors' share of the property company's income is not there either. All three are the entities' own cash flow seen again from the owners' side of the table, and the entity lines above already hold it.
Why Schedule E income is never added to entity cash flow
Because it is the same income, measured for tax rather than for cash. An S corporation's ordinary business income passes to its shareholders on box 1 of the K-1, which the IRS describes as "your share of the ordinary income (loss) from trade or business activities of the corporation" (IRS). The owner reports it on Schedule E, page 2. A partnership's rental income passes the same way. If the operating company's EBITDA is in global cash flow and the owners' Schedule E is added on top, the business's profit is counted twice.
Last year's Halvorsen spreadsheet did exactly that. It added the owners' Schedule E income from both entities, $591,000, to the entities' cash flow, and showed global coverage of 1.84x. The property company is the clearest part: $286,000 of taxable income on Schedule E, but its K-1s show only $96,000 actually paid out in box 19, code A. Neither number belongs on top of the entity's own net operating income. Counted once, at the entity, the year covers 1.47x.
The same year, four ways: only one counts each dollar once
Every wrong version of global cash flow is higher than the right one. A double count never makes a borrower look weaker.
Distributions: counted at the entity or at the owner, never at both
The second double count runs through K-1 cash. In 2025 the operating company paid $600,000 of distributions: $420,000 to Erik Halvorsen and $180,000 to Marcus Delacroix, reported in box 16, code D, of their K-1s. The IRS treats those as reductions of stock basis, not as income (IRS). They came out of the same operating cash flow already counted as the company's EBITDA. Add them again on the guarantors' side and global coverage rises to 1.85x, on paper. The solution's exception reads "Distributions counted once" and removes the $600,000, with the K-1 line and the statement of equity as its pages.
There is a legitimate method that uses distributions, and it is often confused with the error. Under a distributions method, the guarantor side counts only the cash the owners actually received from the entities (K-1 box 16D for an S corporation, box 19A for a partnership), and the entities whose cash is counted that way are left out of the entity side. It answers a narrower question: how much cash reached the guarantors. The error is mixing the two methods in one spreadsheet.
Two defensible methods, and the mixture that is not
Combined entity cash flow: Each entity’s full cash flow (EBITDA or net operating income), with payments between entities eliminated.
Distributions method: The borrower’s cash flow; other entities appear only through the cash they paid their owners.
Combined entity cash flow: Wages, interest and other income that does not come from the entities in the credit.
Distributions method: Wages and other income, plus K-1 cash distributions (box 16D or 19A) from entities not counted on the entity side.
Combined entity cash flow: Never added. It is the entity income already counted.
Distributions method: Never added. Taxable income is not cash.
Combined entity cash flow: Can the group as a whole service the group’s debt?
Distributions method: Can the guarantors service their share from the cash they actually receive?
Combined entity cash flow: Adding Schedule E or distributions on top.
Distributions method: Adding a distribution and also the paying entity’s cash flow.
Rent between the entities: eliminate the transfer, not one side of it
Owner-managed manufacturers very often lease their building from an affiliate owned by the same family, and the rent is the commonest place a combined analysis drifts. Halvorsen Precision Machining pays Halvorsen Properties $504,000 a year, on line 11 of its Form 1120-S. The operating company's EBITDA is after that rent; the property company's net operating income includes it. Kept on both sides, it nets to zero, which is what elimination means.
The error is to add the rent back to the operating company as "owner-related" while keeping the property company's income whole. That counts $504,000 twice. The opposite error, deducting the property company's rental income while the operating company still bears the rent, removes it twice. In the spread, the line is mapped to the bank's account for rent paid to an affiliate rather than third-party occupancy, so the elimination is visible on its own line. Re-mapping a line in the bank's template shows that step and how it becomes a rule for the borrower's later spreads.
Global cash flow in Commercial Financial Spreading: last year’s method beside the tied-out figure
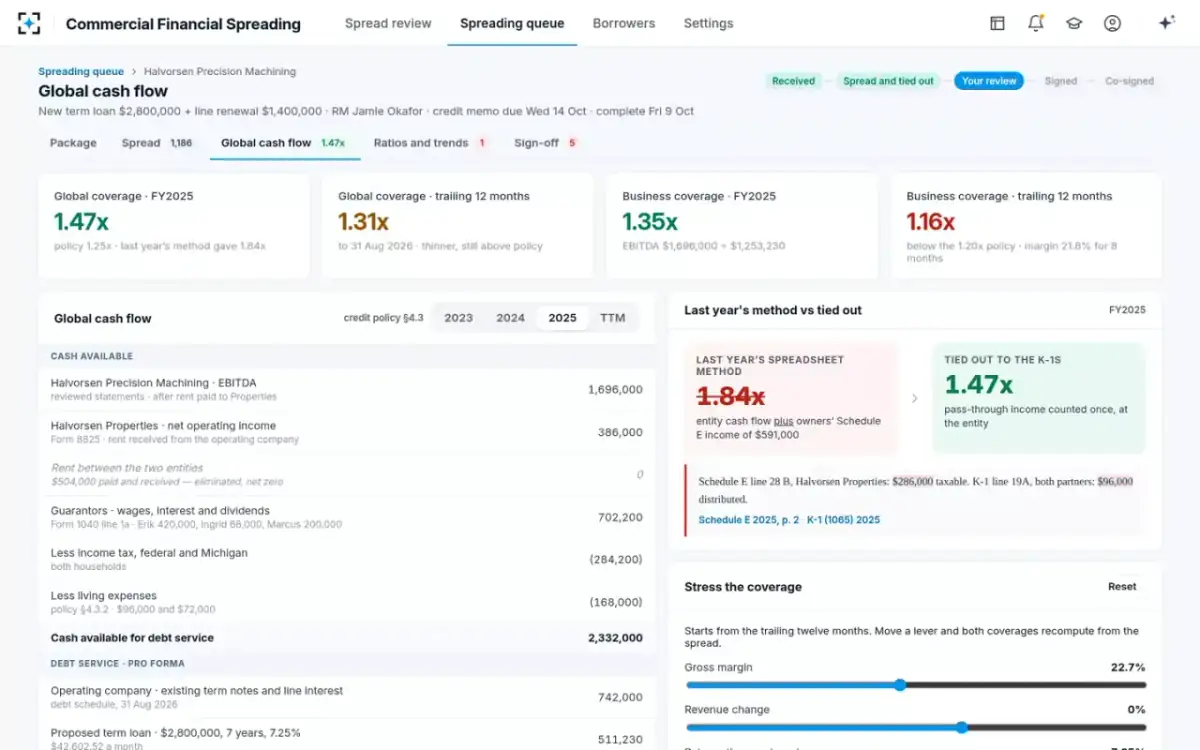
The struck-through 1.84x keeps the old method in view, so the committee sees why the number moved.
Taxes, living expenses and contingent debts: the subtractions spreadsheets skip
The guarantor side is income minus what the household must pay before it can help the business. Income tax comes from the households' own returns, $284,200 for the two Halvorsen households. Living expenses are a policy choice: the sample bank uses $48,000 per household plus $12,000 per dependant, or the personal financial statement figure if higher, which comes to $96,000 and $72,000. Leaving either out flatters the guarantors by the full amount.
The denominator needs the same care. The interagency definition counts "combined financial obligations (including contingent obligations)", so a guarantor's guarantee of another business's loan, or a personal mortgage, belongs in global debt service or in a written reason for leaving it out. A personal financial statement that is out of date weakens this side twice: the Halvorsen file's statement for Marcus Delacroix is dated 14 March 2025, 19 months old against a 12-month policy, so his $310,000 of liquidity cannot yet be relied on.
Seven checks for any global cash flow, by hand or by software
- No Schedule E on top of entity cash flow
K-1 box 1 and box 2 income is the entity’s income seen again.
- Distributions counted once
Either at the entity or at the owner, under the policy’s method, never both.
- Payments between entities eliminated as a pair
Rent, management fees and interest on loans between related entities.
- No entity counted without its return and K-1s
If the page is missing, the cash is missing.
- Guarantors’ taxes and living expenses subtracted
From their own returns and the bank’s policy, not assumed.
- Contingent obligations in the denominator
Guarantees of other debts, personal mortgages and the proposed loan.
- Trailing twelve months beside the fiscal year
A good year-end can hide a weak current year.
Trailing twelve months: the fiscal year is not the last word
Fiscal 2025 covers 1.47x globally. The August 2026 interim tells a different story about the current year: gross margin fell to 21.8% for the eight months against 25.2% a year earlier, after mill surcharges on bar stock under a fixed-price supply contract, and inventory rose 32% to $2,840,000. On the trailing twelve months to 31 August 2026, global coverage is 1.31x, still above the 1.25x policy, and business coverage is 1.16x, below the 1.20x policy.
Global and business coverage answer different questions, and a committee needs both. Global coverage says the family can carry the debt; business coverage says whether the operating company can carry its own without the owners' wages and the property company's rent behind it. A trailing figure below policy is an exception to write up, not to average away. The solution's stress panel recomputes both figures from the spread as margin or revenue is moved, so the memo can say how far the margin can fall before the global figure crosses 1.25x.
UCA cash flow vs traditional cash flow: which number goes on top?
Most global cash flow worksheets start from EBITDA, which is the traditional method, and the Federal Reserve's examination manual warns about exactly that choice. "The accrual conversion method is the preferred method because it is the most reliable"; the traditional method "does not recognize growth in accounts receivable or inventory, a slow-down in accounts payable, capital expenditures, or additional borrowings" (CBEM §2080.1). The accrual conversion method starts from sales and adjusts for the change in receivables, inventory and payables, which is close in spirit to what many lenders call UCA cash flow.
Halvorsen shows why the distinction matters. Inventory in the August interim is up 32% to $2,840,000. If that rise holds against the year-earlier balance, roughly $690,000 of cash is sitting on the shop floor, cash that an EBITDA figure does not see and an accrual conversion figure subtracts. The line is 94% drawn, which is where that cash came from. EBITDA-based global coverage of 1.31x on the trailing twelve months is therefore the generous reading.
The manual also warns against the opposite overreaction: "deficit cash flow does not always mean that the borrower is encountering serious financial difficulties", because a growing business consumes working capital, and it asks for "a comprehensive analysis of changes in the balance sheet from period to period" before the loan is criticized. Its footnote names the most common mechanical error in the trailing figure: "Mixing annual financial data with interim financial information can cause misinterpretation of cash flow." A trailing twelve months is built from the fiscal year plus this year's interim less last year's same interim, never from a fiscal year and an interim added together.
What is a good global debt service coverage ratio?
There is no regulatory number for a good global ratio, only floors: SBA's is 1:1 globally and 1.15 on the business, and bank policies commonly sit higher, such as the sample bank's 1.25x global and 1.20x business. A useful way to judge any ratio is to turn it into the cushion it represents, in dollars of cash flow, and then ask what in the business could take that cushion away.
Take Halvorsen's fiscal 2025: $2,332,000 of cash available against $1,588,430 of debt service. Reaching the 1.25x policy floor would need cash available of $1,985,538, so the cushion above policy is about $346,000. On fiscal 2025 sales of $18,640,000 that is about 1.9 points of gross margin, before any change in the owners' taxes. The interim shows margin already 3.4 points lower for the first eight months, which is why the trailing figure has fallen to 1.31x. Against SBA's 1:1 floor the cushion is about $744,000.
The business cushion is thinner than the global one
The arithmetic above is simple; keeping it honest over four entities and three years is not. That is the case for pinning each line to its page: the senior underwriter can open the K-1 behind any figure and see which box it came from. The annotated K-1 goes box by box, and the Commercial Financial Spreading page shows the rest of the spread.
Questions people ask
Is a global cash flow Excel template enough?
A template can hold the method, but it cannot tell whether the numbers typed into it came from the right boxes. Most double counts in global cash flow are entry errors that the template accepts without complaint, which is why the Federal Reserve's examination manual expects credit files to document "the borrower's past and current financial condition" rather than only a result (CBEM §2010.1).
Global DSCR vs DSCR: what is the difference?
DSCR, or business debt service coverage, divides one borrower's cash flow by its own debt service; global DSCR adds every affiliate and guarantor to both sides. The two can move in opposite directions: Halvorsen's global figure is above policy on the trailing twelve months while its business figure is below. A committee that sees only the global ratio misses that the operating company leans on its owners.
Does SBA require a global cash flow analysis?
SBA's SOP 50 10 8.1 sets a 1:1 global floor beside the 1.15 business floor, and its list of what a 7(a) lender's financial analysis must address includes a global analysis covering affiliates, as quoted above (SBA). For 504 loans it adds that anticipated rent from the project property may count in the global analysis but not in the repayment ability analysis. It also asks for personal financial statements from every guarantor dated within 90 days of loan approval, which is the guarantor side's raw material.
How should a guarantor's own rental property be counted?
A rental held personally, reported in Part I of Schedule E rather than through a K-1, is outside the entities, so its net cash belongs on the guarantor side: rents less expenses, with depreciation added back, and its mortgage payment in the denominator. Adding the rent without the mortgage is the commonest slip. Commercial Financial Spreading reads the property line by line from Schedule E and leaves the treatment to the bank's policy.
Should a guarantor's K-1 loss reduce global cash flow?
A loss from an entity in the credit is already in that entity's cash flow. A loss from an entity outside the credit needs a judgement: is it a paper loss, such as depreciation, or a business the guarantor will have to fund? That is a question for the analyst, and the solution flags it rather than deciding it.