Client service key performance indicators at an asset manager measure two things: whether institutional clients, consultants and intermediaries get the right answer on time, and whether anything went out that should not have. Most scorecards cover the first with response times and satisfaction scores and miss the second entirely, yet a disclosure error or a corrected figure costs more than a late reply. The ten indicators below each come with a formula and the table that feeds it. Botminds' Client Inquiry Management produces them as a by-product of the work, because every request carries a clock, every answer a stamped source and every hold a reason, so the scorecard is counted rather than estimated.
The sample values come from Quillfield Capital, a fictional firm in the solution, in mid-October 2026.
Ten client service KPIs: the formula, the source table and the sample firm's value
| KPI | Formula | Source data | Sample firm |
|---|---|---|---|
| 1. Acknowledgement time | Median and 90th percentile of first response − received, in business hours, by tier | Request log: received and first-response times | Tier 1 target 15 minutes |
| 2. Time to complete | Median and 90th percentile of answered − received, business hours, by tier and request type | Request log, clock rules | Median routine 34 minutes |
| 3. On-time rate | Answered within clock ÷ answered | Request log | 97.6% of 1,404 answered this month |
| 4. Paused-clock share | Requests with a documented wait on the client ÷ open requests | Clock pauses with reason | 19 of 214 open |
| 5. Reopen rate | Same question from the same client within 10 business days of closing ÷ closed | Request log, duplicate links | Count from the duplicate check |
| 6. Figures corrected after sending | Replies followed by a correction ÷ replies with figures; with stops before sending beside it | Corrections log; tie-out results | 27 stopped before sending this month |
| 7. Disclosure holds | Holds per 1,000 answer blocks; released ÷ decided | Holds with rule, decision and reason code | 46 holds on 3,862 blocks; 5 of 32 decided released |
| 8. Entitlement exceptions | Requests held for a missing or expired authorization ÷ requests | Intake results against CRM authorizations | 3 open holds on the sample Thursday |
| 9. Specialist share | Open questions with a specialist desk ÷ open requests; median specialist time | Escalation queue | 37 questions with six desks |
| 10. Cost per request | People minutes per request × loaded hourly cost ÷ 60, by request type | Time per step; finance's loaded cost | Built from your own minutes |
Which client service key performance indicators matter at an asset manager?
The ones that change a decision. A head of client service decides staffing, which requests to automate, where the disclosure policy is unclear and which clients are at risk; an examiner or a client asks whether replies were accurate, timely, kept and sent only to those entitled. A KPI that informs none of those decisions or questions is a report, not an indicator.
That rules out some familiar measures. Ticket volume alone says little: the sample firm handles about 3,000 requests a month from 1,240 institutions, 386 intermediary firms and 47 consultants, and the mix matters more than the count. A satisfaction survey sent to a pension plan's investment staff after every reply will be ignored. And average handle time, the call-centre staple, rewards the associate who skips the entitlement check.
What is a good response time for an institutional client request?
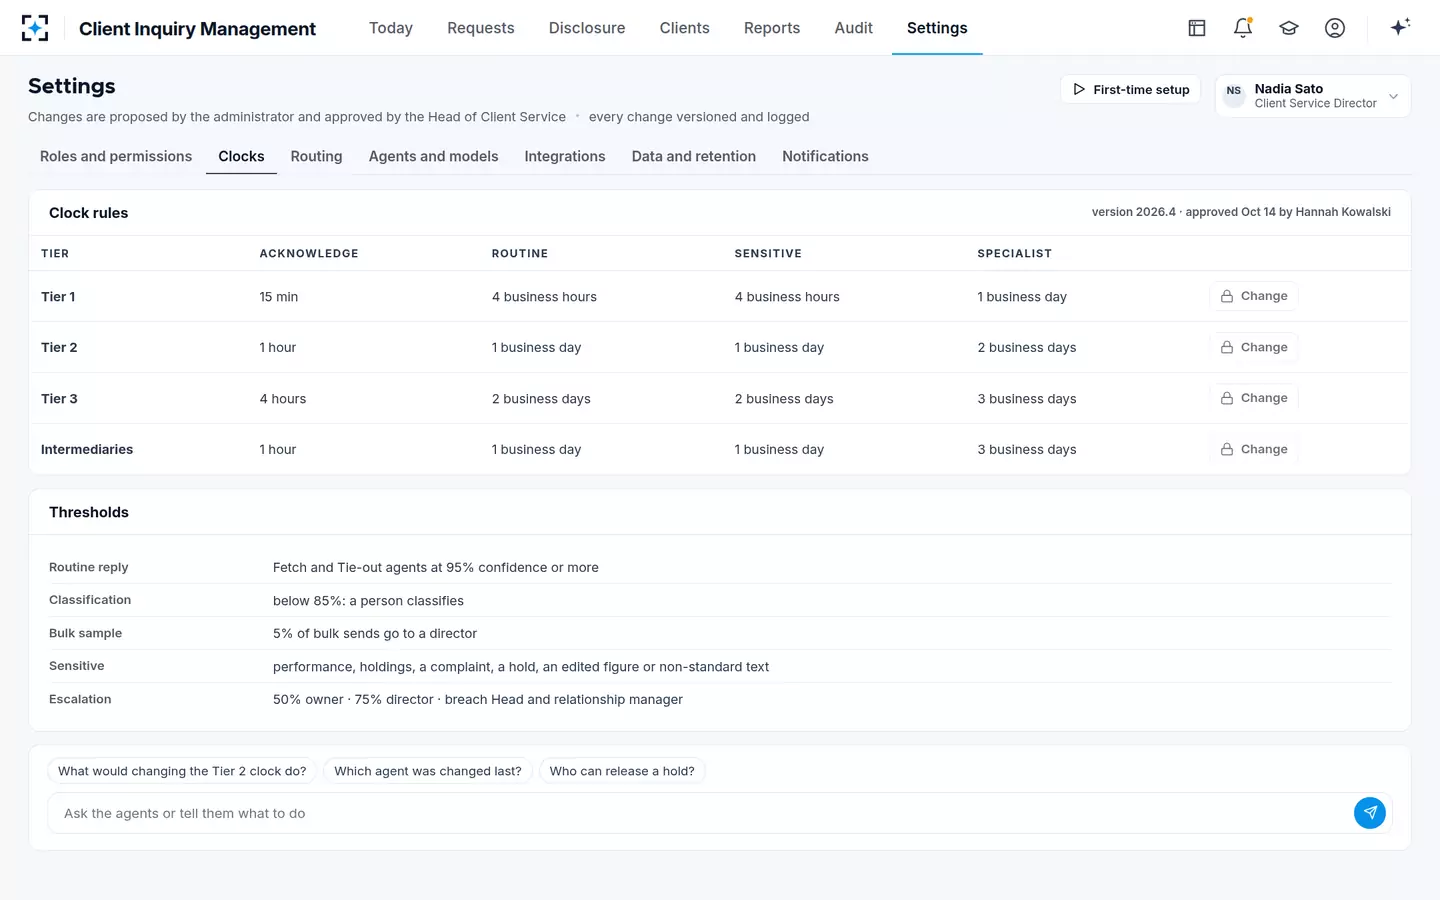
No regulator sets one, and no regulator or independent study publishes response-time benchmarks for institutional client requests at asset managers. A good response time is the one the firm promised: in the client's agreement or service schedule where one exists, and otherwise in the firm's own tier policy, set before the request arrives and measured in business hours. Complaints are different. Where the FCA's complaint rules apply, a firm must send a final response or an explanatory written response within eight weeks of receipt (FCA Handbook, DISP 1.6.2R), and a complaint inside an ordinary request starts that clock.
The sample firm's reply clocks, in business hours
Two design choices make a clock honest. It should run in business hours on the client's tier and the hardest question in the request, so a fee copy bundled with an attribution question gets the specialist clock. And it should pause only for a documented wait on the client, never because the firm is waiting on itself. The sample firm's escalation ladder notifies the owner at 50% of the clock, the director at 75% and, on a breach, the Head of Client Service and the relationship manager.
KPI 1 to 3: acknowledgement, time to complete and the on-time rate
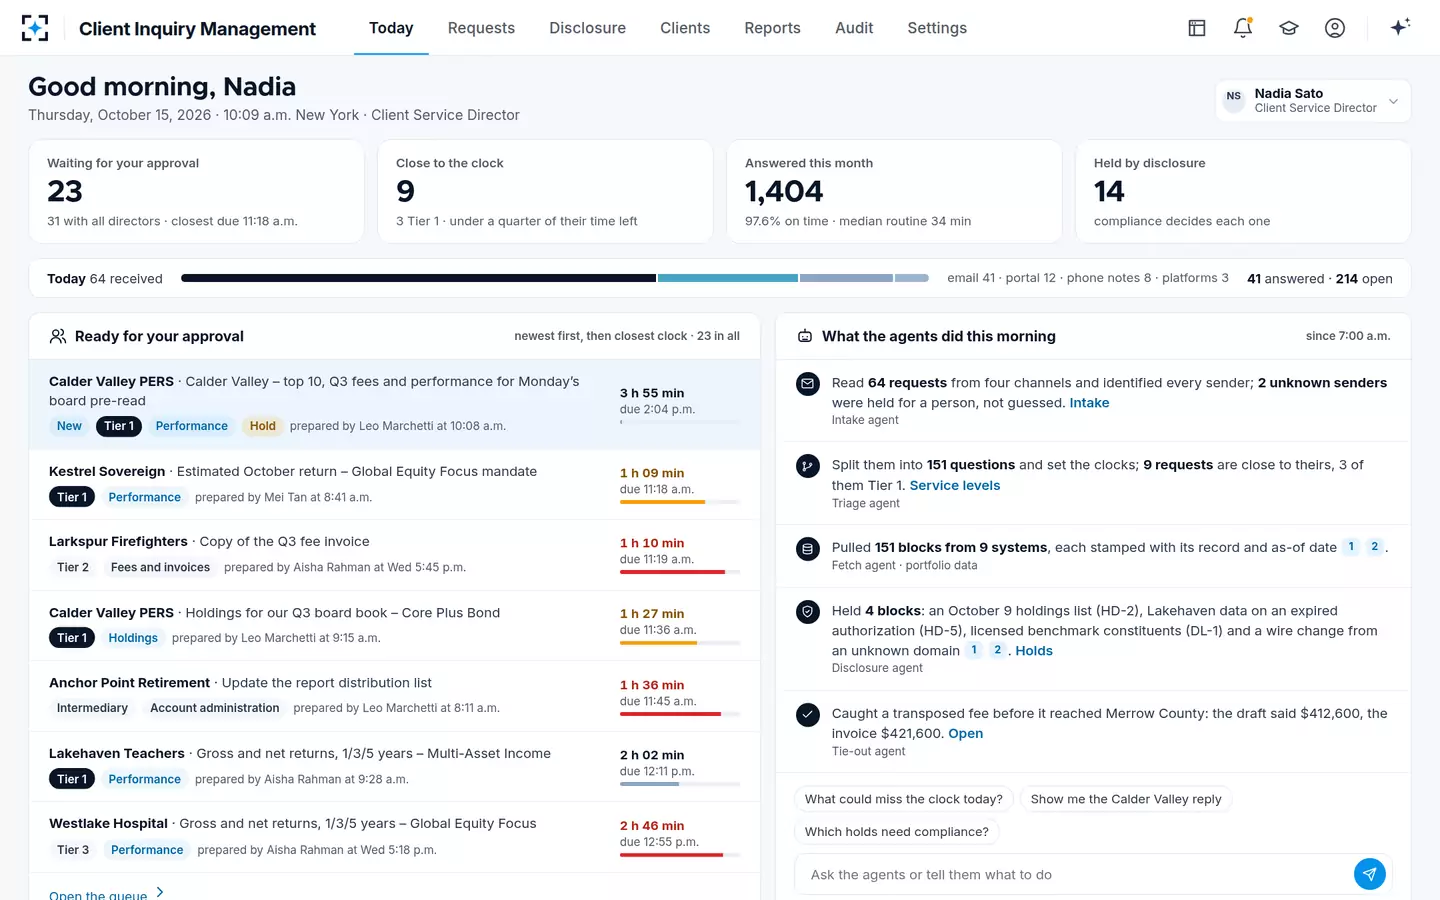
Report these three by tier and request type, as a median and a 90th percentile, never as a single average. The median shows the usual experience; the 90th percentile shows the clients who waited, and those are the ones who mention it at the annual review. On the sample firm's Today screen at 10:09 a.m. on October 15, the month's on-time rate stood at 97.6% of 1,404 answered requests, with a median of 34 minutes for routine replies.
The on-time rate needs its denominator stated. Counting only answered requests flatters it while overdue requests are still open; the sample firm shows the 9 requests close to their clock, 3 of them Tier 1, beside the rate, so a director sees the next breach before it lands in the month's figure.
The scorecard's live half: approvals waiting, clocks close, the month's on-time rate
KPI 4 and 5: paused clocks and reopened requests
Paused clocks and reopens are the two indicators that catch a scorecard being managed. A desk under pressure pauses clocks generously and closes requests early; both improve the on-time rate while the client waits longer. Report the share of open requests with a paused clock, with its reasons, and the share of closed requests that come back on the same question.
In the sample firm 19 of 214 open requests were waiting on the client at 10:09 a.m., each with a documented reason. A reopen is easiest to count where duplicate detection already exists: the Intake agent checks each new request against open and recent ones, so a second request for the same statement links to the first. A rising reopen rate on one request type usually means the first answer did not answer the question, which is a drafting or a sourcing problem, not a speed one.
KPI 6: figures corrected after sending
This is the indicator an examiner would ask for and most scorecards omit: the share of replies with figures that were followed by a correction. Its target is zero, and it should be reported beside its companion, the figures stopped before sending, because a low correction rate is only reassuring if the firm can show it was earned.
In the sample month the Tie-out agent stopped 27 figures that did not match their source, all fixed before sending, including a fee transposed in a draft as $412,600 against an invoice of $421,600. Every reply sent is a business communication the adviser must keep for at least five years under Advisers Act Rule 204-2, so a corrected figure leaves two kept replies, the wrong one and the correction, both available to an examiner.
One month of checks in Client Inquiry Management at the sample firm
27
figures stopped before sending because they did not match their source
46
disclosure holds raised on 3,862 answer blocks checked
5
of 32 decided holds released by compliance
58
requests about AI use, up from 31 the month before
KPI 7 and 8: disclosure holds and entitlement exceptions
Holds and entitlement exceptions measure the firm's disclosure policy as much as the desk. Report holds per 1,000 answer blocks by rule, and the share of decided holds that compliance released. A high release share means a rule is drawn too widely and slows replies; a rule that never fires may not be checked at all.
In the sample month the Disclosure agent raised 46 holds on 3,862 blocks, about 12 per 1,000, and compliance released 5 of the 32 it had decided. The kinds were instruction changes, consultant authorizations missing or expired, licensed data, interim holdings before release and preliminary performance. Entitlement exceptions, the requests held because a consultant's authorization had lapsed, are worth reporting separately: they are the error a familiar sender makes easy, and they fall when authorizations are renewed on time. How holdings requests are tested explains why the interim holdings rule fires most.
KPI 9: specialist share and specialist time
The specialist share is the proportion of open work waiting on a product specialist, portfolio manager or other desk outside client service. It is where clocks are lost, because the specialist's day is set by markets, not by the client's tier. Report it by desk, with the specialist's median time from routing to answer.
Thirty-seven questions with six specialist desks, each arriving with a drafted answer
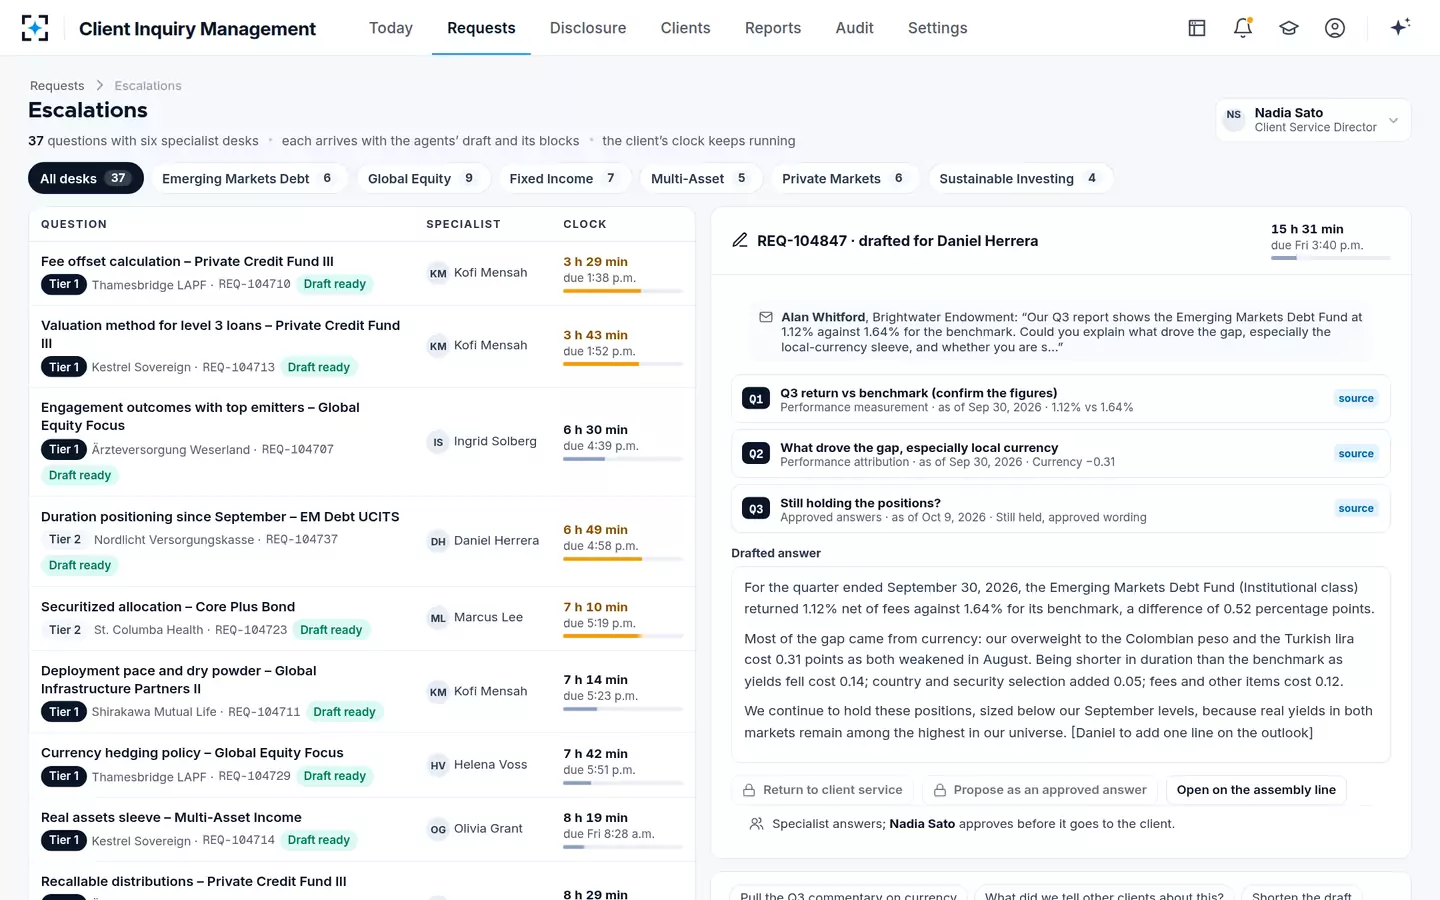
At 10:09 a.m. on the sample Thursday, 37 questions sat with six desks while 214 requests were open, a sizeable share of the open work depending on someone outside the team. Each arrived with the agents' draft and its sources, which changes the specialist's time from research to review. Whether that shortens specialist time is a question the KPI answers within a month.
KPI 10: what each request costs, built from wages
Cost per request is the indicator that turns the scorecard into a budget. It is people minutes per request, by role, multiplied by each role's loaded hourly cost. No regulator or independent study publishes this figure for asset managers, so measure your own: time a sample of each request type through each step for two weeks.
Cost per request, by request type
Associate time
minutes ÷ 60 × loaded hourly cost
Finding, checking and sending. BLS median pay for customer service representatives, the nearest category, was $21.53 an hour in 2025, wages only.
Head of Client Service
Director time
minutes ÷ 60 × loaded hourly cost
Approving sensitive replies; at the sample firm, any with performance, holdings, a complaint, a hold or an edited figure.
Client service director
Compliance time
minutes ÷ 60 × loaded hourly cost
Deciding holds and answering "may this go out?" questions.
Compliance
Specialist time
minutes ÷ 60 × loaded hourly cost
Product specialists and portfolio managers on escalated questions.
Investment teams
As an illustration only: a routine request that takes an associate 20 minutes costs $7.18 in wages at the BLS median, before benefits and overhead, and one that also needs 15 minutes of a director and 20 of compliance costs several times that. The figure that matters is the split. A request type whose cost sits mostly in compliance time is a disclosure-policy problem; one whose cost sits in associate search time is a data-access problem. The two have different fixes, and the second is the one mapping each handoff exposes.
A scorecard on one page, and who reads it
A one-page scorecard should carry the ten indicators for the month, the trend over six months and one line on each that moved. It is read by three people for three reasons: the Head of Client Service for staffing and the clocks, compliance for holds, entitlements and corrections, and the COO for cost per request. Under the FCA's complaint rules, a firm must also put in place management controls to identify and remedy recurring or systemic problems, for example by analysing the root causes of complaints (FCA Handbook, DISP 1.3.3R), and a scorecard that links complaints to the request types behind them is the simplest evidence of that analysis.
Before you publish the scorecard
- State every denominator
Answered or received, by tier, by request type.
- Report a percentile, not only an average
The 90th percentile is the client who complains.
- Put stops beside corrections
Figures caught before sending show the correction rate was earned.
- Show paused clocks and their reasons
A pause without a documented wait on the client is a missed clock.
- Split holds by rule
A rule that compliance mostly releases is drawn too widely.
- Link complaints to request types
Often the root cause is an earlier answer.
- Time the cost per request yourself
Two weeks of timed samples, by role and type.
A scorecard built this way needs data that most desks do not collect: a clock per request, a source per figure, a reason per hold. That is the practical case for tooling, and the reason Client Inquiry Management records each as the work happens; a pilot on last quarter's mailbox is how to see whether the counts hold on your own requests. The solution is at Client Inquiry Management.
Clocks and thresholds as settings in Client Inquiry Management: the scorecard's definitions
Questions people ask
What are examples of customer service KPIs?
The common ones are first response time, time to resolution, on-time rate against a service level, reopen rate, satisfaction score and cost per contact. An asset manager should add figures corrected after sending, disclosure holds and entitlement exceptions, because its costliest errors are accurate replies sent too early or to the wrong person.
What is the difference between customer service metrics and KPIs?
A metric is anything you can count; a KPI is a metric tied to a target and a decision. The sample firm counts 3,862 answer blocks checked in a month, a metric, but reports holds per 1,000 blocks and the release share, which tell compliance whether a rule is drawn too widely.
How many client service KPIs should a team track?
Few enough that each has an owner who acts on it. Ten is a ceiling for a monthly scorecard; a weekly view usually needs three: on-time rate by tier, requests close to their clock and holds open. Anything not read by its owner within a quarter should come off.
Is client satisfaction a useful KPI for institutional clients?
Per-reply surveys rarely work with pension and insurance investment staff, who will not answer them. Better signals are reopens, complaints logged from requests and the relationship manager's annual review. Where a client's service schedule sets response times, the on-time rate against it is the satisfaction measure the client will actually check.
Which client service KPI does compliance care about most?
Figures corrected after sending and disclosure holds missed, because each is a communication the firm must keep and may have to explain. Advisers keep written communications relating to their advice for at least five years under Rule 204-2. Compliance will also want the release share of holds, which shows whether its own rules are workable.
What customer service response time standards apply to asset managers?
No US or UK regulator sets response times for ordinary institutional requests; the standard is the client agreement or the firm's own tier policy. Complaint rules do set clocks: in the UK, where DISP applies, a final or explanatory response is due within eight weeks. The sample firm's Tier 1 reply clock is 4 business hours.