The financial ratios used in credit analysis measure three things: how much debt a company carries against its earnings (leverage, usually debt to EBITDA), how comfortably its earnings pay its interest (coverage, such as EBIT or EBITDA to interest, or fixed charge coverage), and how much cash it can reach (liquidity, cash plus undrawn revolver). The formulas fit on one line each. The work is in the inputs: debt from the 10-Q's debt note, EBITDA as the credit agreement defines it, and what the documents still allow the company to borrow. Botminds' AI Credit Analysis exists because those inputs live on different pages of different documents, so it traces every number in a ratio to the page it came from before an analyst reads it.
The worked example is a fictional issuer, Halvorsen Packaging, as it runs through the solution: sample data on fictional people and companies. Definitions and market figures come from the Federal Reserve and the SEC, linked where they appear.
How the Federal Reserve reads corporate leverage and coverage, May 2026
Bottom quartile
where the median interest coverage of non-investment-grade public firms sits in its history
4x
debt-to-EBITDA: the line the Fed uses to count highly levered new leveraged loans, a share above its historical median
~70%
of public nonfinancial firms’ debt owed by investment-grade borrowers, whose coverage remains robust
What ratios are used in credit analysis?
Credit analysts use three families of ratios, each answering a different question about repayment. Leverage asks how many years of earnings the debt represents. Coverage asks whether this year's earnings pay this year's interest and fixed charges. Liquidity asks whether the company can meet what falls due before earnings arrive. Everything else is a refinement of one of the three.
The core credit ratios, and where each input lives
| Ratio | Formula | Where the inputs come from | What the documents can change |
|---|---|---|---|
| Total leverage | Total debt ÷ EBITDA | Debt: 10-Q or 10-K debt note. EBITDA: income statement, or the agreement’s definition | Which debt counts; what EBITDA may add back |
| Senior secured or first-lien leverage | Secured debt ÷ EBITDA | Debt note plus the security described in the credit agreement and indentures | Which tranches share the lien; intercreditor ranking |
| Net leverage | (Total debt − cash) ÷ EBITDA | Balance sheet cash; the agreement may cap how much cash may be netted | Caps on netted cash; restricted cash excluded |
| Interest coverage | EBIT (or EBITDA) ÷ interest expense | Income statement; interest from the debt note for the run-rate | Which interest is "Consolidated Interest Expense" |
| Fixed charge coverage | EBITDA less items set in the agreement ÷ fixed charges | Agreement definitions; income and cash flow statements | Every term in both numerator and denominator |
| Liquidity | Cash + undrawn committed revolver | Balance sheet; revolver availability in the 10-Q liquidity section | Conditions to draw; a springing maturity |
| Debt to assets (gross leverage) | Total debt ÷ total assets | Balance sheet | Little: a book measure, used by the Fed for public firms |
Regulation gives the families their purpose. The SEC's money market fund rule requires the credit analysis behind an eligible security to consider, among other things, the issuer's financial condition, its sources of liquidity and its ability to repay debt in a severe downturn (17 CFR 270.2a-7(a)(11); the rule's full test is in Rule 2a-7 and minimal credit risk). Leverage and coverage speak to the first, liquidity to the second, and a stress case to the third.
One leverage ratio, traced from the page to the memo
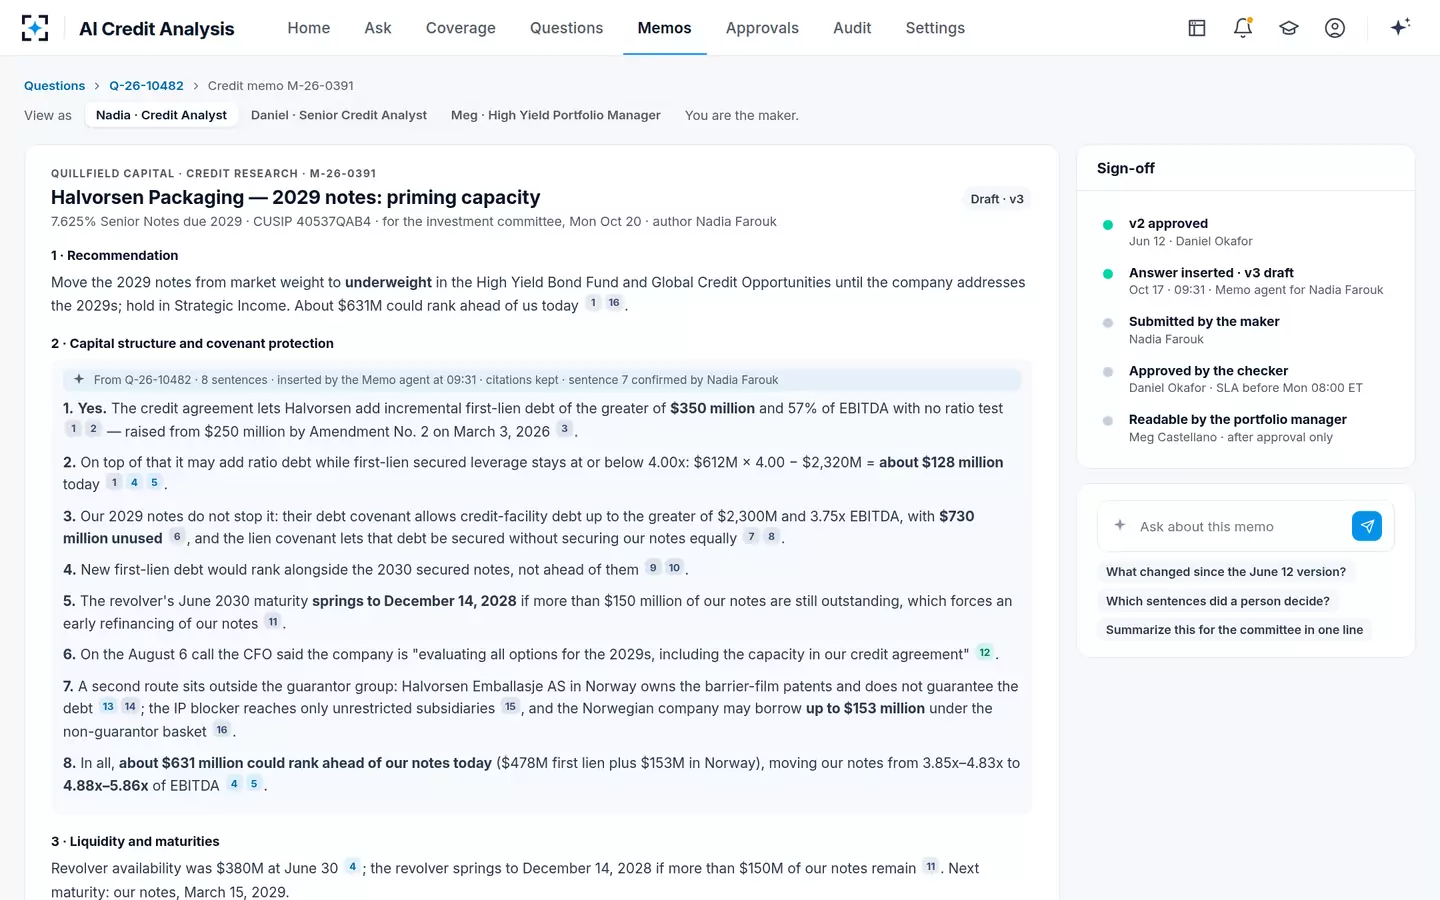
A leverage ratio is only as good as the two lines it divides, so the useful exercise is to follow one. In the sample, the analyst needs Halvorsen's leverage through the fund's 7.625% notes due 2029 today, and again if the company uses every basket that could put debt ahead of them.
One leverage ratio in AI Credit Analysis, from the 10-Q line and the definition to the signed sentence
Agent
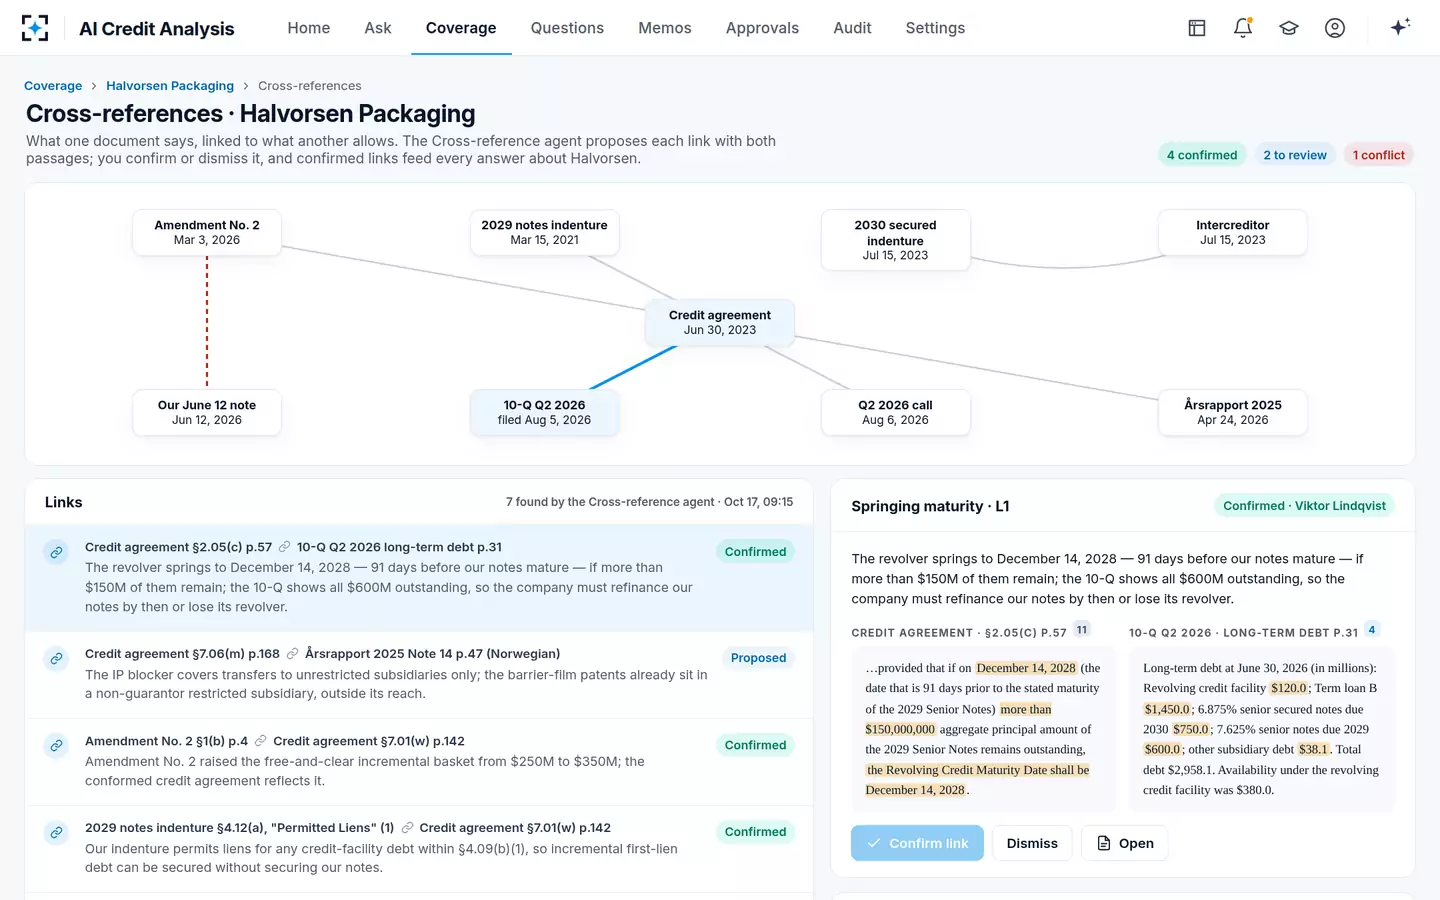
Filings agent reads the debtTakes total debt of $2,958.1 million from the 10-Q’s long-term debt note, page 31, tranche by tranche: revolver $120.0M drawn, term loan B $1,450.0M, 2030 secured notes $750.0M, 2029 notes $600.0M, subsidiary debt $38.1M.
Agent
Indenture agent reads the definitionReads "Consolidated EBITDA" in the credit agreement as amended and uses last-twelve-months EBITDA of $612 million on that definition, beside a capital structure built from four documents.
Never: Substitute a press-release EBITDA for the defined one.
Agent
Citation Checker recomputesRecomputes each ratio from its cited inputs: $2,358M ahead of the notes ÷ $612M = 3.85x; $2,958.1M ÷ $612M = 4.83x. Corrects one figure that had used press-release EBITDA.
Never: Pass a figure that differs by more than 0.5% from its recomputation.
A person decides
Analyst decides what the ratio meansReads the ratio against what the agreement still allows: about $631M of new debt could rank ahead, taking the notes to 4.88x–5.86x. Writes the recommendation by fund.
A person decides
Senior analyst signs the sentenceChecks the computed sentence and its cited inputs before Approve opens; the portfolio manager reads only the signed memo.
Two things in that chain are easy to get wrong by hand. The denominator must be the EBITDA the documents define, because the capacity being measured is the documents' capacity; the draft answer in the sample had picked up a press-release EBITDA, and the checker corrected it. And the numerator must be split by rank, because "leverage through our notes" means the debt that ranks ahead of them plus the notes themselves, not total debt in one number.
How to calculate the leverage ratio for a bond
To calculate leverage for a particular bond, add up the debt that ranks ahead of it, divide by EBITDA, and then add the bond itself to get leverage "through" it. The first figure tells you how much of the enterprise is claimed before you; the second where your last dollar sits.
Leverage through the fund's 2029 notes, step by step
| Step | Calculation | Result |
|---|---|---|
| 1. Debt ranking ahead of the notes | Subsidiary debt $38M + revolver drawn $120M + term loan B $1,450M + 2030 secured notes $750M | $2,358M |
| 2. Leverage ahead of the notes | $2,358M ÷ LTM EBITDA $612M | 3.85x |
| 3. Leverage through the notes | ($2,358M + notes $600M) ÷ $612M | 4.83x |
| 4. New debt the documents still allow ahead | $478M first lien + $153M at a non-guarantor subsidiary | $631M |
| 5. Through the notes with every basket used | ($2,958M + $631M) ÷ $612M | 5.86x |
| 6. The same, if EBITDA falls 15% to $520.2M | Baskets shrink to $500M; ($2,958M + $500M) ÷ $520.2M | 6.65x |
Step 6 is where leverage becomes analysis. A 15% fall in EBITDA does not just raise the ratio; it shrinks the baskets sized on EBITDA, which is why the new-debt figure falls from $631 million to $500 million while the ratio still rises. A spreadsheet that holds capacity fixed overstates the stress case.
Where the fund's notes sit, in turns of EBITDA
What is covenant EBITDA vs reported EBITDA?
Reported EBITDA is a measure a company presents to investors; covenant EBITDA is a contract term, defined in the credit agreement or indenture, and it is usually larger. The SEC draws the line in the name: its staff interpretation says that measures "calculated differently than those described as EBIT and EBITDA" in Exchange Act Release No. 47226 "should not be characterized as 'EBIT' or 'EBITDA' and their titles should be distinguished from 'EBIT' or 'EBITDA,' such as 'Adjusted EBITDA'" (SEC, Non-GAAP Financial Measures C&DI 103.01).
For ratios, the rule of thumb is to match the denominator to the question. Comparing the company's credit across issuers calls for a consistent, reported measure. Measuring what the documents allow the company to borrow calls for the documents' own measure, because that is the one the baskets are sized on. Mixing the two is the commonest error in a capacity sentence. The call's EBITDA vs the indenture's takes the gap apart line by line.
The memo shows each turn of leverage with its two cited inputs
What is the interest coverage ratio in credit analysis?
Interest coverage is earnings divided by interest expense: the number of times this year's earnings pay this year's interest. The Federal Reserve uses earnings before interest and taxes over interest payments, and reports that the median coverage of non-investment-grade public firms "stayed low, in the bottom quartile of its historical distribution", while coverage for investment-grade borrowers "remained robust" (Financial Stability Report, May 2026).
Analysts also use EBITDA over interest, which reads higher because it adds back depreciation and amortisation. Either is fine if it is labelled and used consistently. The trap is floating-rate debt: a term loan priced at a spread over SOFR changes the denominator every reset, so coverage on last year's interest can overstate next year's. The Fed makes the point directly about firms "that rely on floating-rate debt such as leveraged loans and private credit", whose debt-servicing capacity was lower.
What is a good debt to EBITDA ratio?
There is no regulatory answer for a bond investor; what counts as good depends on the industry's stability, the rank of the bond and what the documents allow later. The Federal Reserve's financial stability reporting uses debt to EBITDA of 4 or more to count highly levered new leveraged loans, and reports that their share "increased moderately and remained above the historical median". That is a monitoring line, not a standard.
For a bondholder the more useful question is where its own bond sits and how far that can move. In the sample, 4.83x through the notes today becomes 5.86x if every basket is used, without the company breaking a single covenant. A ratio that ignores the capacity the documents leave open describes the balance sheet, not the bond.
How to calculate net leverage
Net leverage subtracts cash from debt before dividing by EBITDA: (total debt − cash) ÷ EBITDA. It rewards a company for cash it could use to repay, which is fair if the cash is free and available. The Federal Reserve tracks a balance-sheet version, net leverage as debt less cash over total assets, and reports it "also remained elevated" for public firms.
In a credit agreement, net leverage is a defined term, and the definitions often limit which cash may be netted, cap the amount, or exclude cash held where it cannot be moved freely. The trace matters again: the cash figure has to come from the balance sheet and the netting rule from the agreement as amended.
What is the fixed charge coverage ratio?
Fixed charge coverage compares earnings with all the fixed obligations a company must meet, not just interest: typically interest, scheduled principal and, depending on the document, items such as capital expenditure, taxes or distributions taken out of the numerator. Because each agreement defines both sides, there is no single formula; the definition is the formula.
In high-yield indentures a fixed charge coverage ratio often does a different job, as the test for incurring new "ratio debt": the company may borrow as long as the ratio, pro forma for the new debt, stays above the level the indenture sets. That makes it a capacity ratio rather than a health ratio, and its threshold and definitions belong to the document, which is why the solution reads them rather than assuming them.
Which ratios do rating agencies use?
Rating agencies publish their own sector methodologies, which weigh leverage, coverage and cash flow measures differently by industry, and the SEC may not regulate their substance: the Exchange Act bars the Commission from regulating what a registered agency's ratings say or how its methods arrive at them (15 U.S.C. 78o-7(c)(2); who is registered, and what examiners found, is in NRSRO list 2026). Agencies also adjust reported figures in their own ways, so an agency's leverage for an issuer may not match yours.
For a buy-side analyst, the agency ratio is an input to check, not a number to copy. The ratios that decide a bond's protection are the ones its documents define, and the debt note that discloses them carries, under SEC rules, "a brief indication of priority" for each issue (Regulation S-X, Rule 5-02.22). How every tranche is mapped to the document that sets its rank is the subject of capital structure analysis.
Every input of the ratio linked to the page it came from
Questions people ask
What are the 5 Cs of credit, and where do ratios fit?
Character, capacity, capital, collateral and conditions. Ratios measure capacity (coverage), capital (leverage) and part of collateral (secured leverage); the documents decide the rest, such as which assets secure which debt and what the company may add later.
Should leverage use gross or net debt?
Use gross for comparisons and stress, net only where the cash is genuinely free and the agreement allows it to be netted. The Federal Reserve reports both for public firms and found both elevated relative to their histories in its May 2026 report.
Why does my leverage not match the company's?
Usually because the company uses its own adjusted EBITDA or a defined term from its credit agreement. SEC staff guidance says such measures should not be called EBITDA and should carry a distinguishing title, such as "Adjusted EBITDA", so the label usually tells you which number you are looking at.
How often should credit ratios be updated?
At least with every 10-Q and 10-K, and whenever an 8-K reports a new financing or a material amendment. In the sample, one issuer's ratio debt capacity fell from $160 million to $41 million after a 10-Q cut EBITDA by 9%, and the watched answer changed overnight.
What liquidity ratios do credit analysts use?
Cash plus undrawn committed revolver against the next 12 to 24 months of maturities and interest, alongside current and quick ratios for working-capital businesses. Check the revolver's conditions and maturity: in the sample, the revolver springs to December 2028, ahead of the notes it supports.