Farm financial ratios and benchmarks are the small set of numbers a lender uses to decide whether a farm can carry the debt it is asking for: how much cash it has above its near-term obligations, how much of the business the bank already owns, how far earnings cover the payments, and how much is left over per dollar of production. Four or five families of measures cover it, and the ones that decide an operating line renewal are not the ones that make the best headlines. Agricultural Loan Renewal Management, Botminds' agentic solution for farm operating line renewals, computes them from the borrower's own statements and crop plan every time a package is prepared, against the minimums the bank has written into its own credit policy rather than any published average.
The benchmarks below come from two different places, and keeping them apart is most of the skill. Sector-wide figures from USDA show what the measure looks like across American agriculture; policy minimums are what a particular bank will lend against. A farm can beat the first and fail the second on the same day. The borrower, the bank and the people here are fictional sample data from the solution: Brandt Family Farms, 2,840 acres, a $1,450,000 operating line maturing 1 March 2027 and a request for $1,650,000.
The sector balance sheet these measures are read against
$4.47T
forecast farm sector assets for 2026, up 3.0% in nominal dollars
$605.1B
forecast farm sector debt for 2026, up 4.6% — faster than assets or equity
13.54%
forecast sector debt-to-asset ratio for 2026, up from 13.34% in 2025
What are the farm financial ratios and benchmarks lenders use?
Five families, and each answers a different question. Liquidity asks whether the farm can meet what falls due inside a year without selling something it needs. Solvency asks who owns the business after the debts are paid. Repayment capacity asks whether the coming year's earnings cover the coming year's term payments. Profitability asks what is left after everything is paid for. Efficiency asks how hard the assets and the expense base are working, and usually explains why one of the other four moved.
USDA's Economic Research Service publishes the formula for each one it reports, which matters because the same ratio name hides several different arithmetics in the wild. Its documentation sets out, among others, the current ratio as current assets divided by current debt, measuring "the ability of current assets, if sold and converted to cash, to cover current debt"; the debt-to-asset ratio as total debt over total assets, measuring "the proportion of assets owed to creditors to cover outstanding debt obligations"; and the operating expense ratio as operating expenses over gross revenues, "the amount of cash the farm sector spends to generate a dollar of production" (USDA ERS, Documentation for the Farm Sector Financial Ratios).
The five families, the measure, and what each one actually answers
| Family | The measure that decides | The question behind it |
|---|---|---|
| Liquidity | Working capital, and working capital to gross revenues | Can the farm pay what falls due in twelve months without selling ground or machinery? |
| Solvency | Debt to assets; equity to assets as its mirror | After the debts, how much of the business belongs to the family? |
| Repayment capacity | Term debt coverage, and the dollar margin inside it | Does next year's earning power cover next year's scheduled principal and interest? |
| Profitability | Net farm income, and return on assets from income | Is there anything left after every factor of production is paid? |
| Efficiency | Operating expense ratio; asset turnover | How much production does each dollar of assets and expense buy? |
Liquidity: how much working capital does a farm need?
There is no universal figure, which is why the measure is almost always expressed against the size of the operation rather than on its own. ERS reports working capital as current assets less current debt, and working capital to gross revenues as that difference divided by gross revenues, because a million dollars of cushion means one thing on a $2 million business and another on a $20 million one. Credit policies usually set the threshold the same way: the sample bank's minimum is working capital of at least 15 percent of revenue, which on a plan showing $2,221,712 of gross revenue is $333,257.
The dollar figure beats the ratio in one specific situation, and it is the common one. A farm that carries a lot of operating debt maturing inside the year can show a respectable current ratio while having almost no room to absorb a late payment or a price move, because both sides of the fraction are large. The difference — the dollars — is what is actually available. ERS makes the same point in its own definition of working capital: it is the cash available to fund operating expenses after paying debt to creditors due within twelve months.
The direction of travel matters more than the level in most renewal seasons, and the recent direction has not been kind. Sector working capital fell 15.0 percent in 2025 and is forecast to recover only 3.5 percent in 2026, and ERS adds that other liquidity measures point the other way: "other measures, such as the debt service ratio, show liquidity worsening in 2026" (USDA ERS). Two liquidity measures disagreeing is not a contradiction; it means the cushion stopped shrinking while the claims on it kept growing.
Solvency: what a good debt to asset ratio for a farm really is
Across American agriculture, debt to assets is forecast at 13.54 percent for 2026, up from 13.34 percent in 2025. That figure is the right benchmark for exactly one purpose — knowing where the sector sits — and the wrong one for deciding a loan. The sector number is dominated by farmland carried at market value on balance sheets that have had decades of appreciation, and farm real estate is 83 percent of total farm sector assets. A young operation that rents most of its ground has none of that ballast, and a debt-to-asset ratio three or four times the sector average without being in any trouble.
The sector's own solvency, and the line a credit policy draws
A credit policy maximum of 60 percent debt to assets, which is where the sample bank sets it, is therefore not four times more generous than the sector. It is a different test on a different unit: one farm, with one lender's exposure, measured on a balance sheet the bank has seen. The useful discipline is to ask what the ratio would be at a lower land value. A farm at 55 percent with ground carried at a recent peak is at a very different number if that peak gives up ten percent, and the farm's own equity is the only thing that absorbs it.
The equity-to-asset ratio is the same fact stated the other way — ERS defines it as "the proportion of farm assets that were financed by the owner's capital (equity)" — and it is the version worth putting in front of a borrower, because it is the number they feel.
Repayment capacity: what is the term debt coverage ratio?
Term debt coverage is the ratio of the cash a farm can put toward scheduled debt to the scheduled debt itself. It is the measure that most often decides whether a renewal goes through as asked, because it is forward-looking: it is computed from the coming year's plan, at prices the bank is willing to underwrite, with every scheduled principal and interest payment on the other side.
Term debt coverage on the sample renewal, and the dollars inside the ratio
Capacity for debt service
Gross revenue at the bank's price deck − operating costs − family living − taxes + non-farm income
$400,592 on the 2027 plan at $4.20 corn and $10.40 soybeans
Crop plan and cash flow builder
Scheduled term payments
Principal and interest on all term debt, including the carryover term-out
$339,515, which includes $45,815 a year for the new five-year carryover note
Term debt coverage
Capacity ÷ scheduled payments
$400,592 ÷ $339,515 = 1.18x, against a 1.25x policy minimum
The margin in dollars
Capacity − payments
$61,077 of room; clearing 1.25x would need $424,394 of capacity, $23,802 more
Read the ratio and the dollars together and the conversation changes. At 1.18x the file is 7 basis points of ratio short of policy, which sounds like a rounding question; in dollars it is $23,802 of additional capacity on a plan grossing over $2.2 million, which is about one percent of revenue. That is small enough to be reached by a condition — contracting stored grain, trimming a capital purchase — and precise enough to write one. A memo that reports only the ratio leaves the approver no way to size the fix.
Two traps sit inside this measure. The first is which payments count: a renewal that terms out carryover adds a payment that did not exist last year, and coverage computed without it is coverage for a structure the bank is not approving. The second is whose prices built the capacity. If the numerator uses the borrower's price expectations and the denominator uses the bank's debt schedule, the ratio is a hybrid of two worldviews. The solution avoids it by rule: the agents never price above the deck the chief credit officer sets.
Profitability and efficiency: the measures that explain the other three
Profitability rarely decides a renewal on its own, and it always explains one. A farm whose coverage slipped and whose working capital shrank in the same year did not have two problems; it had one, and it shows up in the income statement. ERS's operating profit margin ratio and its rates of return on assets and equity are the sector-level versions; on a single farm, the practical questions are what a crop acre actually returned and whether the expense base moved.
For row-crop farms, the published budgets make the second question answerable. The University of Illinois's 2027 crop budgets project net farmer return on corn, after all costs including cash rent, at "$28 to $36 per acre for the northern and central Illinois regions while projected corn returns for southern Illinois are negative at -$61 per acre", with soybean returns of $68 to $86 and $18 respectively (Paulson, Schnitkey, Zulauf and Zwilling, farmdoc daily). Those are margins measured in tens of dollars an acre against costs measured in hundreds. On a farm that size, a ten percent miss on either side of the equation does not reduce the return; it removes it.
That is the real reason the liquidity and coverage measures do so much work in agricultural lending. The margin is thin enough that a single year's result tells you little about the business, and the balance sheet has to carry the risk the income statement cannot.
The income the ratios are computed on, at sector level
$158.4B
forecast 2026 net farm income — down $4.3 billion, or 2.6%, in nominal dollars
$176.4B
forecast 2026 net cash farm income, up 0.4% nominally and down 2.5% after inflation
$121,700
forecast average net cash farm income per farm business in 2026, up 7.1% nominally
Where farm financial benchmarks come from, and which ones bind
Three sources get used as benchmarks, and only one of them binds a loan decision.
Sector statistics — the ERS figures quoted above — describe the whole population on a consistent method. They are the right reference for a board paper or a portfolio review and the wrong one for a file, because no individual farm looks like the aggregate.
Peer group data from state farm business associations and university programmes compares like with like: same state, same enterprise, similar size. This is the most useful outside reference an analyst has, and the caution is simply to check what the peer group is before leaning on it.
The bank's own credit policy is the only one that decides anything. The Comptroller's Handbook on agricultural lending expects it to exist and to be specific, listing among what underwriting standards should contain "minimum standards for borrower debt service, net worth, liquidity, and leverage" alongside maximum advance rates, maximum loan term and minimum amortisation (OCC, Agricultural Lending). A ratio that beats the sector and misses the policy is a declined request with a good talking point.
The same measure, read as a statistic and read as a limit
As a sector statistic: Every farm in the country, aggregated on one method.
As a credit policy limit: One borrower, on a balance sheet the bank has in the file.
As a sector statistic: USDA, from survey and administrative data, forecast twice a year.
As a credit policy limit: The bank, from the borrower's own statements at a stated date.
As a sector statistic: Land values, commodity prices, aggregate debt — mostly outside any one farm.
As a credit policy limit: This borrower's year, this borrower's structure and this borrower's plan.
As a sector statistic: Knowing whether the whole book is lending into a better or worse year.
As a credit policy limit: Deciding whether this request is approved, conditioned, or declined.
As a sector statistic: Quoting it at a borrower as though it were a target.
As a credit policy limit: Setting it from the sector average rather than from the bank's own loss experience.
Reading the five together on one operating line
Measures taken one at a time produce a list. Taken together they produce a credit. On the sample renewal the five lines fall in a particular order, and the order is the finding: profitability was short, which drew down liquidity, which left a carryover balance, which added a term payment, which is why coverage no longer clears. Nothing in that chain is a surprise once it is written out, and the point of writing it out is that the condition that fixes it has to be aimed at the first link, not the last.
The scorecard a renewal memo should be able to produce
- Liquidity: working capital in dollars and as a share of revenue
Against the policy minimum — 15 percent of revenue at the sample bank — and against the same measure a year ago.
- Solvency: debt to assets, with the land valuation named
Against the policy maximum, plus the same ratio at a lower land value, so the margin is visible.
- Repayment capacity: term debt coverage, and the dollars inside it
Computed on the coming year at the bank's price deck, with every scheduled payment included — the new carryover note among them.
- Profitability: last year's result against last year's plan
With the variance split between yield and price, so the cause is on the page and not just the size.
- Efficiency: the expense base, year over year
Operating expense against gross revenue, and the two or three input lines that moved most.
- Every measure at the same statement date
Same date this year as last, so a change in the ratio is a change in the business and not a change in the calendar.
- The stress case beside every measure
What each one reads at the policy stress — corn down ten percent and yield down ten percent at the sample bank.
Measuring at the same date every year
The least glamorous rule on that list is the one that quietly invalidates the most analysis. The Comptroller's Handbook puts it directly: "Consequently, analyses of inspections, budget or cash flow projection variance, net worth change, leverage, liquidity, and cash flow should be compared with the same periods from prior years."
In farming the reason is physical. The handbook's own illustration is a grain farmer who plants in spring, draws the line to buy seed and fertilizer, and at that point has almost nothing standing in the field; comparing that moment with a figure taken just before harvest, when the grain has matured, has what the booklet calls negligible meaning. The same applies to every balance-sheet ratio: current assets in January, with the bins full and the inputs unbought, bear no relation to current assets in June.
The practical form of the rule is to fix a statement date per borrower, keep it, and match the financial statements to the tax year so accrual adjustments can be made against a return. Where a farm changes its year end, say so on the memo rather than letting the comparison quietly stop meaning anything.
The measures as the solution computes them, beside the plan they come from
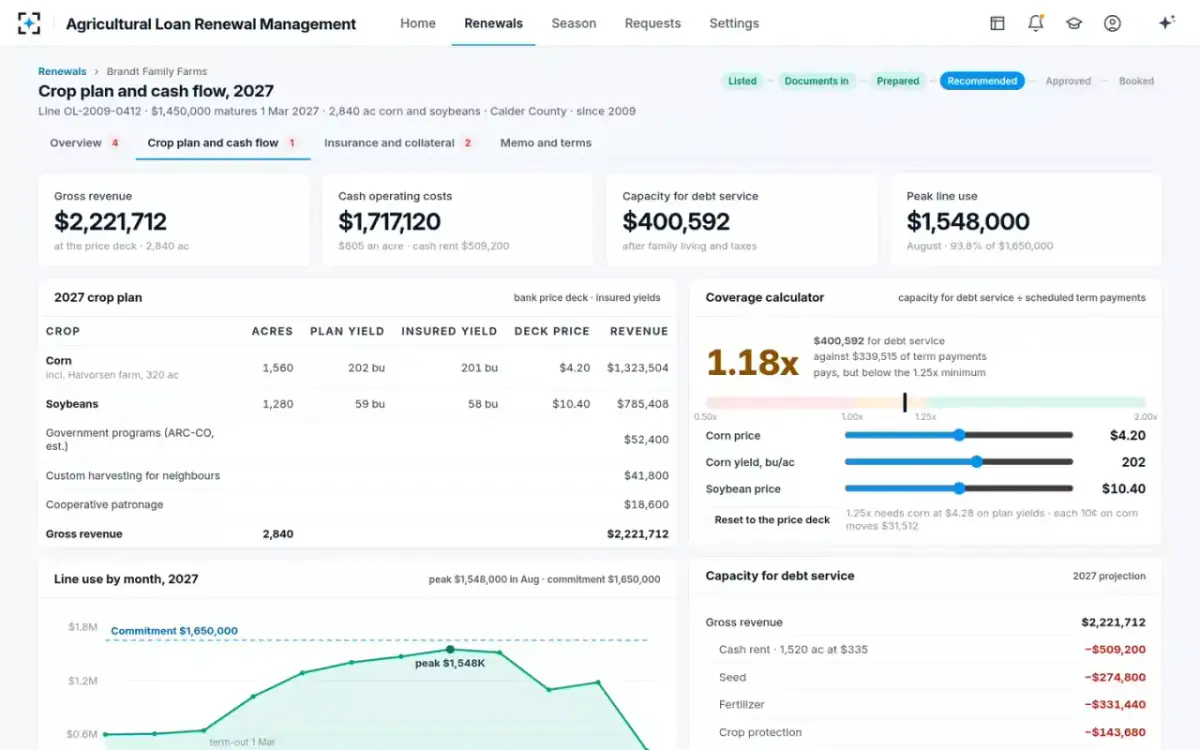
How the measures reach the renewal memo
The policy minimums themselves are settings rather than code: minimum coverage, working capital as a share of revenue, maximum debt to assets, how stored grain is valued, the stress case and every approval limit. Changes are versioned and apply to files prepared from then on, which is what makes a portfolio comparable across a season — every file in it was judged against the same numbers, and the few that were not say so.
The minimums every file is measured against, as settings
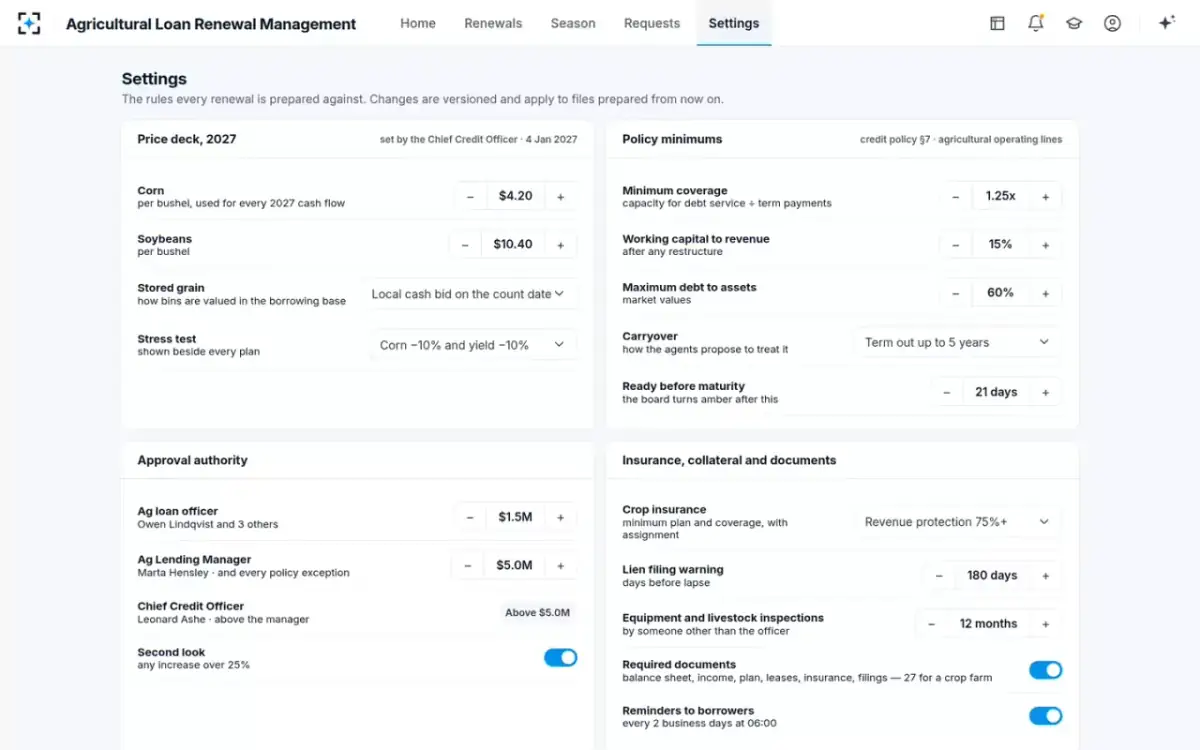
From there the measures do their work in the renewal rather than in a report. Coverage below the minimum raises a policy exception and routes the file above the officer's authority. Working capital below the minimum becomes a condition. A debt-to-asset reading that only clears at a generous land value becomes a sentence in the memo rather than a silence. Where in the season the coverage line is rebuilt at the bank's prices is set out in the farm operating loan renewal process, stage by stage, and the balance that produced the extra term payment in what carryover debt is on a farm operating loan. To see the five measures on a season of your own files, start from Agricultural Loan Renewal Management.
Questions people ask
What is a good current ratio for a farm?
Most credit policies want current assets comfortably above current debt, and many ag lenders look for something in the region of 1.5 to 2.0 before they stop asking questions — but the figure is a policy choice, not a published standard. The more informative reading is the dollar difference, working capital, measured against revenue, because a large farm and a small one with the same ratio have very different amounts of room.
Which single ratio matters most at a renewal?
Term debt coverage, because it is the only one computed on the year being approved rather than the year that finished. Liquidity decides whether the farm survives a bad quarter; solvency decides what is left if everything stops. Coverage decides whether the structure in front of the approver works at the prices the bank is prepared to underwrite, which is the question the renewal actually asks.
How often should farm financial ratios be measured?
At least annually, at the same date each year, and matched to the borrower's tax year so accrual adjustments can be made against the return. Larger operations — feedlots and dairies especially — are often measured on interim statements as well, because their inventory and receivables turn over far faster than a row-crop year does.
Why does the sector debt-to-asset ratio look so low?
Because farmland dominates the denominator. Farm real estate is forecast to be 83 percent of total farm sector assets in 2026, carried at market value, and decades of land appreciation sit in that figure. An individual farm that rents most of its ground carries very little of that asset and will show a much higher ratio without being a worse credit.
Should a lender use peer group benchmarks or its own minimums?
Both, for different jobs. Peer group data from a state farm business association explains why a farm's expense base or yield differs from similar operations nearby, which is analysis. The bank's own minimums decide the request, and the supervisory expectation is that those minimums exist in writing and cover debt service, net worth, liquidity and leverage.
Do these ratios work for livestock and dairy as well as row crops?
The families do; the benchmarks and the timing do not transfer. A feeder operation turns its inventory several times a year and is expected to be self-liquidating, so its liquidity and coverage are read on a much shorter cycle than a row-crop farm's single annual harvest. The rule that survives across all of them is measuring at the same point in the production cycle each year.