A protocol deviation rate is the number of protocol deviations divided by something that measures how much trial happened — participants, visits or exposure — and the most widely cited published benchmark puts a Phase 3 protocol at a mean of 118.5 deviations, a Phase 2 protocol at 75.3 and a Phase 1 protocol at 8.7. The reason a trial manager cannot act on those numbers is in the same paper: the coefficient of variation around them sits between 1.7 and 2.0, so two honest Phase 3 studies can differ by an order of magnitude without either being badly run. A rate becomes a signal only when it is calculated per site, over exposure rather than over protocols, and judged against the study's own distribution. Botminds' Protocol Deviation Management recalculates exactly that rate every night — important deviations per 100 participant-visits, by site, by cause and by team — and raises one alert, with one proposed action, when a rule a study has set for itself fires.
The worked study below is sample data: Northwind Bio's VLT-302, Veltrimab in plaque psoriasis, Phase 3, 64 sites and 612 participants, run partly through the contract research organisation Ashgrove Research. The sponsor, the drug, the sites and the people are fictional characters in the solution's own sample study. The benchmarks are published research, linked where they are used.
What is a normal protocol deviation rate?
There is no normal rate, and one of the few published benchmarking studies is the reason why. A Tufts Center for the Study of Drug Development working group collected design and performance data on 187 protocols from nearly two dozen companies and published the result in 2022. Its headline is quotable: "phase II and III protocols have a mean total of 75 and 119 protocol deviations, respectively, involving nearly one-third of all patients enrolled in each clinical trial. Oncology clinical trials have the highest relative mean number of protocol deviations affecting more than 40% of patients enrolled in each trial" (Getz, Smith, Jain and Krauss, Therapeutic Innovation & Regulatory Science, 2022).
That is a benchmark for a portfolio, not for a study. It answers "is our programme unusual?" and it cannot answer "is Site 114 unusual?", which is the question a trial manager actually has. The distance between those two questions is most of this guide.
What 187 protocols produced, by phase
8.7
mean total deviations per Phase 1 protocol
15.3% of patients affected · coefficient of variation 1.8
75.3
mean total deviations per Phase 2 protocol
30.0% of patients affected · coefficient of variation 2.0
118.5
mean total deviations per Phase 3 protocol
32.8% of patients affected · coefficient of variation 1.7
108.8
mean deviations per combined Phase 2 and 3 oncology protocol, against 91.9 outside oncology
46.6% of oncology participants affected, against 27.4%
The published benchmarks, by phase and by disease area
Three details in that table change how it should be used. The first is that these are total deviations, with no importance filter: a consent form missing an initial counts the same as an enrolment that breached an eligibility criterion. The second is the proportion of patients affected, which rises from 15.3% in Phase 1 to about a third in Phase 2 and Phase 3 — so on a 612-participant study, two hundred participants carrying at least one deviation is ordinary rather than alarming.
The third is disease area. Combined Phase 2 and Phase 3 oncology protocols averaged 108.8 deviations against 91.9 outside oncology, and involved 46.6% of participants against 27.4% — "nearly double the proportion observed in non-oncology protocols", as the paper puts it. Rare-disease indications ran lower, at 78.1 deviations and 27.7% of participants. A dermatology study and a solid-tumour study cannot be held to the same number, and neither can two dermatology studies with different endpoint counts.
Why the average is almost useless on its own
The authors say so themselves, in the sentence that should travel with every quotation of the mean: "The coefficients of variation around the mean number are very high — between 1.7 and 2.0 — indicating that total deviations per protocol are widely dispersed and inconsistent" (Tufts CSDD, 2022, Results). A coefficient of variation of 1.7 on a mean of 118.5 means a standard deviation of roughly 200. The distribution is not a bell around 119; it is a long tail, and a study at 300 deviations may be perfectly well run.
The paper then explains a large part of that dispersion, and this is its most useful result for anyone setting an expectation. Logistic regressions tested nine design variables against whether a protocol landed in the high-deviation half of the sample. "5 of the 9 variables tested were significant (endpoints, eligibility criteria, distinct procedures, countries, and sites) indicating that as each of these design variables increased, the odds ratio that a protocol would be in the 'HIGH' deviation cohort also increased." Four others — total procedures, procedures per visit, total visits and visits per month — did not.
What actually predicts a high-deviation protocol
| Design variable | Odds of landing in the high-deviation half, per unit increase (95% CI) | p |
|---|---|---|
| Number of countries | 1.191 (1.103–1.285) | < .001 |
| Number of distinct procedures performed | 1.096 (1.047–1.147) | < .001 |
| Number of endpoints | 1.054 (1.015–1.094) | < .01 |
| Number of eligibility criteria | 1.046 (1.011–1.083) | < .01 |
| Number of investigative sites | 1.036 (1.021–1.052) | < .001 |
| Number of procedures performed per visit | 1.033 (0.989–1.079) | .142 — not significant |
| Total number of procedures performed | 1.001 (1.000–1.003) | .147 — not significant |
| Number of planned participant visits | 1.001 (0.975–1.028) | .928 — not significant |
| Participant visits per month | 0.974 (0.943–1.005) | .099 — not significant |
Read that table as a design brief and it says something useful: breadth drives deviations more than depth. Adding countries and distinct procedure types raises the odds much faster than adding visits or procedures of a kind the site already performs. It also says that a study comparing its own deviation count with an industry mean is comparing two different designs, which is why the comparison that works is internal — this site against the other sixty-three on the same protocol.
How do you calculate a protocol deviation rate?
Count the deviations you care about in the numerator, count the trial activity that could have produced them in the denominator, and fix a window. The formula below is the one the sample study uses, and every term in it is a choice worth arguing about once and then writing down.
Important deviations per 100 participant-visits, by site
The numerator
important deviations with a confirmed classification, at this site, in the window
Confirmed only: a proposal that may be overturned next week is not a measurement. Deviations still awaiting a decision are counted separately and reported as such, not folded in or silently dropped.
The medical monitor, by signing
The denominator
participant-visits actually conducted at this site in the window
Visits that happened, not visits that were planned. A site that enrolled nobody for two months should not look clean; a site that ran 400 visits should not look dirty for having run them.
The trial database
The scale
× 100
Per 100 participant-visits keeps the figure readable — 2.0 rather than 0.02 — and makes the threshold a number people can say out loud in a meeting.
Convention
What comes out
excluded from both terms: study-wide causes
A deviation caused by an ambiguous protocol section or a supply failure belongs to the sponsor, not to the site that reported it. Leaving it in the site rate punishes the sites that read the protocol most carefully.
The classification specification
Choosing a denominator: participants, visits or exposure
The denominator decides what the rate means, and the three common choices answer three different questions.
Per protocol — the Tufts benchmark — answers "how much deviation does a study of this shape generate?" It is the right unit for portfolio planning and the wrong one for everything operational, because it cannot be computed until the study ends and cannot be attributed to anyone.
Per participant answers "how likely is a participant to be affected?", which is the right framing for a safety discussion and for the proportion figures in the benchmark. Its weakness on a live study is that it moves with enrolment: a site that enrolled four participants two years ago and has run them through forty visits each looks identical to a site that enrolled four last month.
Per participant-visit answers "how reliable is the work being done here?", and it is the one that behaves when sites open at different times, enrol at different speeds and sit at different points of the visit schedule. It is also the denominator that lets an early signal appear early: a site that has run thirty visits and produced three important deviations is visible in week six, long before its participant count means anything.
Exposure-based denominators — participant-months on treatment — are worth the extra work where the deviations of interest are dosing deviations, because dosing errors scale with time on drug rather than with clinic attendance. Most studies do not need two denominators, and a study that publishes one rate with a clearly stated denominator is in a much better position than a study that quietly uses three.
Counting important deviations only, and what that costs you
The sample study's rate counts important deviations only, and that choice has a sharp edge. The benefit is obvious: a rate built on all deviations tracks how diligently a site reports, so the site with the best quality culture — which writes up every three-day window breach — ranks worst. Filtering to important deviations removes most of that perverse incentive, because importance is judged against the protocol rather than against the reporter's conscientiousness.
The cost is that the rate now depends entirely on classification consistency. If one organisation calls an untrained-assessor finding important and another does not, the two sets of sites are being measured with different rulers, and the resulting ranking is an artefact. That is why a rate is a second-order instrument: it is only as good as the classification underneath it, and the definition of an important protocol deviation and the two tests it turns on is where the work has to be done first.
Two practical defences follow. Classify against one written specification per study, so the word "important" means the same thing at every site and in every organisation. And publish consistency as a measure in its own right — the sample study's dashboard shows agreement with the medical monitor's final call by team, which over its last 30 days of sample data ran at 96% for the classifier, 91% for the in-house team and 86% and 79% for the two contract organisations. A ranking built on the 79% column alone would be mostly noise.
Why a count cannot rank sites, and a rate can
Setting a site threshold that fires on signal, not on volume
A threshold is a promise that somebody will look. Set it so that more sites trip it than anyone has time for and it becomes a report nobody reads; set it where only a catastrophe reaches it and the instrument has no function. Three rules of thumb survive contact with a real study.
Set it from your own distribution, not from a benchmark. Compute every site's rate over the study to date, look at where the tail starts, and put the line there. On the sample study the line is 2.0 important deviations per 100 participant-visits. That number has no external authority at all; it is where that study's sites stop clustering.
Require a minimum denominator. A site with eight visits and one important deviation sits at 12.5, and means nothing. Suppressing sites below a floor — fifty visits, say — removes most false alarms at little cost in sensitivity, because a genuine problem at a new site will cross the floor within weeks.
Pair the level rule with a pattern rule. The level catches a site that is bad; a repeat rule catches a site that is going wrong. The sample study runs three rules together: the same cause at one site three times in 60 days; a site above 2.0 important deviations per 100 participant-visits; and a team whose missed pre-dose tests run above twice the study rate. Site 114 trips the first and the second.
FDA's draft guidance on protocol deviations is clear about what a sustained high rate is evidence of, and about where the escalation ends. "A high number of protocol deviations at a specific site or sites may suggest that additional resources (e.g., staffing, training) may be needed. Sponsors should consider closing a trial site when despite attempts at remediation, the site is unable to maintain GCP standards, comply with the protocol, or implement measures to identify and/or address recurring important protocol deviations" (FDA, Protocol Deviations for Clinical Investigations, draft guidance, December 2024). Resources first, closure last, and both of them responses to a pattern rather than to a number.
Quality tolerance limits are a different instrument entirely
Teams setting a site threshold often ask whether they have just set a quality tolerance limit. They have not, and conflating the two produces a document that satisfies neither purpose. ICH E6(R3), the good clinical practice guideline finalised in January 2025, puts quality tolerance limits at the trial level and attaches a specific obligation to breaching one. Where relevant, the sponsor sets acceptable ranges in advance — quality tolerance limits are its example — on the factors critical to quality, at levels which, once exceeded, could affect participant safety or the reliability of the results; and when a range is exceeded, the sponsor has to evaluate whether a systemic issue lies behind it and whether action is needed (ICH E6(R3) §3.10.1.3).
A quality tolerance limit and a site trending rule, side by side
Quality tolerance limit: A critical-to-quality factor for the whole trial — the rate of a specific, pre-identified departure that would threaten participant safety or the reliability of results.
Site deviation trending rule: A site’s observed rate of important deviations, or a repeating cause, against the study’s own distribution.
Quality tolerance limit: The trial. One number for the study, agreed before it starts.
Site deviation trending rule: The site, the cause or the team. Dozens of comparisons, recalculated as data arrive.
Quality tolerance limit: The sponsor, during risk assessment, before first participant in. Changing it mid-study is a documented decision.
Site deviation trending rule: The trial manager and quality lead, adjusted as the study’s own distribution becomes visible.
Quality tolerance limit: An evaluation "to determine if there is a possible systemic issue and if action is needed", and reporting of the breach and its remedial actions in the clinical trial report.
Site deviation trending rule: A look, and usually one action at one site. No regulatory consequence attaches to the rule itself.
Quality tolerance limit: Few. ICH E8(R1) warns against cluttering a trial’s critical-to-quality factors with minor issues.
Site deviation trending rule: As many as the team will act on, which in practice is a handful.
Quality tolerance limit: That the risks named up front have stayed inside their ranges — which is itself worth reporting.
Site deviation trending rule: Very little. A quiet trending rule often means the denominator is too small or the threshold too high.
The practical point is that a quality tolerance limit breach is reportable and a site trending alert is not. Running the two through one mechanism means either reporting dozens of site alerts in the clinical trial report, or quietly suppressing a breach that should have been reported. Where deviations fit in a risk based quality management stack takes that layering further.
What a trending rule should propose when it fires
An alert that says "Site 114 is above threshold" is a fact looking for an owner. The sample study's design is that every alert carries one proposed action and one person's name, and the proposal is derived from the cause rather than from the level. Site 114's alert reads: three assessments by staff not on the site's training log in 58 days, rate 3.1 against a threshold of 2.0, up from 0.8 since May, the highest on the study — and two more participants reach their Week 16 visit before 30 October. The proposed action is retraining, this week, because the primary endpoint assessment is what is at risk.
The last clause is what makes the alert worth reading. A rate tells you a site has a problem; the forward look tells you what it will cost if nobody acts. Two more Week 16 visits is the difference between a finding and a damaged endpoint, and it is computable from the visit schedule the moment the cause is known.
Protocol Deviation Management's site trends, with one action per alert
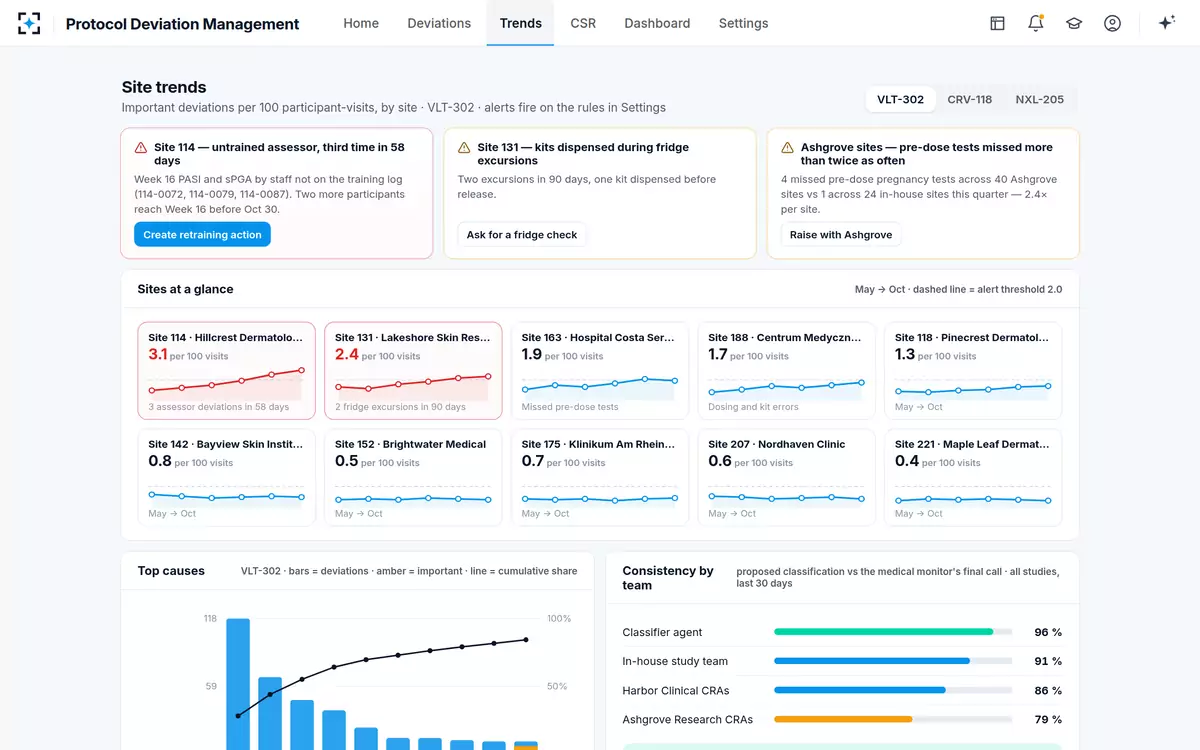
Site 114 — untrained assessor, third time in 58 days.
What makes a trending rule worth having
- It names one action and one person
Retrain this site; check this freezer; ask this organisation about pre-dose tests. An alert addressed to a distribution list is addressed to nobody.
- It has a minimum denominator
Without a floor, every newly opened site generates an alert in its first month and the team learns to ignore the channel.
- It states the forward risk, not just the past rate
How many participants reach the affected visit in the next month is the number that decides whether this is urgent.
- It is computed from confirmed classifications
Otherwise the rate moves every time a classification is revised, and nobody can say what it was when the alert fired.
- It separates cause from site
Three different causes at one site is a management problem; one cause at ten sites is a protocol problem. The same threshold cannot tell you which you have.
- Its threshold and window are settings, with a history
A threshold quietly loosened after a difficult quarter is the kind of thing an inspector asks about, and the answer should be a dated change with a reason.
- Somebody closes it
An alert with no recorded outcome is a measurement of nothing. The question at the next review is what happened after the retraining, not how many alerts fired.
The part of a site's rate it cannot help, and the part it can
A fair reading of the Tufts regressions is that a lot of a site's deviation rate was decided before the site opened. More countries, more distinct procedures, more endpoints and more eligibility criteria all raise the odds of a high-deviation protocol, and no site investigator chose any of them. A site running a protocol with 40 eligibility criteria and a visit window measured in days will produce more deviations than the same staff running a simpler study, and punishing it for that is both unfair and uninformative.
What a site controls is narrower: who performs which assessment, whether the training log is current before a visit happens, whether the pharmacy dispenses the assigned kit, whether a pre-dose test is done before the dose. Those are the causes a rate should be decomposed into, and they are the causes where retraining actually changes the next month's number. The sample study's trend layer splits the rate by cause for exactly this reason — the useful statement is not "Site 114 is at 3.1" but "Site 114 is at 3.1 and all of it is one cause".
Central monitoring is the discipline that turns this into action, and FDA describes the signal plainly: "Sites with multiple issues detected through centralized monitoring, such as delays in assessments or missing assessments, may also provide an early signal that the sponsor should promptly determine whether there is a need for a site visit and corrective actions to minimize the likelihood of similar issues occurring during the remainder of the clinical investigation" (FDA, A Risk-Based Approach to Monitoring of Clinical Investigations: Questions and Answers, April 2023). Early signal, prompt determination, remainder of the investigation: three phrases that all point at the same thing, which is that a rate computed after database lock has no job to do.
The measures behind the rate, on Protocol Deviation Management's dashboard
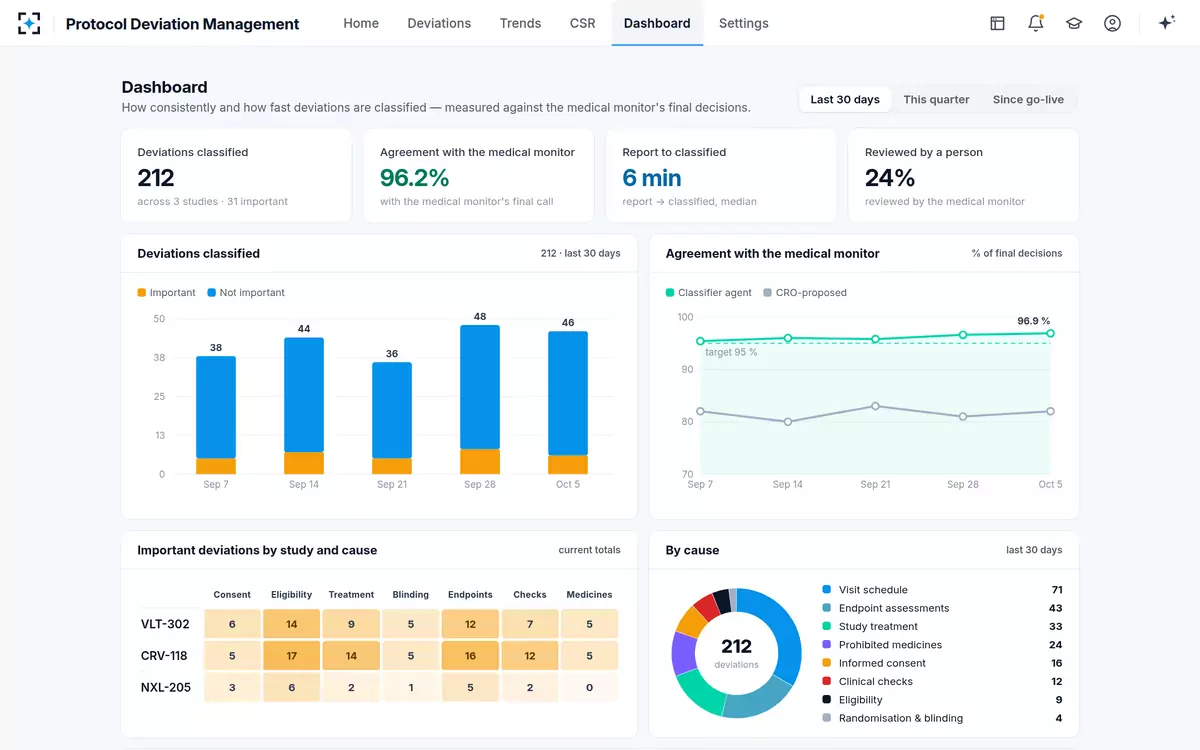
Rates are the second thing a study should build, not the first. Classification comes first, then the rate that rests on it, then the alert that rests on the rate. What a trial management system will and will not decide covers where the raw entries come from, and Protocol Deviation Management shows the nightly recalculation, the three rules and the alerts on one sample study.
Questions people ask
What is the average number of protocol deviations per trial?
In a published benchmark of 187 protocols from nearly two dozen companies, the mean was 8.7 total deviations for a Phase 1 protocol, 75.3 for Phase 2 and 118.5 for Phase 3, with about a third of participants affected in the later phases. The same paper reports coefficients of variation of 1.7 to 2.0 around those means, so the average describes the portfolio and not any individual study.
Does a high deviation rate mean a bad site?
Not by itself. A high rate can mean conscientious reporting, a hard protocol, a large site measured by count instead of by rate, or a genuine problem. What distinguishes them is the breakdown: one repeating cause concentrated in one site points at that site, while the same cause appearing across many sites points at the protocol or the training that preceded it.
Should a deviation rate use participants or visits as its denominator?
Visits, for site comparison on a live study. Participant-visits conducted is the measure of how much opportunity for deviation a site actually had, and it behaves when sites open at different times and enrol at different speeds. Per-participant rates are the better unit for a safety discussion, and per-protocol counts are only useful for portfolio benchmarking.
How long a window should a site rate be calculated over?
Long enough for the denominator to be meaningful and short enough to show a change. Cumulative rates since first participant in are nearly immovable by the third year, which is why a rolling window — 60 or 90 days — is usually paired with the cumulative figure. The sample study's repeat rule uses 60 days precisely because a cause recurring inside two months is a live problem rather than a history.
Can you compare deviation rates between two studies?
Only with care, and only after checking four things: whether both count important deviations or all of them, whether both use the same denominator, whether both classify against comparable criteria, and whether the designs are similar in the variables that predict deviations — countries, distinct procedures, endpoints and eligibility criteria. Studies that differ on any of those are not comparable on this measure.
Is a quality tolerance limit the same as a deviation rate threshold?
No. A quality tolerance limit is set at trial level on a critical-to-quality factor before the study starts, and exceeding it obliges the sponsor to evaluate whether there is a systemic issue and to report the breach and its remedial actions in the clinical trial report. A site trending threshold is an internal management instrument with no reporting consequence, tuned to the study's own distribution and changed as that distribution becomes clearer.