A portfolio cost analysis, as a wealth firm runs it for a prospect, is the annual dollar cost of everything the prospect holds away from the firm, built in four layers: each fund's operating expenses for the share class actually held, weighted by the dollars in it; the advisory or wrap fee as the other firm's agreement bills it; account-level charges such as custody and IRA fees; and the one-time costs of leaving. The total, divided by the portfolio's value, is the all-in rate the recommendation is compared against. It is hard because the inputs sit on other custodians' statements, in their formats and sometimes their languages, and because Reg BI and the advisers' fiduciary duty expect cost to be considered for every recommendation, with the alternatives the firm could have offered. Botminds' Investment Proposal Generator reads those statements, prices each holding from its own prospectus and keeps every figure cited, so the analysis reaches the principal with its evidence attached.
The examples come from the solution's sample data on fictional people: a prospect with $2,371,640 across a wrap account at another broker, a rollover IRA and a late spouse's account at a Swiss private bank.
One prospect's portfolio cost analysis, in four numbers
$36,776
all-in annual cost today, across three held-away accounts
1.55%
all-in rate on $2,371,640, against 0.88% for fund expenses alone
16
cited sources behind the total: 13 fee tables and 3 account-level fees
5
reasonably available alternatives priced on the same basis
What does a portfolio cost analysis have to include?
It has to include every cost the prospect bears, direct and indirect, not only the fund expense ratios a data feed returns. SEC staff put it plainly in their bulletin on care obligations: "the firm and financial professional should consider the total potential costs when evaluating whether the recommendation or advice is in a retail investor's best interest, including direct and indirect costs that could be borne by the retail investor" (SEC staff bulletin on care obligations).
The same bulletin lists what that means: "commissions, markups or markdowns, and other transaction costs; sales loads or charges; advisory or management fees; other fees or expenses that may affect a retail investor's return (such as Rule 12b-1 fees, other administrative and service fees, revenue sharing, and transfer agent fees)", along with the costs of exiting, tax considerations and "the likely impacts of those costs over the retail investor's expected time horizon". Then the sentence that sets the scope of the work: an analysis of costs "should include costs beyond the explicit costs disclosed on a trade confirmation or account statement."
That rules out the shortcut most proposal tools take, which is to multiply a fund-level expense ratio by a position and stop. In the sample, fund expenses alone come to 0.88% of the portfolio. The all-in figure is 1.55%. The difference, $15,906 a year, is the part of the cost a fund-only analysis never shows the principal.
The four layers of an all-in cost, priced in dollars first
The all-in cost is the sum of four layers, each computed in dollars before any percentage is taken. Working in dollars prevents the commonest error in a portfolio cost analysis: averaging rates that apply to different amounts of money, or applying an account-level rate to assets it does not cover.
All-in annual cost = four layers, each in dollars
Fund expenses
Σ (value in fund × total annual operating expenses)
For the share class on the statement, from the fund's own prospectus fee table.
Prospectus, Form N-1A Item 3
Advice
Advisory or wrap rate × billable value
Only the accounts and assets the agreement covers, on the valuation it specifies.
Agreement, Form ADV Part 2A
Account
Custody + IRA + maintenance charges
Charged by the custodian or bank, outside both the funds and the advice fee.
Statement and fee schedule
Exit and one-off
Deferred sales charges + surrender charges + trading + tax
Shown in their own line: they fall in the year of change, not every year.
Prospectus, contract, cost basis
Each layer has its own authority. Fund expenses come from the prospectus, where Form N-1A requires a fee table that the SEC introduces in fixed words: it "describes the fees and expenses that you may pay if you buy, hold, and sell shares of the Fund" and warns that other fees, such as brokerage commissions and fees to intermediaries, "are not reflected in the tables and examples below" (Form N-1A, Item 3). The fee table itself tells the analyst that it is one layer of four.
Fund expenses: the share class on the statement, weighted by dollars
Fund expenses are priced holding by holding: the total annual operating expenses for the class the prospect owns, multiplied by the dollars in that fund. Two details decide whether the figure is right, and both fail quietly.
Fund expenses for one sample prospect, priced from each fund's own fee table
| Holding (class) | Value | Total annual operating expenses | Annual cost |
|---|---|---|---|
| Harborline Large Cap Growth Fund (A) | $198,400 | 0.98% | $1,944 |
| Northgate US Core Equity Fund (A) | $176,900 | 1.04% | $1,840 |
| Harborline Dividend & Income Fund (A) | $142,600 | 0.91% | $1,298 |
| Sterling Peak Large Cap Value Fund (Investor) | $118,300 | 0.86% | $1,017 |
| Harborline Short Duration Income Fund (A) | $165,030 | 0.78% | $1,287 |
| Brightwater Blue Chip Equity Fund (I) | $204,300 | 0.72% | $1,471 |
| Cobalt Ridge 500 Index Fund (Investor) | $151,800 | 0.14% | $213 |
| Ardent Focused Growth Fund (C) | about $212,600 | 1.79% | $3,805 |
| Five other funds, three at the Zürich bank | — | — | $7,995 |
| All 13 funds | 0.88% of the whole portfolio | $20,870 |
The first detail is the class. The Ardent fund's C class costs 1.79% a year; its A class costs 1.04%. Priced from a generic fund-level figure, that one position is misstated by $1,594 a year, and in this sample the C shares had already passed the date on which they could have converted. That finding belongs in the analysis as a cost and as an alternative, and is worked through in when C shares convert to A shares.
The second is the weight. A simple average of the eight named funds' rates is 0.90%; the dollar-weighted figure for all thirteen is 0.88%. The two are close here by coincidence. In a portfolio with a large cheap index position and several small expensive ones, an unweighted average overstates the cost; with the weights reversed, it understates it. A principal who sees a single "average expense ratio" cannot tell which happened.
The research on retail investors explains why the firm, not the client, has to do this work. In a laboratory study where participants allocated money among four S&P 500 index funds, "subjects overwhelmingly fail to minimize fees", even with fees made transparent (Choi, Laibson and Madrian, Review of Financial Studies, 2010). And in the market, a study of retail S&P 500 index funds found "fund proliferation and price dispersion also exist in this sector, despite the funds' financial homogeneity" (Hortaçsu and Syverson, NBER working paper 9728). Funds that own the same stocks charge different prices, so a prospect's portfolio often carries a cost that only a fund-by-fund comparison will show.
The advisory or wrap fee, as the other firm's agreement bills it
The prospect's current advisory fee is calculated from the agreement and the statement, not from a headline rate: which accounts it covers, which assets are excluded, what valuation it uses, how often it is billed and whether in advance or in arrears. In the sample, a 1.25% wrap fee applies to one account of three, so it is $13,104 a year, not 1.25% of the whole portfolio.
This is the layer where SEC examiners have found the most errors on the billing side, which makes it the layer a cost analysis should treat most carefully on the comparison side. After reviewing deficiency letters from "over 1,500 adviser examinations completed during the past two years", the examinations office reported advisers that valued accounts "using the market value of the account's assets at the end of the billing cycle, instead of using the average daily balance of that account over the entire billing cycle as specified in the advisory agreement", and that included assets "excluded by the advisory agreement from the management fee, such as cash or cash equivalents, alternative investments, or variable annuities" (SEC risk alert, April 12, 2018).
The topic has not left the examiners' list. The Division of Examinations' priorities for fiscal 2027 say its reviews of advisers' conflicts will cover areas "such as fee rebates, fee and expense calculations, cash management, quid pro quo arrangements, deposits, and withdrawals" (SEC, Fiscal Year 2027 Examination Priorities). For a proposal, the discipline is symmetry: the prospect's current fee from their agreement and statement, and the proposed fee from the firm's own schedule, both computed on the same valuation basis, with the firm's household breakpoints applied as the agreement will apply them, a point covered in breakpoints in mutual funds.
Account charges that live only on held-away statements
Account-level charges appear on statements rather than in any fee table or agreement summary, so the only way to find them is to read every page of every statement. Custody, safekeeping, IRA maintenance, account maintenance, transfer and inactivity fees each convert to an annual amount and go in the third layer.
The sample shows why every page matters. The Swiss private bank's statement, in German, carried on page 5 a "Depotgebühr", a custody fee of 0.35% a year on the average account value, charged twice a year, with an annual amount of CHF 1,450.42. Converted at the September 30 closing rate of 1.2480 dollars per franc, that is $1,810 a year the funds' expense ratios never mention. A handwritten "p.a." beside the figure was read at 91% confidence, below the solution's 95% threshold, so it waited for an associate to confirm: whether the fee was per year or per half-year doubled or halved it.
Investment Proposal Generator reads a custody fee on page 5 of a German statement
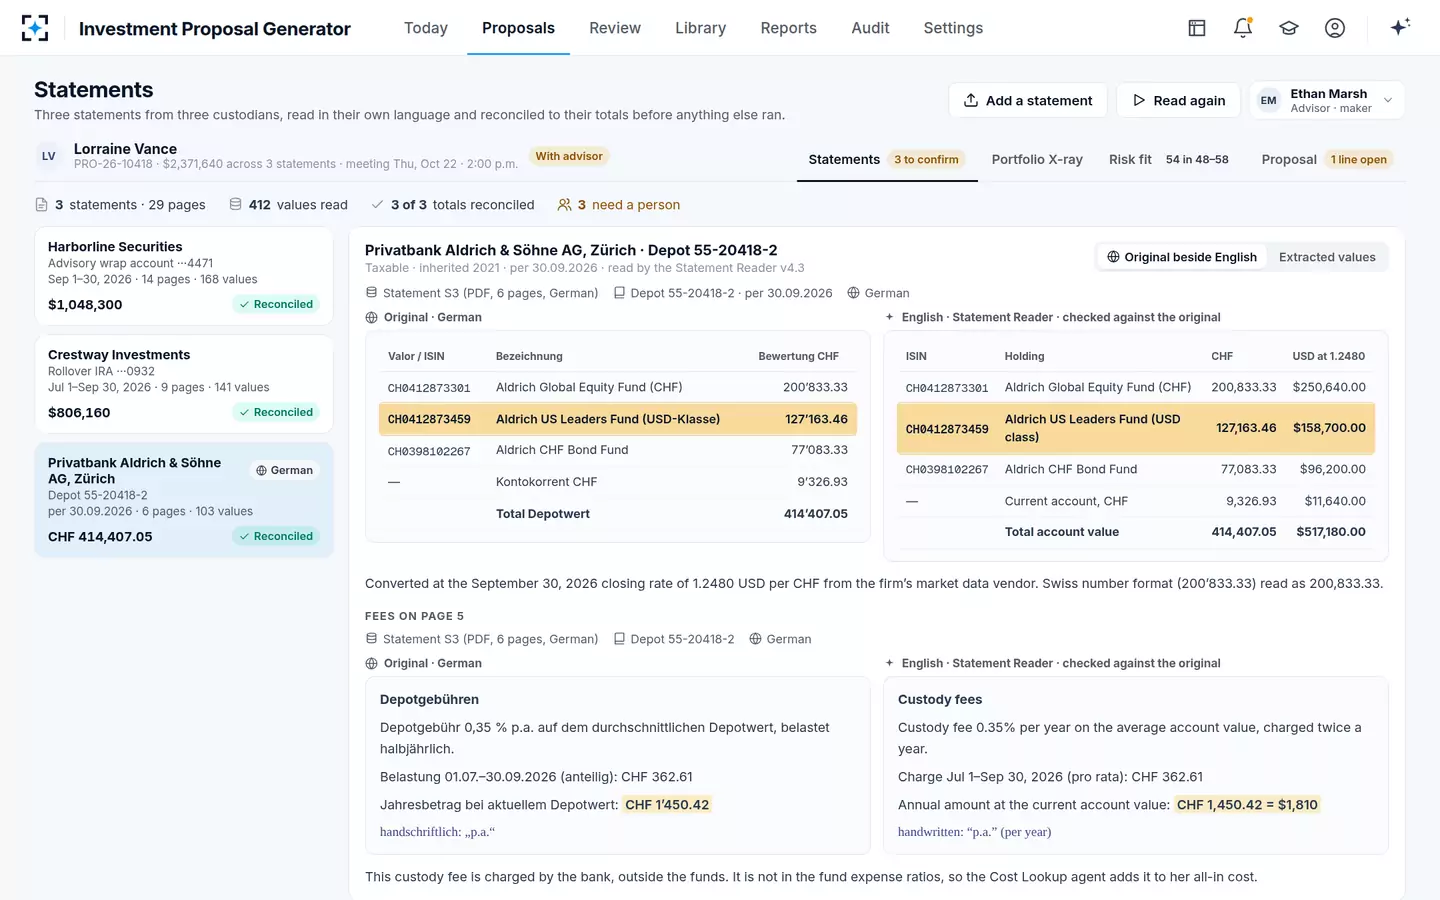
Reconciliation comes before pricing for a reason. A missed page or a misread unit count changes the dollars every rate is applied to, and the error then propagates through all four layers. In the sample, all three statements had to tie to their printed totals before the cost layers ran; a value read twice from a skewed photograph of page 7 waited for a person at 93%.
Exit costs: what leaving the current accounts would cost
Exit costs belong in a portfolio cost analysis because the recommendation usually implies selling or moving something, and the staff bulletin names them: "the costs of exiting an investment or investment strategy (such as deferred sales charges or liquidation costs); any relevant tax considerations". They are reported in their own line, because they fall once and would distort an annual rate.
The usual items are deferred sales charges still running on recent purchases, surrender charges on annuities, transaction costs and the tax on gains realised by selling. Each is estimated per lot from purchase dates, cost basis and the product's own schedule. In the sample, one stock position had no cost basis on its statement at all, so the solution drafted a request for the advisor to send rather than assuming one, and two Swiss equity funds that were likely passive foreign investment companies for a US person were handed to the firm's tax desk instead of being planned for sale.
FINRA's examiners describe the failure this layer prevents. Among the Reg BI findings in its 2026 oversight report: recommending that customers "replace or switch existing products or accounts" without "understanding or considering associated risks and costs, including as applicable, the imposition of penalties (e.g., surrender charges) and new surrender periods, loss of existing benefits, tax consequences and transaction costs" (FINRA, 2026 Annual Regulatory Oversight Report).
Why does Reg BI turn cost analysis into a supervision question?
Because cost must be considered on every recommendation, and the firm has to be able to show that it was. The SEC staff answer their own question directly: "Are costs always a relevant factor to consider when recommending or providing advice on investments or investment strategies? Yes." They add that cost "should not be the only consideration", and that a firm "cannot satisfy its obligations simply by recommending the lowest cost option" (SEC staff bulletin on care obligations).
On documentation the bulletin is careful but pointed. There is no requirement to document the evaluation of reasonably available alternatives, "in the staff's view, it may be difficult for a firm to demonstrate compliance with its obligations to retail investors, or periodically assess the adequacy and effectiveness of its written policies and procedures, without documenting the basis for certain recommendations." It adds that such documentation "can be particularly important where a recommendation may seem inconsistent with a retail investor's investment objectives on its face and/or poses conflicts of interest for the firm or the financial professional." A rollover into a fee-based account is the textbook case.
FINRA's findings show where supervision breaks. Firms were cited for "failing to consider or compare relevant costs and fees, such as product or account-level fees, when recommending a product or when determining whether to recommend that a customer purchase a security in either the customer's brokerage or advisory account", and for procedures "requiring documentation of rationale, but not following up on generic or insufficient rationales" (FINRA, 2026 Annual Regulatory Oversight Report). The cost analysis is what turns a rationale from generic into specific: it names the dollars.
Today against five alternatives: the comparison a principal reviews
The useful output of a portfolio cost analysis is not one number but a table: the prospect's current cost, the recommendation, and each reasonably available alternative priced on the same basis, with the reason each cheaper option was not chosen. The table is what a supervising principal reads.
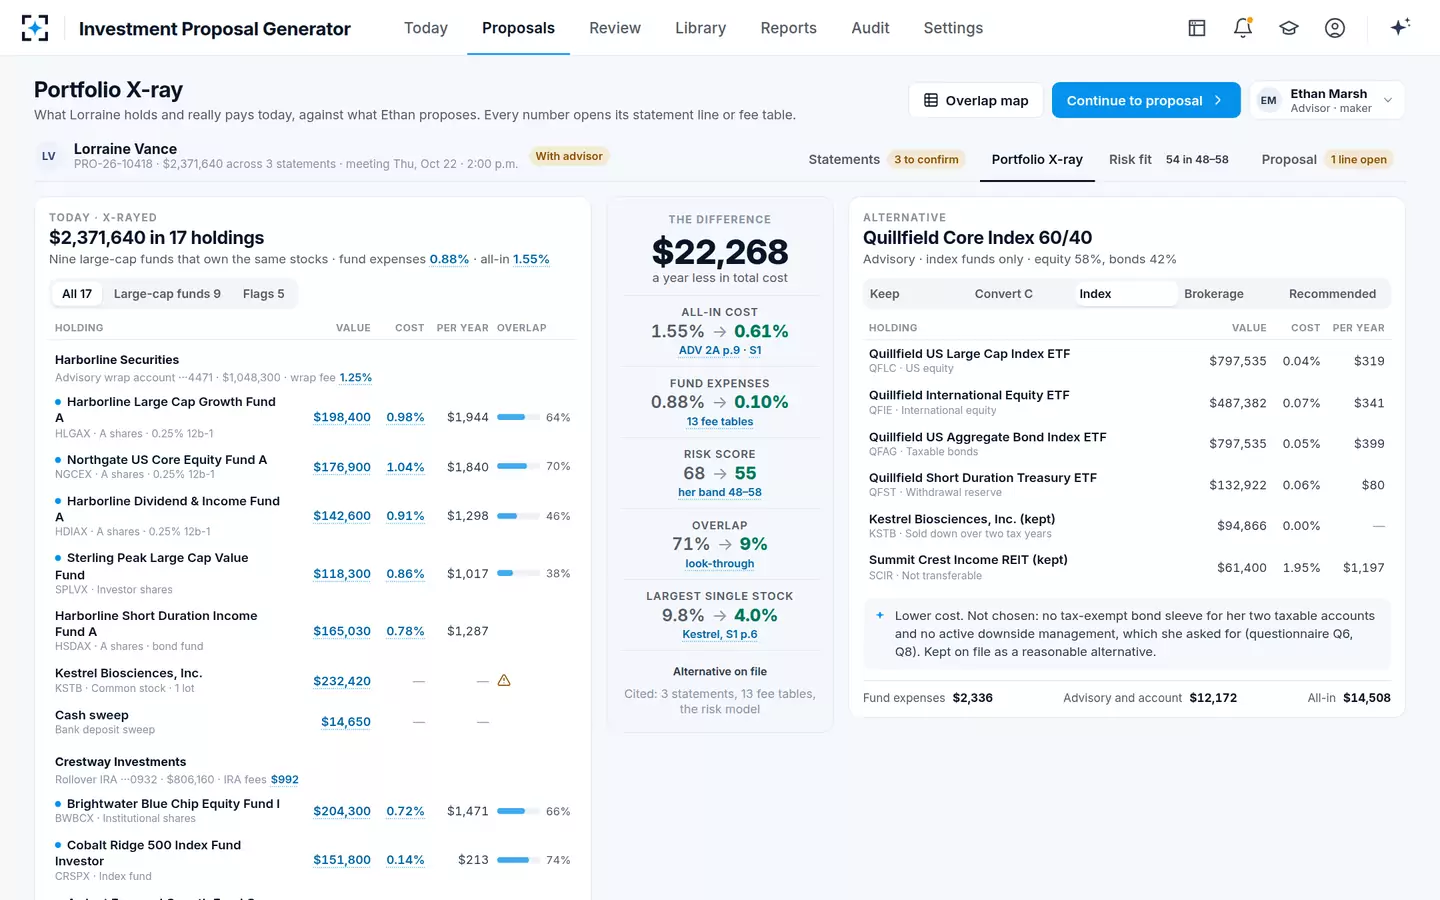
Investment Proposal Generator prices five alternatives on the same cited numbers
| Option | Annual cost | All-in rate | Risk score (band 48–58) | Why chosen or not |
|---|---|---|---|---|
| Keep as is | $36,776 | 1.55% | 68 | Above the risk band; overlapping large-cap funds; wrap fee on one account |
| Keep and convert the C shares | $35,182 | 1.48% | — | The cheapest change available: a signature, no sale |
| Core index 60/40 portfolio | $14,508 | 0.61% | 55 | Cheaper; no tax-exempt bond sleeve for the taxable accounts and no active downside management, which the prospect asked for |
| Brokerage account, same funds | $10,874 | 0.46% | — | Cheaper; its written reason is kept for the principal |
| Recommended balanced growth account | $21,896 | 0.92% | 54 | Inside the band; $14,880 a year below today |
What makes the table defensible is what it keeps. The conversion row prices a fix the prospect could make without changing firms, which is the fair baseline for any move. The index and brokerage rows undercut the recommendation by $7,388 and $11,022 a year, and both stay on the page. A reviewer may weigh the reasons differently, but nothing cheaper is missing, and the index alternative's reason cites the prospect's own questionnaire answers, questions 6 and 8, rather than a stock phrase.
Reasonably available alternatives, each with its reason, kept for the principal
Where portfolio cost analyses go wrong, and the control for each
Most errors in a prospect's cost analysis fall into a small number of patterns, and each has a check that catches it before the principal does. The list below combines the SEC's billing findings with the failure points of reading another firm's statements.
Eight failure points in a portfolio cost analysis, and the check for each
- Wrong share class
Price the class printed on the statement; never infer one. A C share priced as an A share understates the cost.
- Unweighted averages
Weight each fund's rate by the dollars held, then add the other layers.
- Stale prospectus
Use the latest filed fee table; refresh when a newer one is filed.
- Advisory fee on the wrong base
Apply the rate only to the accounts and assets the agreement covers, on its valuation method.
- Missed account charges
Read every statement page for custody, IRA, maintenance and transfer fees.
- Unreconciled holdings
Tie each statement's positions to its printed total before pricing anything.
- Exit costs blended into the annual rate
Report deferred charges, surrender charges and tax in their own line.
- Asymmetric comparison
Price the proposed account with the same method, breakpoints and valuation as the current one.
How does a firm know a cost figure will survive review?
A cost figure survives review when every dollar in it traces to a page someone can open, from a current source, for the exact class or account it describes, applied to holdings that reconcile to the custodian's total. Each of those conditions can be measured, which turns "accurate" from an impression into four numbers a compliance team can track.
Four measures of a portfolio cost analysis a principal can rely on
| Measure | How it is computed | The error it catches | Sample prospect |
|---|---|---|---|
| Dollars traced | Share of the annual cost whose source page opens | An estimate presented as a fact | All $36,776 cited to a statement line or prospectus page |
| Class matched | Share of fund dollars priced from the exact class held | A C share priced as an A share | Every fund priced by class; none inferred |
| Sources current | Share of fee tables from the latest filed prospectus | A fee that changed at the last update | Latest filing used; a newer one triggers a refresh |
| Holdings reconciled | Share of statements whose positions equal the printed total | A missed page or misread unit count | 3 of 3 statements reconciled |
A proposal that scores fully on all four can still contain a judgement the principal disagrees with. It cannot contain a fee nobody can find, which is the defect an examiner is looking for when a rationale reads as generic.
Who does what in Investment Proposal Generator's portfolio cost analysis
The agents do the reading and the arithmetic; people keep every judgement and both signatures. The division is deliberate: the expensive hours in a proposal are spent retyping positions and looking up fees one fund at a time, and the solution's own estimate for one prospect with three statements puts those two tasks at about two hours by hand.
From held-away statements to a reviewed cost comparison
Agent
Statement ReaderReads each statement in its own language, extracts positions, classes, cost basis and fees, and reconciles each to its total.
Never: Never uses a value under 95% confidence
A person decides
Client service associateConfirms the values held for a person: a skewed page, a handwritten note, a missing cost basis.
Agent
Cost LookupPrices each holding from its own prospectus for the exact class and adds wrap, custody and IRA fees for the all-in cost.
Never: Never infers a share class it cannot see
Agent
Proposal WriterBuilds the cost-and-alternatives table from the same cited numbers, with a written reason for each cheaper option.
A person decides
AdvisorDecides the recommendation, edits the reasons and approves as maker.
A person decides
Registered principalReviews the evidence and approves, returns or rejects with a reason before the prospect sees a page.
Three limits matter. The solution does not give tax advice, so a lot whose sale it cannot assess goes to the firm's tax desk; it does not decide which alternatives the firm considers reasonably available, which is a policy the firm sets; and it cannot price a cost that appears in no document, such as an undisclosed revenue-sharing arrangement at the other firm. How the finished analysis reads inside a proposal is shown in an investment proposal example, line by line.
Questions people ask
What is a portfolio cost analysis in wealth management?
It is the annual cost of a client's or prospect's holdings across all accounts, built from fund expenses, advisory or wrap fees, account charges and exit costs, and compared with the firm's recommendation and its alternatives. In the sample here, the all-in cost is $36,776 a year, 1.55% of $2,371,640.
Does Reg BI require a cost comparison for every recommendation?
Reg BI's care obligation requires cost to be considered for every recommendation; SEC staff say firms "must always consider cost as a factor". There is no rule requiring the comparison to be documented, but staff say it may be difficult to demonstrate compliance without documenting the basis for certain recommendations, including the alternatives considered.
How are held-away account fees found if they are not in a fund's expense ratio?
By reading every page of the statement. Custody, IRA maintenance and transfer fees are charged by the custodian or bank and appear only there. In the sample, a Swiss bank's 0.35% custody fee, $1,810 a year, sat on page 5 of a German statement.
Should exit costs be included in the all-in rate?
They should be reported, but in their own line. Deferred sales charges, surrender charges and tax on realised gains fall once, in the year of change, and blending them into an annual rate makes the current portfolio look more or less expensive than it is in every later year.
What fee errors do SEC examiners find most often?
Billing on the wrong valuation, billing in advance or too often, applying the wrong rate, and missing household discounts and breakpoints, according to the examinations office's 2018 risk alert drawn from over 1,500 adviser examinations. Fee and expense calculations remain on the Division of Examinations' list for fiscal 2027.
How long does a portfolio cost analysis take by hand?
For one prospect with three statements, the solution's own estimate is about 1.25 hours retyping positions and 0.75 hours looking up fund, wrap, custody and IRA fees, before any comparison is written. With the agents doing the reading, the same estimate puts those two tasks at under ten minutes, with people confirming the values that need them.