Fund overlap analysis, the job a mutual fund overlap tool does for an advisor, measures how much of two funds' money is invested in the same securities. The standard calculation takes every stock both funds hold, keeps the smaller of the two portfolio weights for each, and adds them up: two funds that each hold 5% in the same company contribute 5 points of overlap, while a fund with 8% and another with 1% contribute only 1. The answer runs from 0% (nothing in common) to 100% (identical portfolios), and it matters in a proposal because a prospect who owns six large-cap funds may own one large-cap portfolio six times, paying six sets of fees for it. Two things decide whether the number can be trusted: which weights the tool used, and how old the holdings were. Botminds' Investment Proposal Generator looks through every fund a prospect holds, dates every figure, and puts overlap beside cost, so the advisor can see what the duplication is costing.
Why a mutual fund overlap figure is always a few months old
1of 3
months of each quarter for which mutual fund holdings filed with the SEC are made public
60days
after the quarter ends before those holdings are due and published
5months
how stale the SEC says quarterly-filed holdings data can be
Daily
portfolio holdings disclosure for ETFs that operate under Rule 6c-11
What does a mutual fund overlap tool measure?
A mutual fund overlap tool measures shared holdings between funds, but tools use at least three different definitions, and they give very different answers for the same pair. Before trusting a figure, find out which one the tool reports.
The first counts names: the share of one fund's holdings that also appear in the other, regardless of size. The second asks how much of one fund's money sits in stocks the other also owns. The third, and the one this guide treats as the standard, adds the smaller weight of each common holding, which answers the useful question: how much of the two portfolios is genuinely the same money in the same companies. The illustration below shows two ten-stock funds that share four names, and the three answers a tool could print.
Same two funds, three different 'overlap' figures
The difference is not academic. A count-based tool would tell this prospect that 40% of Fund X is duplicated in Fund Y; a tool that reports Fund X's exposure to shared names would say 48%. In fact the two portfolios have only 10% in common, because Fund Y barely owns the stocks Fund X loves. Swap the weights and the conclusion reverses. A tool that does not say which definition it uses cannot be compared with any other.
How is fund overlap calculated? The sum of the smaller weights
Fund overlap is calculated by listing every security held by both funds, taking the lower of the two portfolio weights for each, and adding those minimums. Securities held by only one fund contribute nothing. The table works through the illustration.
Weight overlap between two fictional funds, holding by holding
| Holding | Weight in Fund X | Weight in Fund Y | Smaller weight (counts toward overlap) |
|---|---|---|---|
| Stock A | 15% | 3% | 3% |
| Stock B | 12% | 2% | 2% |
| Stock C | 11% | 2% | 2% |
| Stock D | 10% | 3% | 3% |
| Six stocks held only by Fund X | 52% | — | 0% |
| Six stocks held only by Fund Y | — | 90% | 0% |
| Total | 100% | 100% | Overlap = 10% |
The same quantity has a second form that is useful for checking a tool. Because each fund's weights add to 100%, the sum of the smaller weights equals 100% minus half the sum of the absolute differences between the two funds' weights. That second form is the one fund researchers know: Cremers and Petajisto's "Active Share", which they describe as "the share of portfolio holdings that differ from the benchmark index holdings" (Review of Financial Studies, 2009), is computed from the same absolute differences. A fund's overlap with its benchmark index is therefore one minus its active share. Any overlap tool's pairwise figure can be re-derived either way from the two holdings lists.
Two ways to write weight overlap, and why they agree
Overlap
Σ min(wX, wY)
For every security held by both funds, the smaller of the two weights, added up.
The standard pairwise figure
Same thing
1 − ½ Σ |wX − wY|
Over every security either fund holds; equal to the first form because each fund's weights sum to 100%.
Use it to check a tool
Against an index
Overlap = 1 − Active Share
With Y as the benchmark, the half-sum of differences is the fund's active share.
Cremers & Petajisto (2009)
Pairwise overlap is not the whole portfolio: look-through concentration
Pairwise overlap answers "are these two funds alike?"; a proposal needs a second answer: "how much of this prospect's money is in each company, through every fund at once?" That is look-through exposure. For each stock it adds the stock's weight in each fund multiplied by the fund's share of the portfolio, plus any shares held directly.
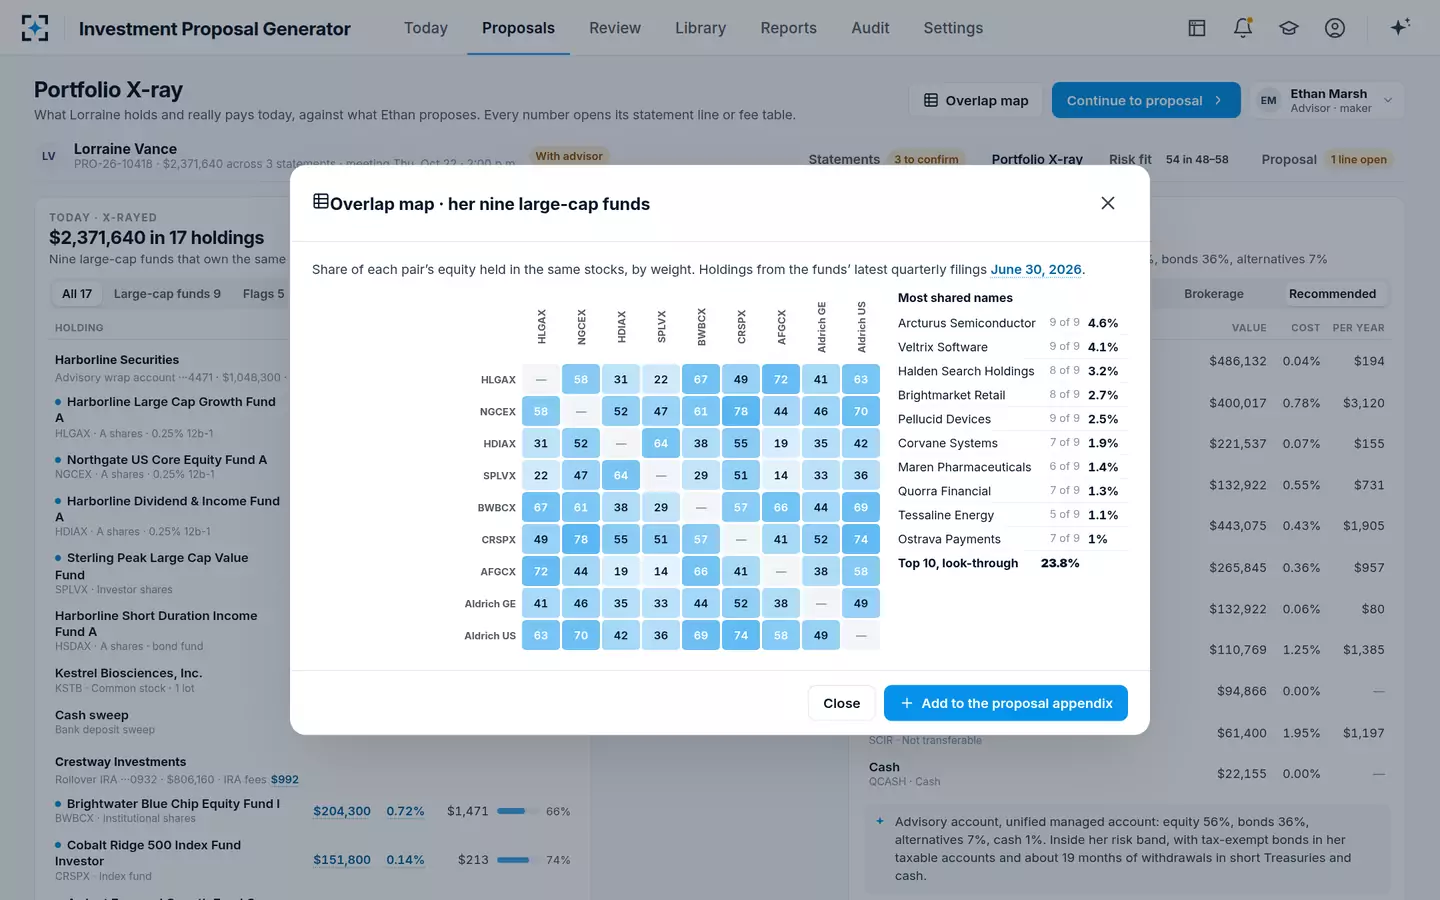
Look-through is where duplication becomes concentration. In the solution's sample data, on fictional people and funds, a prospect held nine large-cap funds alongside a single stock. Pairwise overlaps between the funds ran as high as 78%; one semiconductor company appeared in all nine funds, at 4.6% looked through; the ten most widely shared names made up 23.8% looked through; and the prospect's own stock position was 9.8% of everything she owned. No single statement showed any of that.
Investment Proposal Generator's overlap map: nine large-cap funds, pair by pair, and the names they share
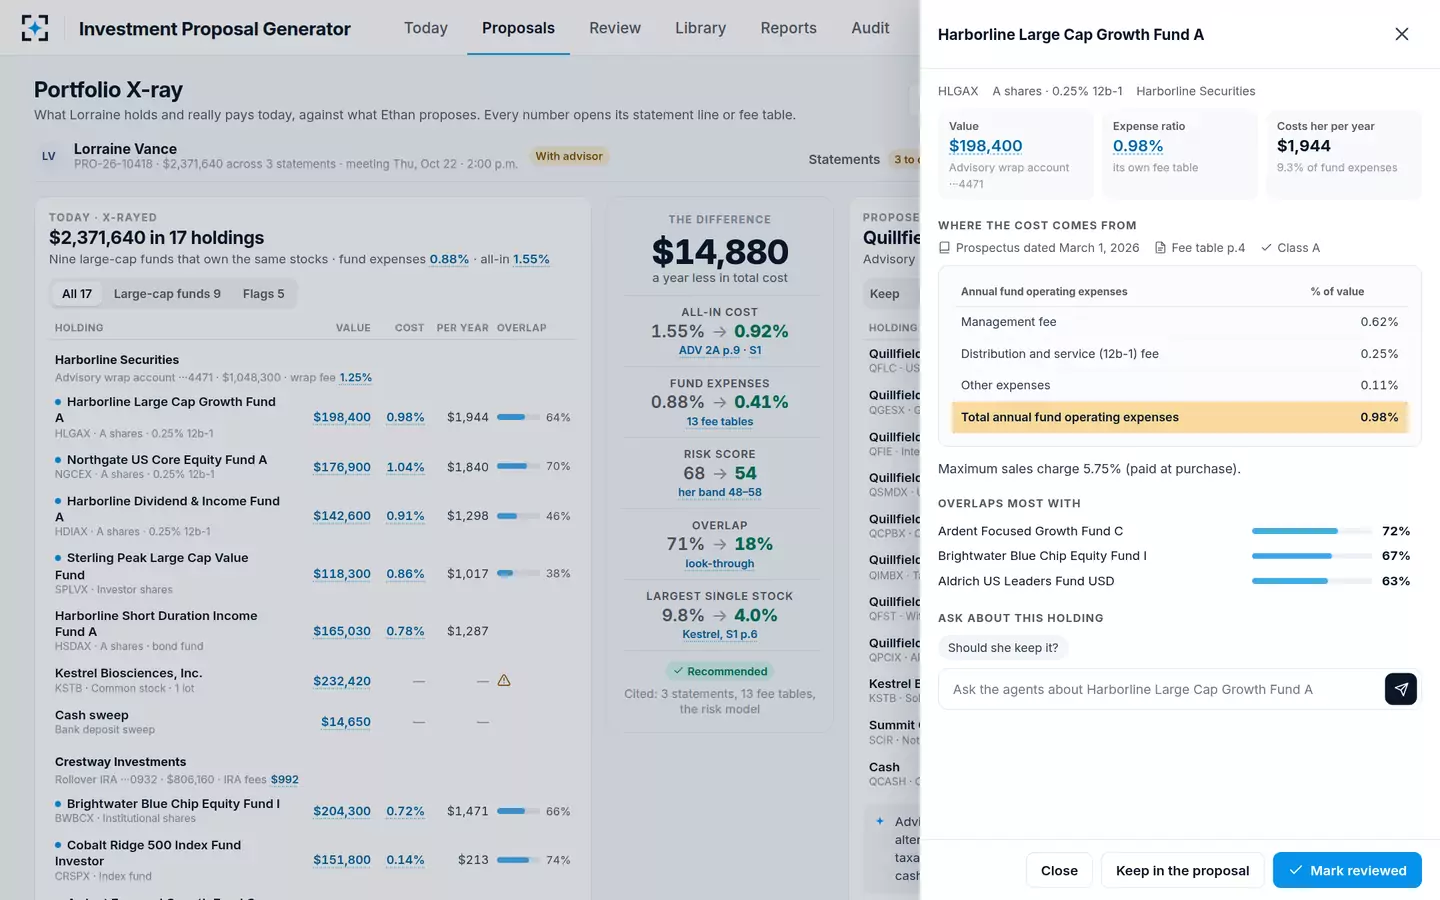
Investment Proposal Generator: one fund's overlap with the others, beside its own fee table
How current is fund holdings data? Why the date decides the answer
Under the current timetable, mutual fund holdings available to the public are typically between two and five months old, because funds file them with the SEC quarterly and only one month per quarter is published, 60 days after the quarter ends. An overlap figure is therefore a statement about the past, and the right question for a tool is not whether its holdings are current but whether it says how old they are.
The SEC set out the current position in a February 2026 proposal: it "receives reports on Form N-PORT on a quarterly basis, no later than 60 days after the end of a registered fund's fiscal quarter", while "investors have access to Form N-PORT portfolio data for only the third month of a fund's fiscal quarter" (SEC, Form N-PORT Reporting, proposed rule). The same document says that "the prior quarterly filing requirement resulted in information that is stale by up to five months." A 2024 rule to publish every month's holdings has had its effective date delayed to November 17, 2027 (SEC, April 2025), and the February 2026 proposal would instead restore quarterly publication. Until one of those settles, plan on quarterly data.
How old the holdings in a mutual fund overlap figure can be
- Month 1not published
- Month 2not published
- Month 3published
- Up to 60 days to file and publish≤ 60 days
- Next quarter runs3 months in use
Exchange-traded funds are different, and this is why an ETF overlap tool can be more current than a mutual fund one. An ETF that operates under the SEC's ETF rule must, each business day, disclose on its website "for each portfolio holding that will form the basis of the next calculation of current net asset value per share" the identifier, quantity and "Percentage weight of the holding in the portfolio" (17 CFR 270.6c-11(c)(1)). A portfolio that mixes mutual funds and ETFs will therefore be looked through on mixed dates, and a good tool shows each fund's date rather than one date for all.
Does fund overlap matter?
Fund overlap matters when it creates concentration nobody chose or costs nobody needs to pay. Owning several funds is not the same as being diversified, and research on retirement savers shows how easily people confuse the two. Benartzi and Thaler found that some investors "divide their contributions evenly across the funds offered in the plan", and that "the proportion invested in stocks depends strongly on the proportion of stock funds in the plan" (American Economic Review, 2001). The number of funds, not a decision about risk, set the allocation.
In a proposal, overlap matters in three concrete ways. It hides single-company concentration that only look-through reveals. It can mean paying active-management fees several times over for holdings that resemble an index — the higher the overlap between an expensive active fund and a cheap index fund, the more of the active fee buys what the index fund already holds. And it inflates the apparent number of positions, which can make a portfolio look more diversified to the prospect than it is. In the sample, the recommended portfolio reduced overlap from 71% to 18% and the largest single stock from 9.8% to 4.0%, alongside a lower all-in cost; how that cost is built up is in portfolio cost analysis for a prospect's held-away accounts.
What overlap is too much?
No regulation sets a maximum overlap between funds an investor owns, and no regulator or independent study publishes a threshold that applies to individual portfolios. The limit is a matter of firm policy, and it is better written for the outcome than for the overlap figure itself.
Two policy lines do the work. The first is a look-through single-company limit: in the sample, the firm's setting caps any one stock at 5% of the portfolio after the transition, which is why the prospect's 9.8% position is sold down over two tax years rather than all at once. The second is a cost test: where two funds overlap heavily and one is materially more expensive, the proposal should say what the overlap costs in dollars and why the expensive fund stays, if it does. A pairwise overlap figure is a prompt to look; the look-through exposure and the dollar cost are what a client and a principal can act on.
ETF overlap, portfolio overlap checkers and the wrinkles they miss
The arithmetic is the same for ETFs, separately managed accounts and model portfolios, but several wrinkles change the answer. Each is worth testing on any portfolio overlap checker before trusting it in a proposal.
Where overlap tools commonly differ, and what to check
| Wrinkle | Why it changes the answer | What to check |
|---|---|---|
| Share classes | Classes of one fund hold the same portfolio; counting them as two funds doubles the overlap. | The tool maps every class to its underlying portfolio. |
| Funds of funds and target-date funds | The overlap sits one level down, in the funds they hold. | How many levels the tool looks through. |
| Derivatives, cash and other non-equity holdings | Weights computed on equity only differ from weights on net assets. | Which denominator the tool uses, and that it is stated. |
| Different holdings dates | Mutual funds quarterly with a lag; many ETFs daily. | A date per fund, not one date for the whole map. |
| Foreign-domiciled funds | They may not file holdings with the SEC at all. | Where the holdings came from, or a flag that look-through was not possible. |
| Direct stock and bond positions | They add to look-through exposure but are often left out of fund-to-fund maps. | That direct holdings are included in single-company exposure. |
What to ask a mutual fund overlap tool before you rely on it
Ask any mutual fund overlap tool to show its definition, its dates and its denominators on a portfolio you know well. If the answers are not on the screen, the figure cannot go in a proposal a principal will sign.
Seven checks for a mutual fund overlap tool
- Which definition is reported?
Count of names, exposure to shared names, or the sum of the smaller weights. Only the last is symmetric between two funds.
- What date are the holdings, fund by fund?
Quarterly mutual fund data can be up to five months old; a date per fund is the minimum.
- What is the denominator?
Net assets, total equity or invested assets: the same holdings give different weights.
- Does it look through funds of funds?
Target-date and multi-asset funds hide their overlap one level down.
- Does it combine overlap with direct holdings?
Single-company exposure must include stock the client owns outright.
- Can you re-derive one pairwise figure by hand?
Take two funds' published holdings and add the smaller weights; the tool should match.
- Does it tie overlap to cost?
Overlap between an expensive active fund and a cheap index fund is a fee question, not just a risk one.
Overlap is one input among several in a proposal; how the overlap tool sits beside the rest of a prospect review — fees, account costs, share classes — is compared in a portfolio x-ray tool against reading the statements.
Questions people ask
Is a mutual fund overlap calculator accurate?
It is as accurate as its holdings data and its definition. With the same holdings date and the sum-of-smaller-weights definition, two calculators should agree to within rounding. Most disagreements come from different dates, different denominators or a count-based definition.
How much overlap between two funds is normal?
No regulator or independent study publishes a normal range for individual portfolios. Two funds tracking the same index will overlap almost completely; a large-cap growth fund and a large-cap value fund can overlap very little. Judge overlap against what each fund costs and what it is supposed to add.
Do index funds overlap with each other?
Two index funds tracking the same index hold essentially the same stocks at the same weights, so their overlap is close to 100%; holding both adds nothing but a second fee. Funds tracking different indexes overlap to the extent the indexes share constituents.
Does overlap include bonds?
It can, but bond overlap is usually measured at the issuer or sector level, because two funds rarely hold the same bond issue in the same size. For proposals, the equity overlap and look-through single-company exposure usually matter most.
Why does an overlap figure change when nothing in the portfolio changed?
Because the funds' holdings changed and a new quarter's data was published. The client's positions can be identical while the funds underneath have traded. A tool that prints the holdings date makes that visible.
Can an overlap tool see inside foreign funds?
Only if the funds publish their holdings somewhere the tool can read. Funds organised outside the US are generally not registered with the SEC and do not file Form N-PORT, so look-through depends on their own reports; a tool should flag that rather than leave the fund out of the map silently.