A credit rating model in Excel is a workbook that spreads an issuer's statements, computes the ratios a methodology scores, looks each one up against grade thresholds, weights them into a score and maps the score to an implied rating, with the analyst's notches added at the end. Most buy-side credit teams have one, and for a single issuer it works. The cost shows up elsewhere: the source page behind a number is lost when the analyst moves on, copies drift from the approved weights, the reason for a notch lives in an email, and when the SEC asks for the credit file behind every money market holding the team rebuilds it for weeks. Botminds' Internal Credit Rating keeps your methodology but replaces the file around it, with every value cited to its page and every decision signed by a named person. This guide shows how to measure whether that is worth it for your book.
Sample figures come from the solution's fictional data: Quillfield Capital's credit team, 912 issuers, and one annual review of Orrin Freight Lines. Hour estimates are Botminds' own and are labelled as such; nothing on this page is a customer's measured result.
Four measures of a governed rating process, on the sample book
How to build a credit rating model in Excel
Build it as a file someone else can audit, not just a calculator you can use. Seven tabs cover a corporate rating model, and the discipline is in three columns most templates leave out: where each input came from, which version of the methodology was applied, and who changed what.
A credit rating model Excel template, tab by tab
| Tab | What it holds | The control most workbooks skip |
|---|---|---|
| 1. Inputs | The spread: income statement, balance sheet, cash flow, debt schedule, adjustments for leases, pensions and one-off items. | A source column for every value: document, page, and who keyed it. |
| 2. Ratios | Leverage, coverage, margins, free cash flow to debt, liquidity sources against uses, computed only from tab 1. | No hard-coded numbers; every ratio a formula you can trace back. |
| 3. Thresholds | For each factor, the ratio range that places it in each rating band, by sector. | Locked, and stamped with the methodology version and approval date. |
| 4. Weights | The weight of each factor, summing to 100%. | Locked with the thresholds; a change means a new version, not an edit. |
| 5. Scorecard | Factor scores, the weighted score and the implied rating from a lookup. | The implied rating shown before any adjustment, never overwritten. |
| 6. Adjustments | Each notch: direction, size, reason and evidence, inside the methodology's limits. | A cap check (for example ±2 a notch, ±3 in total) that flags breaches. |
| 7. Output and log | Proposed rating, agency ratings and the gap, reviewer and committee decisions. | A change log: date, user, cell, old and new value, reason. |
A workbook built this way is a reasonable start for a small book. Its weakness is not the arithmetic, which Excel does perfectly, but everything around it: the file can be copied, the lock can be removed, the source column can be left blank, and the log is only as complete as the analyst's patience.
What is wrong with spreadsheet rating models?
Nothing is wrong with the formulas; the problem is what a spreadsheet cannot prove. The best-known spreadsheet failure in economics shows the pattern. Replicating an influential study from its authors' working spreadsheet, three researchers found data left out, coding errors and weighting choices that changed the headline: countries with public debt above 90% of GDP had grown by about 2.2% a year in real terms, not shrunk by 0.1% as published (Herndon, Ash and Pollin, Cambridge Journal of Economics, 2014; the debate is told in full in debt to GDP ratio by country). The error survived because no one outside the authors could see inside the file until they shared it.
Rating files fail the same way, in public. When the SEC's examiners reviewed more than 70 money market funds after the 2016 reforms, they reported that some funds' credit files left out factors the rule requires for a minimal credit risk determination, and that some did not adequately document how the files were kept up to date (SEC Risk Alert, November 7, 2019; the findings are quoted in Rule 2a-7: the minimal credit risk test in plain words). In 2025 the examiners of rating agencies found analytical files that "did not contain all applicable emails" and a rationale missing behind a qualitative assessment (SEC Office of Credit Ratings, 2025 Staff Report). Neither problem is about calculation. Both are about a file that cannot show its own history.
What is end user computing risk, and does it cover a rating workbook?
End user computing risk is the risk from tools that business users build and run outside IT's controls, spreadsheets above all. A rating workbook is a textbook case: it encodes credit judgment in weights and thresholds, it decides fund eligibility, and it is usually owned by one analyst. Banks govern such tools under end user computing policies; what end user computing controls look like in a bank's risk reporting is covered in the banking series.
The model risk framework will not necessarily catch it. The US banking agencies' revised model risk guidance of April 2026, SR 26-2, leaves simple spreadsheet arithmetic outside its definition of a model (SR 26-2 attachment, section II); whether spreading software counts as a model works through that definition. A lookup-and-weight rating workbook can fall on the arithmetic side of the line while the judgments inside it decide which bonds a fund may hold. Whatever framework applies, the controls that matter are the same: a version that cannot be edited in place, inputs that cite their source, and changes that need someone other than their author to approve.
How long does an annual credit review take?
For a high-yield corporate issuer, Botminds estimates about 26 analyst hours by hand, most of them spent spreading statements and writing up, and a little over 4 hours with the agents doing the reading and drafting. The estimate is built step by step from the six parts of a review in the solution's design, not measured at a customer. Investment-grade names with simpler statements take less; complex issuers with many subsidiaries take more.
Where the hours of one annual review go, by hand and with the agents
- Gather2 h
- Spread, tie out8 h
- Score, peers4 h
- Split reason3 h
- Challenge4 h
- Memo, file5 h
- Confirm and decide4.25 h
The hours that remain are the ones that should: confirming the values the agents read with low confidence, deciding the notch, answering the reviewer and approving the memo. The hours that go are re-keying and re-writing, which is also where most of the errors an examiner finds are made.
What KPIs should an internal rating process track?
Five measures cover cost, quality and readiness, and each can be counted from the files rather than estimated. Count them for one quarter before changing anything; they are the baseline any tool, including ours, should be judged against.
Five measures that price a credit rating process
| Measure | How to count it | Sample value | Target |
|---|---|---|---|
| Analyst hours per annual review | Time from opening the review to the signed rating, by step, on ten reviews. | ≈ 26 h by hand, ≈ 4.25 h with the agents (estimate) | Your own baseline, cut where the work is re-keying |
| Splits explained before committee | Ratings two or more notches from the agency median with an approved, cited reason on the day of the meeting. | 39 of 47 | All of them |
| Files complete when asked | Share of files carrying every required factor and a current review when a regulator asks. | 171 of 174 money market files | No file missing a required factor |
| Reviews late | Annual and event reviews past their due date, and by how long. | Set by your cycle: 12 months, events in 10 business days | None past due without an approved extension |
| Values traceable to a page | Of twenty spread values picked at random, how many open on their source. | 96 of 96 cited on the sample review | All of them |
The second and third measures are the ones that move an examiner. The SEC said in 2015 that ongoing monitoring means monitoring regularly and frequently (Release IC-31828, 80 FR 58124), and the 2019 exam findings show what happens when the file does not prove it.
Credit rating software vs Excel: what actually changes
The rating does not change; the evidence around it does. A governed file answers four questions a workbook cannot: where did this number come from, who changed it, which methodology version applied, and who challenged and approved the result.
The same rating, in a workbook and in a governed file
Excel rating model: A source column, if the analyst filled it in.
Internal Credit Rating: Every value opens on its page, with the confidence of the reading and who read it.
Excel rating model: Whatever weights are in this copy of the file.
Internal Credit Rating: Only an approved version; the version is stamped on the rating and cannot be edited in place.
Excel rating model: A cell comment or an email.
Internal Credit Rating: A reason code and a cited reason; a reason that cites nothing is refused.
Excel rating model: Minutes typed after the meeting.
Internal Credit Rating: Analyst, reviewer and chair, three different people, each with a reason code, in an append-only trail.
Excel rating model: Weeks of rebuilding files from folders and email.
Internal Credit Rating: Mapped to the files and checked against the rule, gaps first, for the chief compliance officer to approve.
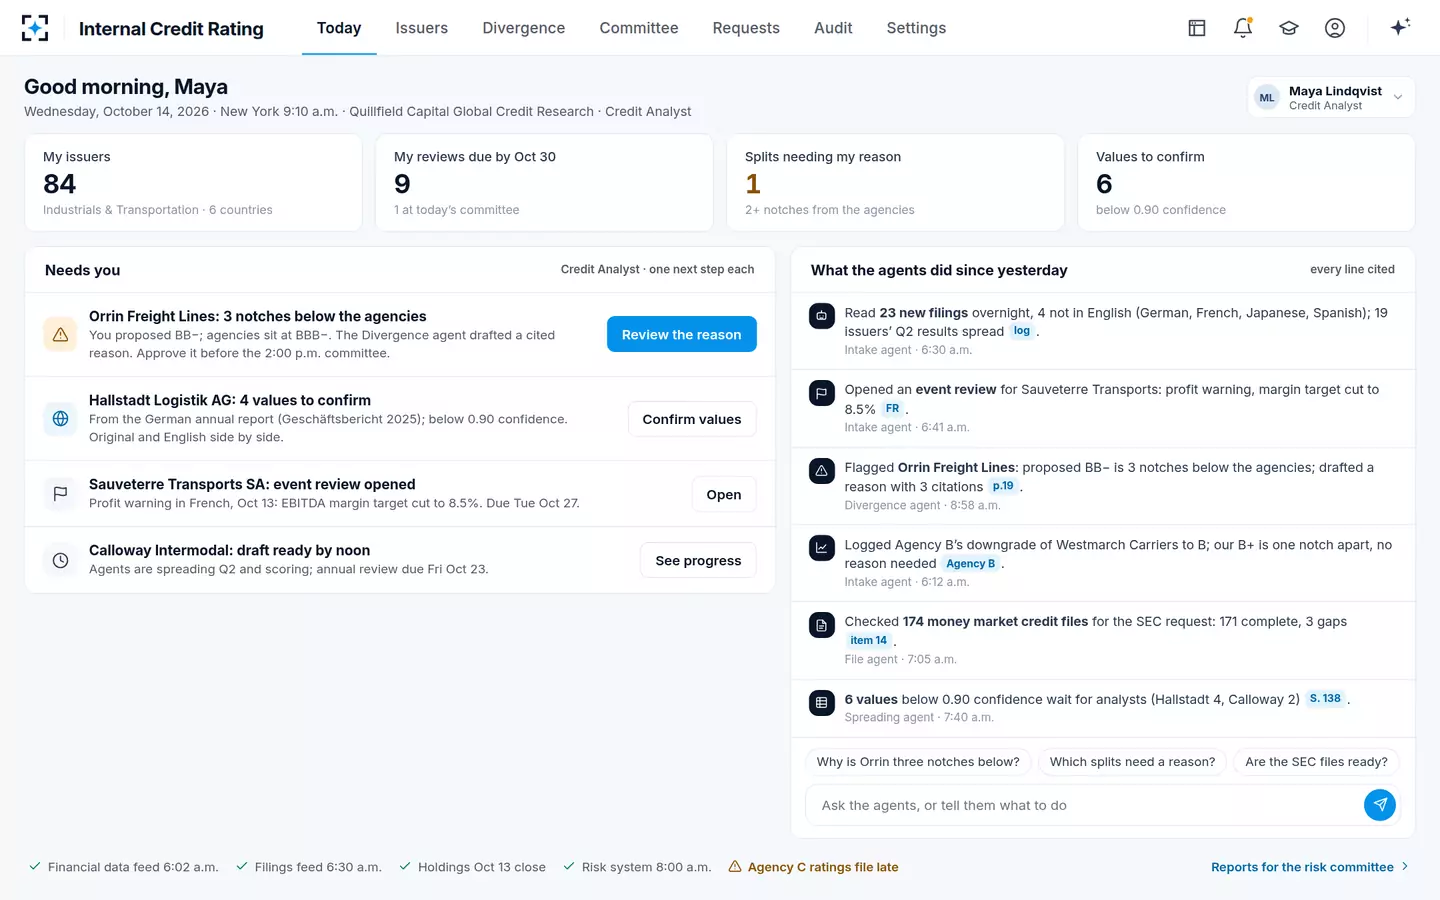
The analyst's morning in Internal Credit Rating: four numbers and the next step for each
How much does a credit rating system cost, and how do you price it?
Vendors of credit rating software do not publish prices, and no regulator or independent study measures what a rating process costs, so price it yourself. The value of a governed file is the analyst time it returns, the exam and audit time it removes and the review delays it prevents, less what it costs to license and set up. Only the first two are easy to put in money; count the others anyway.
What a governed rating file is worth to your team, per year
Analyst time returned
reviews a year × hours saved per review × loaded hourly cost
Count reviews from your cycle, annual plus event. Use your own measured hours, not our estimate.
Head of credit research
Exam and audit time removed
requests a year × hours to assemble files × loaded hourly cost
SEC, NAIC and Central Bank requests, internal audit and board reporting.
Chief compliance officer
Review delay avoided
late reviews × days late, tracked, not priced
A late review on a money market name is a compliance finding waiting to happen; count it.
Chief risk officer
Licence and set-up
annual fee + set-up hours × cost
Set-up imports issuers, maps your scale and loads your methodology versions.
Chief operating officer
Where the evidence lives: the page behind each notch
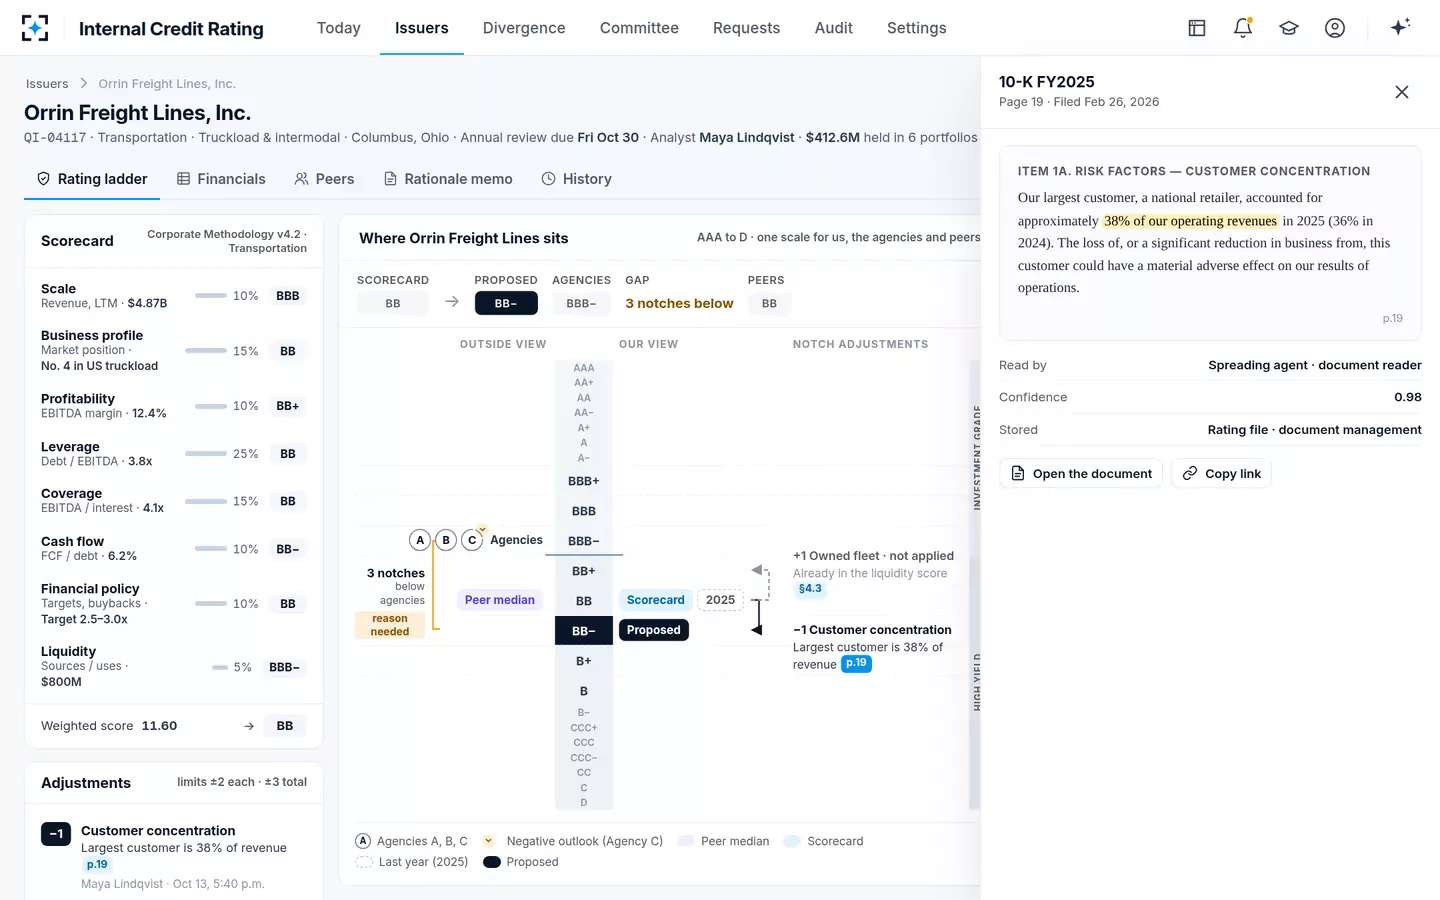
The most expensive question an examiner asks is the simplest: show me where this came from. In the sample, the notch for customer concentration opens on the 10-K's risk factors, page 19, with the passage highlighted, who read it, the confidence of the reading and where it is stored. Two years from now the page is still one click away, whoever has left.
One notch, opened on its source page
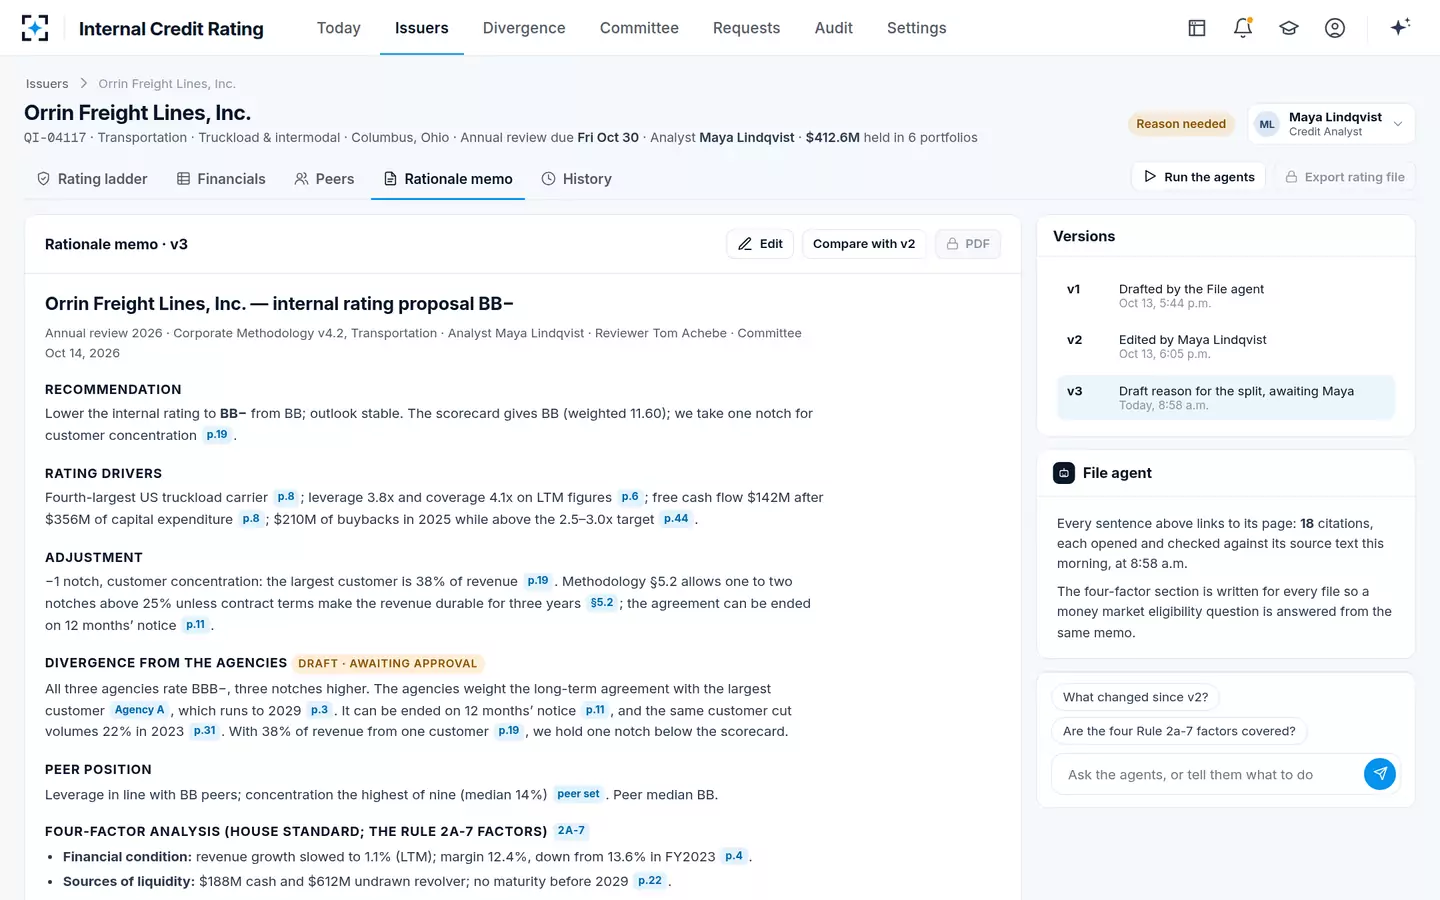
The rationale memo, every sentence linked to its page
When Excel is enough, and when it is not
A workbook built to the template above is enough for a small book with one analyst, no money market or insurance mandates and no regulator asking for rating files. It stops being enough when any of three things is true: more than one person proposes ratings under the same methodology, a regulator can ask for the files behind a fund's holdings, or the firm reports splits from the agencies to clients. Then the cost is in the file, not the formulas, and the move should be judged on the five measures above.
Internal Credit Rating does not replace the analysis Excel is good at: ad hoc models, scenarios, a quick look at a new name. It replaces the spreadsheet as the system of record for the rating, keeps your methodology as approved versions, and exports the rating file whenever someone needs it. Back-testing the scorecard on issuers you already rated is the natural first project, because it uses the files you already have.
Questions people ask
Is there a free credit rating model Excel template?
The tab structure above is free to use. What a template cannot give you is your methodology: the factors, thresholds, weights and adjustment limits are your firm's credit view and should come from your approved methodology document, version-stamped in the file.
Can a credit rating model in Excel be compliant with Rule 2a-7?
Rule 2a-7 does not regulate software; it requires a minimal credit risk determination on the four factors, ongoing review and a written record kept at least three years from the latest review. A workbook can support that if every file carries the four factors and a dated review, which the SEC's 2019 exams found some funds' files did not.
Should a rating workbook go through model validation?
If it decides eligibility or limits, govern it as if it were a model, whatever the definition says. EU money market funds must validate their credit assessment methodologies, including back testing, regardless of the tool they run in.
How long does it take to move from Excel to a rating system?
The work is in loading what you already have: issuers, your rating scale mapped to the agencies', approved methodology versions and a sample of last cycle's rating files. In Internal Credit Rating the set-up is five steps and goes to the CRO for approval before analysts start.
What happens to our old Excel files?
Keep them as records for as long as your retention rules require; the US money market rule needs three years from the latest review. Imported past files become the baseline for a back-test of the scorecard.