Third-party risk management metrics are usually built to answer "did the review happen on time," which hides the harder question a VP or CFO actually needs answered before funding anything new: what does the review cost today, and in what currency — staff-days, dollars, or the risk of a problem an examiner finds first. A quarterly fintech partner review costs roughly thirteen staff-days per partner, by our estimate, almost all of it spent collecting files and sampling loans in spreadsheets rather than exercising judgment. Fintech Partner Oversight tests every decision on a partner's weekly tape instead of a sample, and the return on moving to it is measurable in the same hours, before a single avoided finding is counted.
Where thirteen days became two and a quarter
13days
by hand, per partner, per quarter: estimated split by stage
2.25days
with Fintech Partner Oversight, same five stages
6
fintech lending partners at one sample bank, Brannock Valley Bank
Where the thirteen days of a quarterly review actually go
Ask how long a quarterly compliance review takes and most answers describe the committee meeting, not the work that fed it. By our estimate, a typical review breaks into five stages: collecting the partner's loan tape, complaint log and ad folder (two days), sampling and testing a handful of loans in spreadsheets (four days, the largest single piece), checking a sample of notices against the decisions that produced them (two days), reviewing complaints and live ads (two days), and writing the findings and the committee pack (three days) — thirteen days per partner, per quarter, before anyone has made a judgment call about what any of it means.
The five stages of a quarterly review, by hand against with agents
By hand: 13 days per partner, per quarter
- Collecting the tape, complaint log and ad folder — 2d · 15%
- Sampling and testing loans in spreadsheets — 4d · 31%
- Checking notices against decisions — 2d · 15%
- Reviewing complaints and live ads — 2d · 15%
- Writing findings and the committee pack — 3d · 24%
With Fintech Partner Oversight: 2.25 days
- Collecting — 0.25d · 11%
- Sampling and testing — 0.25d · 11%
- Checking notices — 0.25d · 11%
- Reviewing complaints and ads — 0.5d · 22%
- Writing findings and the pack — 1d · 45%
The shape of the "by hand" bar is the finding worth sitting with: sampling and testing is the single biggest stage, at nearly a third of the total, and it is also the stage that produces the least coverage — 25 to 60 loans, our assumed manual sample, out of the roughly 64,000 decisions a partner deciding 4,900 applications a week makes in a quarter. The two days spent collecting files and the two spent checking a sample of notices add up to as much time as sampling itself, on work that is mechanical rather than judgment. Writing the pack, the one stage closest to actual analysis, is the smallest.
What a sample-and-spreadsheet review costs per partner, per quarter
Turning thirteen days into a dollar figure needs one more input: what an hour of the analyst's time is worth. The Bureau of Labor Statistics puts the median annual wage for a compliance officer at $80,730 (May 2025 data), which works out to about $38.81 an hour before benefits and overhead. Benefits add the rest: in the BLS's Employer Costs for Employee Compensation for June 2026, wages and salaries were 70.0% of private-industry compensation ($32.82 of $46.89 an hour), so total cost runs about 1.43 times the wage. Rounding that loading down to 1.4 gives close to $54 an hour — our estimate, before office and system overhead, and a bank's own loaded rate may run higher or lower.
One partner's quarterly review, priced by the hour
| Stage | By hand | With Fintech Partner Oversight | Hours saved |
|---|---|---|---|
| Collecting the files | 2 days (16 hrs) | 0.25 days (2 hrs) | 14 hrs |
| Sampling and testing loans | 4 days (32 hrs) | 0.25 days (2 hrs) | 30 hrs |
| Checking notices | 2 days (16 hrs) | 0.25 days (2 hrs) | 14 hrs |
| Reviewing complaints and ads | 2 days (16 hrs) | 0.5 days (4 hrs) | 12 hrs |
| Writing findings and the pack | 3 days (24 hrs) | 1 day (8 hrs) | 16 hrs |
| Total | 13 days (104 hrs) | 2.25 days (18 hrs) | 86 hrs |
Eighty-six hours at an estimated $54 an hour comes to roughly $4,644 saved per partner, per quarter, in analyst time alone — before counting software cost, before counting a single finding either method caught or missed. That is the floor of the return, not the ceiling, because it says nothing yet about what a full-population test finds that a 40-loan sample does not.
The eight metrics that show third-party risk management is working
Third-party risk management KPIs and vendor risk management metrics tend to measure activity — was the review done, was the pack filed — rather than whether the oversight is actually working. The eight below measure the thing itself: how much of a partner's real activity is tested, and what it shows.
Eight metrics, and the formula behind each
| Metric | Formula | What it should show |
|---|---|---|
| Coverage | Decisions tested ÷ decisions made | 100% with full-population testing; under 0.1% when 25–60 loans are sampled from a partner deciding 4,900 applications a week. |
| Tests passed | Tests passed ÷ tests run | A score by partner and by domain — pricing, notices, complaints, marketing, BSA — not one blended number. |
| Pricing-grid mismatch rate | Loans priced above the grid ÷ loans funded | Near zero; a sustained rise signals an unapproved model or pricing change. |
| Notice-reason mismatch rate | Notices with the wrong reason ÷ total declines | Under the bank’s own threshold; a jump tied to one model version is a different finding than scattered noise. |
| Complaint rate | Complaints ÷ 10,000 accounts | Stable against the partner’s own trailing average; a spike against its own baseline matters more than the level. |
| Days current | Exam items ready ÷ items on the request list | Close to 100% at all times, not brought current the week before an exam. |
| Time to first finding | Days from a partner change to the first drafted finding referencing it | Days, not months — the gap a 25–60-loan quarterly sample usually cannot close. |
| Findings past due | Open findings past their due date ÷ open findings | Near zero; a rising count is a resourcing problem showing up before an exam finds it. |
How to build your own return formula from these hours
A return formula does not need to be more complicated than the inputs above: hours saved per partner, per quarter, multiplied by a loaded hourly rate, multiplied by the number of partners the bank oversees.
A return formula, term by term
Hours saved
13 days − 2.25 days, in hours
86 hours per partner, per quarter, by our estimate above.
Loaded hourly rate
BLS median wage × a loading factor
About $54/hr by our estimate; use the bank’s own figure if it has one.
Partners covered
The number of fintech lending partners under oversight
Six at the sample bank on this page.
At the sample bank's six partners, that is roughly $4,644 per partner per quarter, times six partners, times four quarters: close to $111,000 a year in analyst time alone — our arithmetic from the inputs above, not a measured outcome, and before weighing a single finding either method caught earlier or missed.
Which input moves the return the most
What a week's worth of weekly testing costs instead
The quarterly review's 2.25-day column above is not free; it is a week's worth of the agents' run plus the time a person spends reading what they drafted. On the sample week, six agents tested 4,918 decisions and drafted five findings in one minute thirty-seven seconds of run time; the 2.25 days in the table is the oversight manager's own time reading, accepting, assigning and escalating what came out of that run, across all five stages, every week rather than once a quarter.
One week, six partners, five tests each
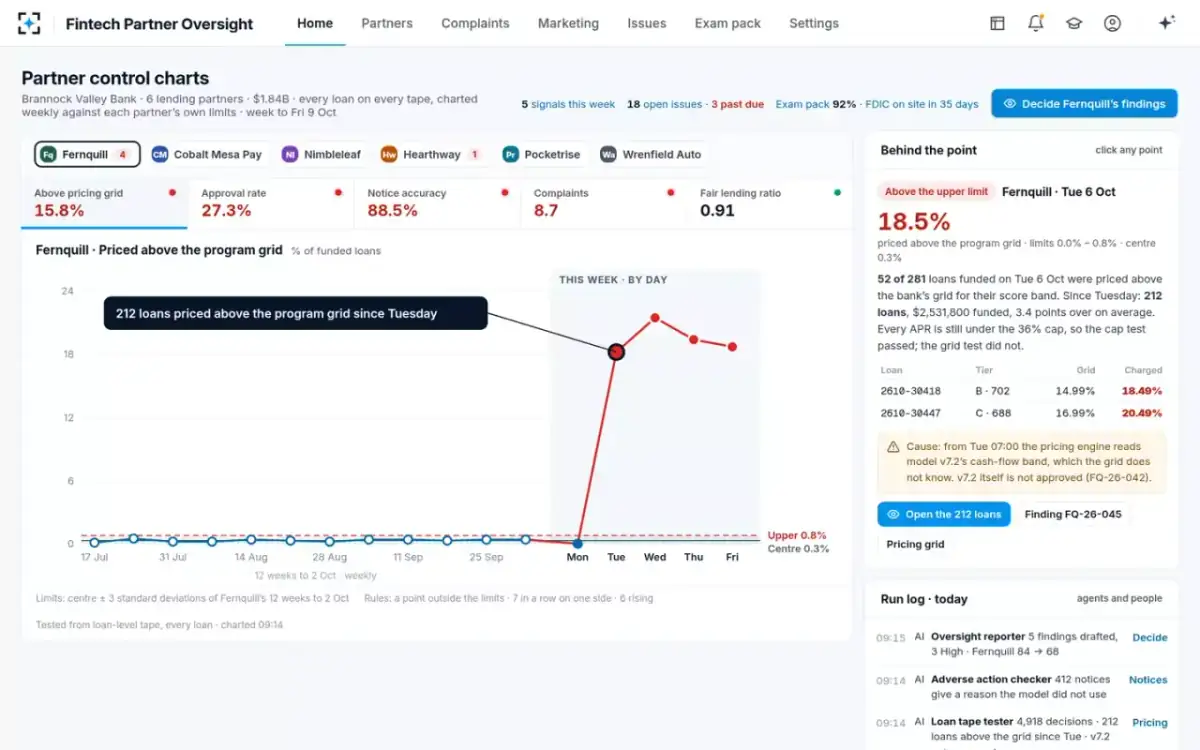
Weekly cadence changes the shape of the 2.25 days, too: instead of thirteen days once a quarter, it is a smaller amount of time every week, which is easier to staff against and does not leave eleven weeks of a partner's activity unreviewed between cycles. The pilot that proves this on a bank's own tapes measures the real weekly figure before a bank commits to it.
What this does not count: the cost of a finding an examiner finds first
Every number above prices staff time; none of it prices what happens when a problem surfaces in an exam instead of in the bank's own review. The Cross River Bank consent order is one public example of what that can mean in practice: a bank found, by the FDIC's own account, to have been "failing to establish and maintain internal controls, information systems, and prudent credit underwriting practices" was ordered to commission independent reviews of its information systems and its fair lending resources, to obtain the FDIC's written non-objection before signing any new partner or offering any new credit product, and to report the status of every required action to its board at each meeting — all under a public order. What that order required, line by line, is a separate guide; the relevant point here is that none of its remediation is priced in staff-days, because its cost is reputational and structural as much as it is hours.
The FDIC's guide for community banks says ongoing monitoring "enables bank management to determine if the third party is performing as required for the duration of the contract" — a standard a thirteen-day quarterly sample is not well positioned to meet on a partner deciding several thousand loans a week. The return formula above answers "is this cheaper"; it does not answer "is this enough," which is a judgment for the bank's own risk appetite, not an ROI calculation.
How the math changes with six partners instead of one
The return formula's partner term is linear by construction — double the partners, double the hours saved — but a bank's actual oversight burden rarely scales as neatly, because partners differ in volume, risk and how much attention each one needs. The interagency guidance on third-party relationships expects "more comprehensive or frequent monitoring" when a relationship "supports higher-risk activities, including critical activities," which in practice means a bank's highest-volume or highest-risk partners absorb more of the thirteen days than a simple average across six partners would suggest.
That unevenness is also where full-population testing returns the most, proportionally: a partner deciding 4,900 applications a week gets the same 100% coverage as one deciding 400, at a cost that scales with its own tape rather than with a fixed sampling budget. A bank weighing six partners of different sizes should expect the return to concentrate on its largest and highest-risk partners, not distribute evenly across all six.
What a buyer should ask a vendor to show, not claim
An ROI slide is easy to produce and hard to verify from the outside. A buyer evaluating any fintech partner oversight tool, this one included, should ask to see the inputs behind a return claim rather than the return itself: the actual days-by-stage breakdown on a real or replayed quarter, the coverage percentage against the partner's real decision volume, and the eight metrics above measured on the bank's own data, not a vendor's reference customer.
The scorecard a return claim should be checked against
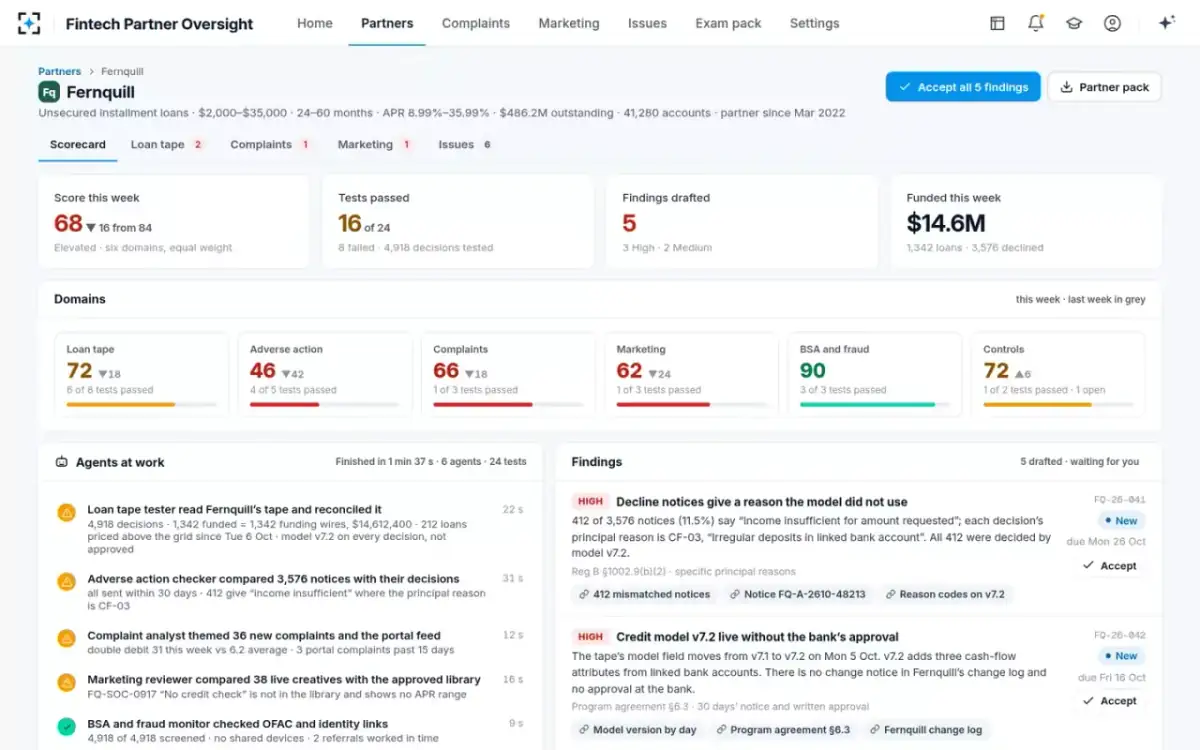
The difference between this and a general third-party risk platform matters here too: a platform that tracks questionnaires and contracts has no loan-level hours to save, because it was never doing the sampling and testing that costs thirteen days in the first place. The return this page prices is specific to tools that test loan-level data in place of a sample, not to third-party risk tooling generally.
Questions people ask
How much does a quarterly fintech partner compliance review cost?
By our estimate, roughly thirteen staff-days per partner, per quarter: two collecting files, four sampling and testing loans, two checking notices, two reviewing complaints and ads, and three writing the findings and the pack. At an estimated $54 loaded hourly rate, that is on the order of $5,600 per partner, per quarter, in analyst time alone.
How long does a quarterly compliance review actually take?
About thirteen staff-days per partner by our estimate, spread across two analysts over the days a quarterly cycle allows. Most of that time, eight of the thirteen days, goes to collecting files, sampling loans and checking a sample of notices rather than analysis.
What is the ROI of compliance monitoring software that tests every loan?
Measured in hours alone, roughly 86 hours saved per partner, per quarter, by our estimate: 13 days by hand against 2.25 days with the software, at an estimated loaded rate of $54 an hour. That figure excludes any value from findings caught earlier than a quarterly sample would catch them.
What third-party risk management metrics actually show the program is working?
Coverage of decisions tested against decisions made, tests passed by domain, pricing and notice mismatch rates, complaint rate against trailing baseline, days current against the exam request list, time to first finding, and the share of findings past due — tracked by partner, not blended into one score.
How does the cost change with six fintech partners instead of one?
The hours-saved term in a return formula scales roughly linearly with the number of partners, but the real burden concentrates on the highest-volume and highest-risk partners, which regulatory guidance expects to receive more frequent monitoring regardless of how many partners a bank oversees in total.