"Monitor continuously" is one of the most repeated instructions in third-party risk guidance, and one of the least operational. It tells a bank to watch a fintech partner's numbers every week instead of every quarter, but it does not say what a bank should actually do with a new number once it has one — compare it to what, and call it a problem based on what rule. A control chart answers both questions with a method, not a judgment call made fresh every week: a centre line and two limits built from a partner's own recent history, and a small number of specific patterns that count as a signal. It is not new. It is a century-old manufacturing technique, and it is what Botminds' Fintech Partner Oversight runs under every partner's weekly chart.
Why "monitor continuously" is not yet a method
The Interagency Guidance on Third-Party Relationships tells banks that oversight "includes ongoing monitoring throughout the duration of a third-party relationship, commensurate with the level of risk and complexity of the relationship", and that "banking organizations may adapt their ongoing monitoring practices accordingly, including changes to the frequency or type of information used in monitoring". That is a standard, not a method: it tells a bank monitoring has to happen and has to scale with risk, but it leaves "what counts as a problem in this week's numbers" entirely to the bank. A team that reads this guidance and responds only by pulling a report every week, with no rule for what in that report deserves attention, has increased its frequency without increasing its ability to actually catch anything.
The control chart in one picture: a centre line and two limits
A control chart, in its classic form, is three lines over time: a centre line at the process's own typical value, and an upper and a lower control limit a fixed distance above and below it. Walter Shewhart proposed the general model in the 1920s, and it works because the limits are not a target set by policy; they are calculated from the process's own observed variation. NIST's engineering statistics handbook describes the construction directly: "the chart contains a center line that represents the mean value for the in-control process", and the limits sit a multiple of the standard deviation above and below it — "When k is set to 3, we speak of 3-sigma control charts," which, the handbook adds, "has become an accepted standard in industry."
A control chart, built from one partner's own last 12 weeks
Weeks ending 24 August to 28 September, then Monday and Tuesday of the current week. The dashed line is the upper control limit; the solid line is the centre. One point breaks the limit.
The three signals that matter: outside the limits, seven in a row, six trending
A control chart is only useful with a short, specific list of patterns that count as a signal, because treating every wiggle as a problem defeats the purpose as badly as ignoring every wiggle does. The classic rules, from the Western Electric Company and still documented in NIST's handbook, include any point beyond the 3-sigma limit, two of the last three points beyond 2 sigma on the same side, four of the last five beyond 1 sigma, and "8 Consecutive Points on This Side of Control Line" as a sign the centre itself has shifted, alongside a separate rule for "6 in a row trending up or down" as a sign of a steady drift rather than a single jump.
Three signals, and what each one usually means
- A point outside the limits
A single week moved further from the centre than the partner’s own last 12 weeks would predict — the sharpest and least ambiguous signal.
- Seven in a row on one side of the centre
No single week looks extreme, but the partner has not been near its own typical value for seven straight weeks — the centre itself may have shifted.
- Six rising or falling in a row
A steady drift in one direction, the pattern the classic Western Electric trend rule (6 in a row trending up or down) was built to catch before it reaches either limit.
Fintech Partner Oversight's own default rules sit one point off the textbook: a run of seven matching points triggers its "one side of the centre" signal, where the published Western Electric rule uses eight. Both are defensible; a shorter run trades a little more sensitivity for a few more false signals. The limits are the bank's own settings too: three standard deviations over the last 12 weeks by default, with 26 weeks or a tighter 2.5 standard deviations as the alternatives.
Why the limits come from the partner's own last 12 weeks, not a fixed target
A fixed target — "no more than 1% of loans priced above the grid," for every partner, forever — treats a point-of-sale lender with thin margins and a personal-loan lender with a wide one as if their normal behavior should look identical. A control chart's limits are calculated from that specific partner's own recent weeks instead, so what counts as a signal is "further from this partner's own normal than its own history would predict," not "above a number a policy committee picked once." That is also why the limit recalculates as new weeks arrive: a partner whose business genuinely changes — a new product line, a new underwriting criterion the bank has approved — earns a new normal once the change itself has been reviewed, rather than permanently tripping an outdated static threshold.
What happens the week a signal fires
A signal is the start of a review, not the end of one. In the working example this guide follows, Fernquill's share of loans priced above its program grid held near a 0.3% centre for weeks, then jumped to 18.5% on a single Tuesday — a point outside the 0.8% upper limit calculated from its own prior 12 weeks. That signal did not itself prove a violation; it told the oversight manager exactly which 212 loans, out of thousands, to open first. She found every one of them was priced under a credit model version the bank had not approved — the kind of specific, loan-level fact a control chart cannot see on its own, but can point a person toward the same week it starts, instead of three months later.
A quarter of silence, by hand, against a chart that signals in week two
- Weeks pass with no test run on this partner’s weekly data13 weeks untested
- Week 1: on its own centre, no signalquiet
- Weeks 2–13: a point breaks the upper limit in week 2, then tested the same way every week aftersignal in week 2
How many false signals should a team expect?
Some, by design — a method with zero false signals would also catch nothing real. For data that behaves normally, NIST's handbook gives the arithmetic: the chance of a point beyond 3 sigma is "0.00135" in one direction, "or in both directions 0.0027" — about one week in 370 for a single test on a process that has not changed. A desk running five tests on six partners has 30 charts, so it should expect a false single-point signal somewhere roughly every three months from chance alone. Stacking multiple rules — the limit, the seven-in-a-row rule, the six-trending rule — raises the overall false-signal rate above that single-rule figure, which is the tradeoff a bank accepts for catching drifts a limit-only chart would miss. A signal that resolves to nothing once the underlying loans are opened is that arithmetic at work, not a sign the chart is miscalibrated; the review step is what keeps the method honest.
A false signal that resolves to nothing is still worth a few minutes of a compliance analyst's week, which is the real cost side of the tradeoff: tighter rules (fewer run patterns, a wider limit) mean fewer signals to review but a slower catch on a genuine drift, and looser rules mean the reverse. There is no single correct setting — a partner on a bank's watch list, already under daily testing, can reasonably run a more sensitive rule set than a partner with years of clean history, because the cost of a false signal on a partner already getting daily attention is much lower than the cost of missing a real one.
What changes between a sample review and a weekly control chart
| Quarterly 25–60 loan sample | Weekly control chart on the full tape | |
|---|---|---|
| What it tests | A sample drawn once a quarter | Every decision, every week, on every partner |
| What counts as a problem | Whatever the reviewer happens to notice in the sample | A specific, pre-agreed pattern against the partner’s own history |
| How a drift is caught | Only if the quarterly sample happens to include it | As soon as the pattern breaks a limit or a run rule — as early as the second week |
| What a bank can show an examiner | That a sample was reviewed | 13 weeks of dated tests per partner, with the signal and the evidence behind it |
Where control charts came from, and why manufacturing engineers trust them
Walter Shewhart developed the control chart to separate ordinary variation in a manufacturing process from variation that meant something had actually changed — a worn tool, a bad batch of material, a miscalibrated machine. A century later, manufacturing and quality-engineering teams still use the same centre-line-and-limits construction, and the same supplementary run rules, because the underlying problem has not changed: most processes wobble a little every cycle, and the only useful question is whether this week's wobble is still "normal" for this particular process, or whether something about the process itself has shifted. A fintech partner's weekly tape is, in that narrow statistical sense, a process like any other — and the same method that tells an engineer when to stop a production line tells a compliance team when to stop assuming a partner's "normal" still holds.
The Western Electric rules exist because a single 3-sigma limit is slow to catch a small, sustained shift. NIST's handbook explains their logic: a point beyond 3 sigma has a probability of 0.3% on a stable process, so the other rules look for patterns that are "equally rare" — two of three points between 2 and 3 sigma, four of five between 1 and 2 sigma. A fintech partner's weekly numbers drift for the same structural reason a production line does: small, ordinary causes accumulate — a marketing campaign shifts who applies, a model's inputs change gradually, a new underwriter joins a partner's team — long before any single week looks alarming on its own. The rules built to catch a shifting lathe turn out to describe a drifting approval rate about as well.
What changes when testing moves from quarterly to every week
The FDIC's supervisory highlights name what monitoring is for. Among the practices it lists for banks whose third parties market deposit products is "ensuring that monitoring and audit programs are commensurate with the size and complexity of activities to allow for timely identification and correction of consumer compliance concerns", and the same standard reads directly onto a lending partner. "Timely" is the word a quarterly sample cannot satisfy by construction — a problem that starts the Tuesday after a review closes has up to thirteen weeks to run before the next sample has any chance of catching it. Moving the same test to every week does not just compress that window; it changes what a signal can mean. A problem caught in week two, while it is still 212 loans, is a correction. The same problem caught in week thirteen, once it has touched thousands, is a finding a bank has to explain to an examiner alongside everything else it missed. How to validate that a tool testing the full population actually catches what a sample would catch — and what a sample alone cannot — is the next question once an oversight team moves to this cadence.
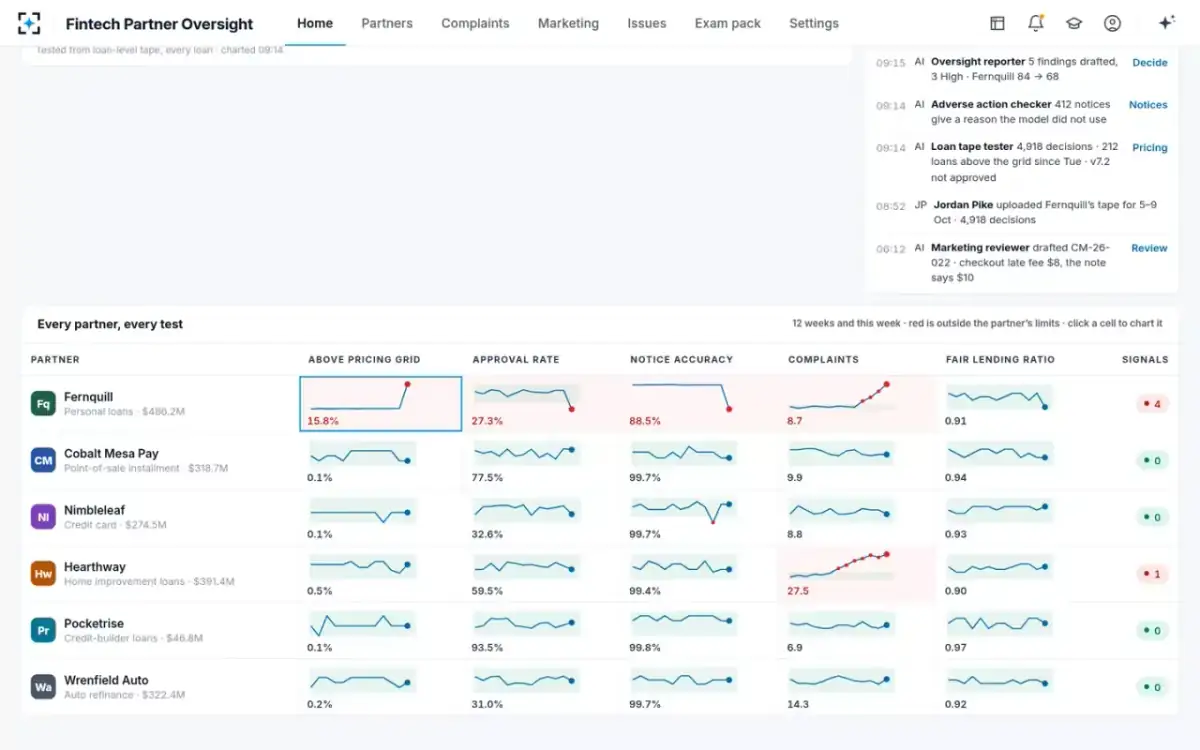
Six partners, five tests, one week — every chart on one screen
Questions people ask
What is a control chart?
A control chart is a line chart of a process's values over time, drawn with a centre line at the process's own typical value and upper and lower control limits calculated from its own variation, usually three standard deviations away. A point outside the limits, or certain patterns of points inside them, signals that the process may have changed rather than simply varied as usual.
What are the Western Electric rules?
The Western Electric rules are a published set of patterns on a control chart that count as an out-of-control signal beyond a single point crossing a limit — including runs of points clustered near a limit, eight consecutive points on one side of the centre line, and six points in a row trending steadily up or down. They let a team catch a gradual drift, not only a sudden jump.
How many weeks of data does a control chart need?
There is no single fixed answer; Fintech Partner Oversight's default calculates each partner's centre line and limits from its last 12 weeks, with a 26-week option for partners whose weekly volume is small or variable enough that 12 weeks would be noisy. The method itself does not prescribe a fixed window — the right length is enough history to represent the process's normal variation without including a period before a known, approved change.
What is a false positive in continuous monitoring?
A false positive is a signal a control chart raises for a week that, once reviewed, turns out not to reflect an actual problem — a normal statistical consequence of using any fixed probability limit, not a sign the method has failed. With 3-sigma limits on a stable, normally distributed process, a single point falls outside by chance about 0.27% of the time, roughly one week in 370 per chart; combining several run rules raises that rate somewhat in exchange for catching slower drifts.
How often should third-party risk be monitored?
The Interagency Guidance ties frequency to risk and complexity rather than naming a fixed cadence, and explicitly allows banks to adapt it as a relationship changes. For a fintech partner originating thousands of loans a week under the bank's own charter, a weekly test of the full population is what lets a control chart's "last 12 weeks" actually mean something current, rather than a window stretching back over multiple missed quarters.