The FDIC signage requirements for banks, 12 CFR Part 328, apply to every insured institution: 4,388 of them at September 30, 2025, by the FDIC’s count. They cover the official sign in branch lobbies, the advertising statement in ads, written policies, misrepresentation rules that reach fintech partners, and, from April 1, 2027, the digital sign on websites, apps and ATMs. The FDIC’s own estimates put the recurring cost low: on our arithmetic from its figures, about 27 hours a year for an average bank under $10 billion and about 580 hours for an average bank above it, almost all of the difference in branches. The FDIC also says its 2023 estimates may have understated actual costs, and they leave out the work that grows fastest: checking every screen of every channel and partner after every release. Botminds’ FDIC Signage Compliance exists to make that checking cheap enough to do monthly.
FDIC signage requirements for banks: who is covered
4,388
insured institutions subject to Part 328 at September 30, 2025
91 FR 3801
4,231
of them under $10 billion in assets
91 FR 3801
157
at $10 billion or more
91 FR 3801
3,062
small entities, at $850 million or less, for the Regulatory Flexibility Act
91 FR 3801
How much does FDIC signage compliance cost a bank?
On the FDIC’s figures, little per bank; on the work a bank actually does, it depends on how many places it has to keep right. The FDIC prices compliance in hours. In 2024 it estimated a one-time sixty hours per bank for digital work and eighty hours to update policies, plus recurring hours per branch, per digital operation and for policy upkeep. In 2026 it cut the digital estimates by about a third and priced labor at “an estimated average hourly labor cost of $123” (91 FR 3801).
Applying the FDIC’s 2026 hours to an average bank in each size group gives our estimate of recurring cost: for a bank under $10 billion, eight hours for its premises, about seven for its digital channels and twelve for its policies, near 27 hours or $3,300 a year; for a bank of $10 billion or more, 552 hours for premises, about 14 for digital and twelve for policies, near 578 hours or $71,000. One-time work to implement the 2026 digital rules is 41 hours, about $5,000, for either.
Recurring FDIC signage hours a year, average bank by size, on the FDIC’s own estimates
What the FDIC estimated in 2023, and what it cut in 2026
The 2024 final rule built its estimate from five pieces. Premises: banks under $10 billion would spend “approximately one hour per year to complete these activities at each branch while IDIs with at least $10 billion in total consolidated assets (assets) will spend, on average, approximately two hours per year per branch”. Digital: a one-time sixty hours, then ten or twenty hours a year by size. Policies: eighty hours once, then seventeen a year. Non-banks: about 1,500 of them, at 2.5 hours in the first year. In total, “approximately $64 million in the first year after adoption and approximately $20 million in each subsequent year” (89 FR 3504).
The 2026 rule touched only the digital and ATM pieces. It cut the one-time digital estimate by 19 hours and the recurring digital hours by roughly the same 32 percent, worth $388 a year to a smaller bank and $777 to a larger one, and across all banks “more than $10.2 million in implementation cost savings.” Premises and policy hours did not change.
The FDIC’s hour estimates per bank, 2023 rule and 2026 rule
| Activity | 2023 rule (89 FR 3504) | 2026 rule (91 FR 3801) |
|---|---|---|
| Digital and ATM signs, one-time | 60 hours | 41 hours (19 fewer) |
| Digital and ATM signs, each year, under $10 billion | 10 hours | 6 hours 50 minutes |
| Digital and ATM signs, each year, $10 billion or more | 20 hours | 13 hours 40 minutes |
| Premises signs, each year | 1 hour per branch (2 at $10 billion or more) | Unchanged |
| Policies and procedures | 80 hours once; 17 a year (12 of them recordkeeping) | Unchanged (12 hours a year in the burden table) |
| Hourly cost of the labor | $82.38 | $123 |
Did the FDIC underestimate signage costs?
It says it may have, in the passage quoted below, and it says the same of its estimated savings. It also admitted a basic gap in its data: “The FDIC does not have data identifying the number of IDIs that maintain digital deposit-taking channels”, so it assumed all banks would be affected equally (91 FR 3801).
The estimates measure the paperwork burden of specific duties, not the cost of being sure. They price recordkeeping, reporting and disclosure under the Paperwork Reduction Act, at an average bank, and they say nothing about how many pages, apps, ATM builds or partner screens a particular bank has. The FDIC itself lists what moves the real cost: “the size and complexity of an IDI’s digital deposit-taking channels, the number of an IDI’s ATMs and like devices, and the degree to which an IDI relies on third-party service providers”.
The FDIC recognizes that the cost estimates in the 2023 Final Rule may have understated the actual costs, and thus the estimated cost savings in this final rule may likewise understate the actual cost savings, but the FDIC is using the best estimates it has available.
FDIC, final rule of January 29, 2026
Where the cost actually sits: screens, channels and partners
The cost of FDIC signage grows with the number of places that must be checked and how often they change. A lobby changes when it is remodeled; a website changes with every campaign; an app with every release; a partner whenever it ships. The FDIC’s estimates count branches, which explains why the large-bank figure is more than twenty times the small one. They do not count screens, which is where a mid-size bank with several apps and fintech partners spends its time.
Take a fictional community bank, Tessaly Community Bank: $3.4 billion in assets, 41 branches, 58 ATMs and nine fintech partners, as it runs through Botminds’ FDIC Signage Compliance. It has 1,140 screens in scope across its own channels, ATM builds and partner apps. The solution team’s estimate is about six minutes a screen to capture and check by hand, or about 114 hours for one full pass. Done once a year, that is 114 hours; quarterly, 456; monthly, 1,368. On the FDIC’s estimates, a bank of that size would spend under 30 hours a year on everything.
One sample bank, three ways to check its 1,140 screens by hand
The difference is not a contradiction. The FDIC estimates the burden of keeping signs and policies in place; a monthly check of every screen is a monitoring choice, and Part 328 sets no frequency. But the bank that checks once a year finds a broken login page up to a year late, and the bank that checks monthly by hand spends more on the checking than the rule ever priced.
What do the FDIC signage rules require of small banks?
The same duties, at a smaller scale. Part 328 has no small-bank exemption; § 328.8 scales the policies to the size, complexity and risk of the bank’s deposit-taking. The FDIC certified that the 2026 rule has no significant impact on small entities, estimating first-year savings for the 3,062 small institutions at “less than a tenth of a percent of annual salaries and benefits for these 3,062 entities in aggregate.”
For a small bank the cost questions are practical. Its website and app are usually run by a core processor or digital banking provider, so the change itself is a request in someone else’s queue. Its ATMs may be few and old enough to keep the physical sign. Its partners, if any, are where the risk is concentrated. The deadline plan that fits a small bank is set out in the FDIC digital signage deadline.
FDIC signage requirements for banks, side by side by size
Average bank under $10 billion: 4,231 (3,062 of them at $850 million or less).
Average bank of $10 billion or more: 157.
Average bank under $10 billion: 8.
Average bank of $10 billion or more: 276.
Average bank under $10 billion: 8: one hour per branch.
Average bank of $10 billion or more: 552: two hours per branch.
Average bank under $10 billion: 6 hours 50 minutes.
Average bank of $10 billion or more: 13 hours 40 minutes.
Average bank under $10 billion: $388.
Average bank of $10 billion or more: $777.
Average bank under $10 billion: Partner screens; the vendor queue for every change.
Average bank of $10 billion or more: App and channel count; partner programs at scale.
Who pays for ATM signage updates?
The bank, usually through its ATM vendor contract. The FDIC lists “costs to upgrade hardware for ATMs and similar devices” among the costs the 2026 rule reduced, and notes that ongoing signage compliance “can be a factor in costs for third-party service agreements, hardware replacement, as well as validation and testing of service delivery channels.” The cheapest route is often not software at all. ATMs placed into service on or before April 1, 2027 may carry the physical official sign instead of the digital one (12 CFR 328.4(c)), and the FDIC supplies the official sign at no charge (12 CFR 328.2(c)).
The trade-off is ongoing. A screen build that shows the sign on the welcome screen is paid once; a physical sign on each machine has to be checked for presence and legibility on every visit. How to decide machine by machine is set out in FDIC signage requirements for ATMs.
Does the 2026 rule reduce costs?
For banks that had not yet built to the 2023 text, yes, modestly: $2,330 per bank in implementation by the FDIC’s estimate, from 19 hours at about $123, and $388 or $777 a year after. For banks that had already built, perhaps not: the FDIC said they “may not realize full cost savings from the final rule changes. In some cases, they may even incur voluntary costs to reverse or modify signage or systems that are no longer required under the final rule.” Keeping the old, wider signage is allowed; the rule does not forbid extra signs or disclosures.
The larger saving is in what no longer needs checking. With the sign required on three pages per channel rather than on every page where customers transact, and non-deposit signage only on pages primarily about non-deposit products, the inventory of places to check shrinks. A bank that keeps its old signs still only has to prove the new set.
The annual cost of FDIC signage, written as a sum
A bank can price its own figure with four terms and its own counts. Each is a number of places, times how often they are checked, times the time a check takes, at the bank’s loaded hourly cost.
Pricing FDIC signage compliance for your own bank
Lobbies
branches × reviews a year × time per review
The FDIC assumes 1–2 hours per branch a year; a dated photo per quarter is our suggested floor.
Branch operations
Digital screens
channels × in-scope screens × passes a year × minutes per screen
Three sign pages per channel plus non-deposit pages, exit links and ads.
Digital channels
Partners
partners × screens × releases a year × minutes per screen
Absent from the FDIC’s bank estimate; often the largest term for banks with fintech programs.
Partner program
Policy and evidence
policy upkeep + findings × time to draft, approve and close
The FDIC assumes 12–17 hours a year for policies; findings add to it.
Compliance
What to buy, and what not to
Three things are sold against this cost: design and development work to change the pages, periodic reviews by people, and continuous monitoring. The first is unavoidable and mostly one-time. The second prices the 114-hour pass in the example above at whatever frequency the bank buys. The third changes the per-screen time, which is the term that grows.
Botminds’ FDIC Signage Compliance is the third. Its agents capture every page and screen of the bank’s channels, ATM builds and partner apps on a schedule and after every reported fix, check each against Part 328 with the passage cited, group failures by the template that causes them so one fix closes many, and draft the correction; a reviewer checks each finding and the Compliance Officer approves it. The solution team estimates that a cycle over the sample bank’s 1,140 screens drops from about 144 hours of people’s time, including inventory, partner chasing and write-up, to about 13.5, as an estimate rather than a measured result. It does not change pages, replace a vendor’s ATM build or remove the need for people to decide, and it is worth least to a bank with one website, no app and no partners.
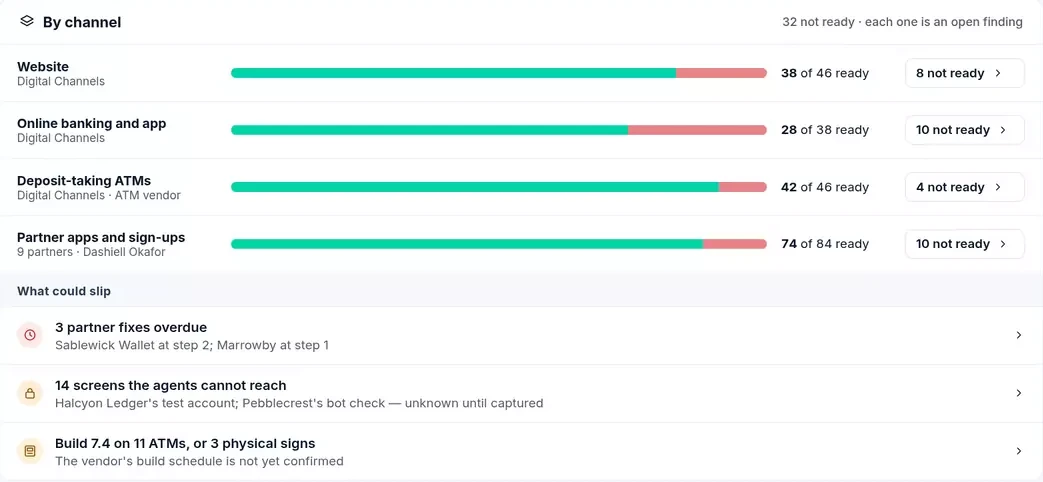
What is left, by channel, and what could slip
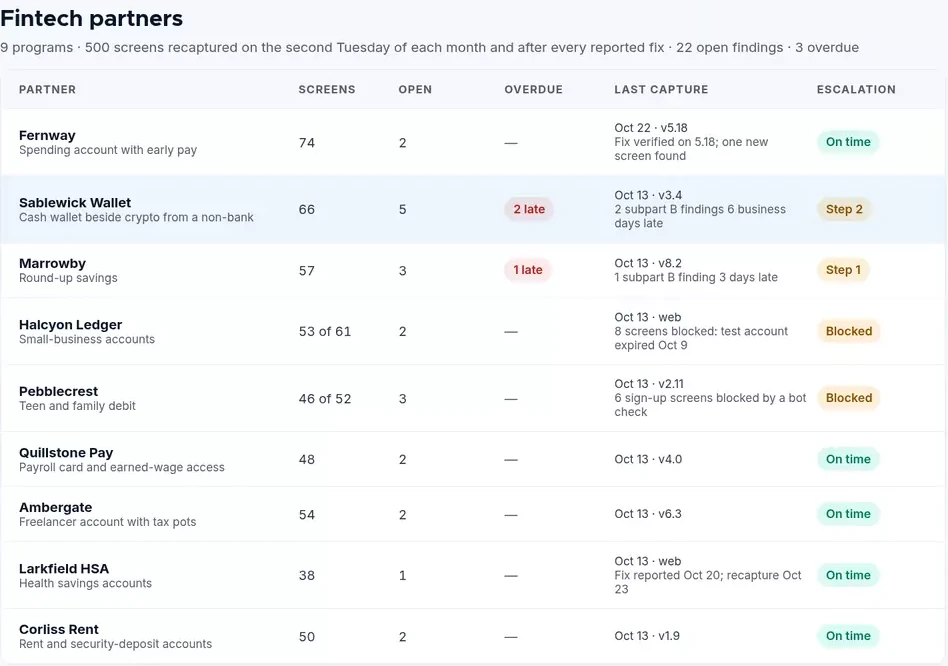
Partner screens: the cost term the FDIC’s estimate leaves out
Questions people ask
What is the FDIC signage burden for community banks?
On the FDIC’s 2026 figures, an average bank under $10 billion spends about 27 hours a year on recurring signage duties and 41 hours once to implement the digital and ATM changes. The FDIC says its estimates may understate actual costs, and they do not count the screens a bank checks.
How many banks must comply with the FDIC digital sign rule?
All insured institutions with digital deposit-taking channels or deposit-taking ATMs. The FDIC counted 4,388 institutions subject to Part 328 at September 30, 2025, and assumed all of them would be affected because it has no data on how many run digital channels.
How many hours does FDIC signage compliance take?
The FDIC’s estimates add up to roughly 27 hours a year for an average smaller bank and about 578 for an average larger one, mostly branch time. Checking every screen by hand is separate: about 114 hours per full pass for a sample bank with 1,140 screens, on the solution team’s estimate of six minutes a screen.
Is the FDIC official sign free?
Yes. A bank may order the official sign from the FDIC at no charge, and the digital sign can be downloaded from FDICconnect. Banks may also buy commercial versions that vary in size, color or material, within the rule’s limits.
Do the FDIC’s cost estimates include fintech partners?
Only as separate businesses: the FDIC estimated that about 1,500 non-banks would spend 2.5 hours in the first year on subpart B. The bank’s cost of monitoring its partners under § 328.8 sits inside the policy hours, which the FDIC set at 80 once and 17 a year in 2024.