HMDA data analysis for fair lending starts from what the public file already shows. Public HMDA data shows, for each mortgage a lender reports, the interest rate, the rate spread over the average prime offer rate, total loan costs, origination charges, discount points and lender credits, together with the borrower's reported race, ethnicity, sex, age range, income and census tract. It leaves out the credit score, the loan officer's identifier and the dates. A regulator's screen, a researcher or a journalist can therefore see a price gap between groups at one lender, but not the credit factors that might explain it. Examiners hold the full register, and the OCC says it still analyses HMDA data "for possible evidence of disparate treatment." Botminds' Fair Lending Exception Monitoring works from the other end: it compares every rate concession, fee waiver and override with loans alike on score, LTV, product, market and lock date, so a lender can see its own gaps, with their reasons, before anyone else screens them.
Your HMDA pricing record: what the public file shows, and what it withholds
| Field | Public loan-level file | Full register examiners hold |
|---|---|---|
| Interest rate, rate spread | Shown | Shown |
| Total loan costs, origination charges | Shown | Shown |
| Discount points, lender credits | Shown | Shown |
| Race, ethnicity, sex | Shown | Shown |
| Age | In ranges (25–34, 35–44 and so on) | Exact |
| Loan amount, property value | Midpoint of the $10,000 band | Exact |
| Debt-to-income ratio | In ranges, high values top-coded | Exact |
| Credit score relied on | Withheld | Shown, with the scoring model |
| Loan officer's NMLS identifier | Withheld | Shown |
| Application and action dates | Withheld | Shown |
| Automated underwriting result | Withheld | Shown |
What pricing data is in public HMDA data?
Six pricing fields: interest rate, rate spread, total loan costs, origination charges, discount points and lender credits. That is enough to rank lenders by the price gap between groups, and not enough to explain any of it. Before 2018 the file had neither credit factors nor "important pricing information, such as discount points and lender credits" (FDIC CFR WP 2022-05). The CFPB's 2019 policy guidance on loan-level disclosure lists "interest rate, rate spread, total loan costs or total points and fees, origination charges, total discount points, lender credits" among the fields it publishes. Commenters had argued that the pricing fields "would help data users identify potentially discriminatory price disparities," and the guidance kept them. The same guidance excludes "the credit score or scores relied on in making the credit decision" and the originator's NMLS identifier (84 FR 649).
The result is an asymmetry worth understanding. A lender's prices by group are public; the single largest legitimate driver of those prices is not. An outside analysis can control for loan amount, loan-to-value, income, DTI ranges, product and geography, and will still leave a residual that a credit score might explain. Whether it does is a question only the lender's own files can answer.
The scale of the public mortgage record
4,782
institutions whose 2025 HMDA data the FFIEC published in June 2026
6fields
of pricing in each public record: rate, rate spread, loan costs, origination charges, points, lender credits
0scores
credit scores in the public file; the most important legitimate pricing factor is withheld
What is rate spread in HMDA data?
Rate spread is the loan's APR minus the average prime offer rate for a comparable transaction "as of the date the interest rate is set" (12 CFR 1003.4(a)(12)). The average prime offer rate is derived from rates and pricing terms "currently offered to consumers by a set of creditors for mortgage loans that have low-risk pricing characteristics", and the CFPB publishes the tables at least weekly. Rate spread is reported for loans subject to Regulation Z, other than assumptions, purchased loans and reverse mortgages.
Its strength for screening is that it nets out the market: two loans locked in different weeks can be compared because each is measured against its own week's benchmark. Its weaknesses for an exception review are three. It is an APR, so it mixes the rate with points and some fees into one number. It is measured against a prime benchmark, so much of its variation is credit risk the rate sheet priced on purpose. And the date the rate was set, which the calculation depends on, is not itself a reported field, so no one can line a loan up against the rate sheet that priced it from HMDA alone.
How do regulators use HMDA data in fair lending exams?
They use it to choose where to look, then go beyond it. HMDA analysis is one of the inputs that decide which institutions and products get a fair lending review, and the 2025 changes to disparate impact did not remove it. The OCC's July 2025 bulletin, the one that ended disparate-impact examination, says the agency's supervisory processes "continue to include ... analyzing Home Mortgage Disclosure Act data for possible evidence of disparate treatment" (OCC Bulletin 2025-16). The CFPB describes its prioritisation as drawing on "tips and leads ... supervisory and enforcement history; consumer complaints; and results from analysis of Home Mortgage Disclosure Act (HMDA) and other data" (CFPB Fair Lending Report, 2024).
Examiners do not stop at the public file. They hold the register as filed, with credit scores and loan officer identifiers, and they can ask for the rest. The interagency procedures say that where scoping shows "a large volume of residential lending", agency policy may "call for the use of regression analysis or other statistical methods" (FFIEC, 2009). A residual gap that survives the credit score in that analysis becomes a list of files, and the files become questions about reasons.
What researchers have found in the same pricing data
Academic work using HMDA pricing data, matched to other sources for credit variables, has found gaps that persist after controls. The best-known study, by Bartlett, Morse, Stanton and Wallace, reports that "lenders charge Latinx/African-American borrowers 7.9 and 3.6 basis points more for purchase and refinance mortgages respectively, costing them $765M in aggregate per year in extra interest" (NBER Working Paper 25943).
Extra interest rate paid by Latinx and African-American borrowers, after controls
The finding about algorithms is the one that matters for monitoring. "The lower levels of price discrimination by algorithms suggests that removing face-to-face interactions can reduce discrimination," the authors write. Where a person sets part of the price, that part is where the gap tends to live, and in a rate-sheet lender that part is the exception. The money side of these basis points is worked through in what a pricing gap costs the borrower.
What is the difference between a raw and a controlled pricing gap?
A raw gap compares groups' average prices; a controlled gap compares them after accounting for the factors that legitimately set price, and the two can differ in either direction. In the FDIC's study of 2020 HMDA data, the raw conventional purchase rate gap for Black borrowers was 13.1 basis points; with credit score, LTV, income, lender, loan and geography controls it was 6.1. For Hispanic borrowers the raw gap was 2.7 basis points and the controlled gap 6.4: once credit was accounted for, the gap more than doubled (FDIC CFR WP 2022-05).
The second case is the one practitioners forget. A group with stronger average credit can show a small raw gap that hides a larger like-for-like one, so a raw screen that looks clean is not a clean result. A raw gap starts an inquiry because it cannot end one. Rate spread moves with credit score, lock date, points bought and product mix, and the public file can only approximate most of those. The comparison that settles the question uses the lender's own data: the rate sheet of the lock day, the credit score, the exception granted and its reason.
The same price gap, seen from outside and from inside
An outside HMDA screen: Final rate, rate spread, points, lender credits.
Your own exception review: The rate sheet price on the lock day, and every concession, waiver and credit taken off it.
An outside HMDA screen: No credit score; DTI and loan amount in ranges.
Your own exception review: Exact score, LTV and DTI relied on.
An outside HMDA screen: No lock date; market moves blur the comparison.
Your own exception review: Lock date and the sheet in force, so peers face the same market.
An outside HMDA screen: No loan officer.
Your own exception review: The officer, the approver and the branch.
An outside HMDA screen: No reason.
Your own exception review: The reason as written and the evidence behind it.
An outside HMDA screen: There is a gap worth asking about.
Your own exception review: Whether like borrowers were treated alike, and if not, whether a documented reason explains it.
Why HMDA data cannot show a pricing exception
Because HMDA reports only the final price, so a concession appears as a lower rate or a lender credit with no flag that it was an exception. Nothing in the register says what the rate sheet offered on the lock day, whether a person moved the price, or why. A review that starts from HMDA fields alone will find price gaps but not the decisions that made them. A review that starts from the rate sheet finds every decision, including the sub-threshold discounts the CFPB found lenders never flagged.
The same blind spot runs the other way. A borrower who bought down the rate with points and one who received a concession can show the same final rate; only the discount points and lender credit fields hint at the difference, and neither says who chose it. That is why the analysis that explains a HMDA gap is built from the pricing engine's output and the exception requests, with HMDA supplying the borrower's reported group.
How to analyze HMDA data for fair lending, step by step
Reproduce the outside view first, then explain it from inside. The steps below are the order a compliance team can follow with its own register before any examiner or researcher does.
- Run the public fields for your institution by group, by product and by loan purpose: rate, rate spread, loan costs, points and lender credits. This is what any screen will show.
- Add the credit score, exact LTV and DTI from the register and test whether the gap survives. Expect it to shrink for some groups and grow for others.
- Replace the final price with the price the rate sheet gave on the lock day, and measure each loan's concession from it. The gap now sits in a decision someone made.
- Compare each concession with similar loans locked on the same sheet, by branch and loan officer, and test whether any pattern is large and consistent enough to act on.
- Read the documented reason behind each exception in a pattern. A supported reason explains a difference; a missing one is what an examiner will ask about.
Steps one and two can be done in a spreadsheet once a year. Steps three to five need the rate sheet, the exception requests and a comparison engine, and they are worth doing every quarter or more often, because that is where the explanation, or the remedy, comes from.
The inside view of a HMDA price gap, at a sample bank
From inside, a bank-wide gap becomes a set of loans, a branch and a desk. Getting there needs one input handled with care: the borrower's group. HMDA's demographic fields come from the borrower, who may decline to give them; where they are missing, fair lending analysts estimate. The CFPB's own method for non-mortgage products, Bayesian Improved Surname Geocoding, "combines geography- and surname-based information into a single proxy probability for race and ethnicity" (CFPB, 2014). Fair Lending Exception Monitoring uses HMDA-reported race, ethnicity and sex where the borrower gave them, estimates the rest from surname and census tract, keeps the probability, and shows the result to the compliance team only.
Every concession set against similar loans, the inside view of a price gap
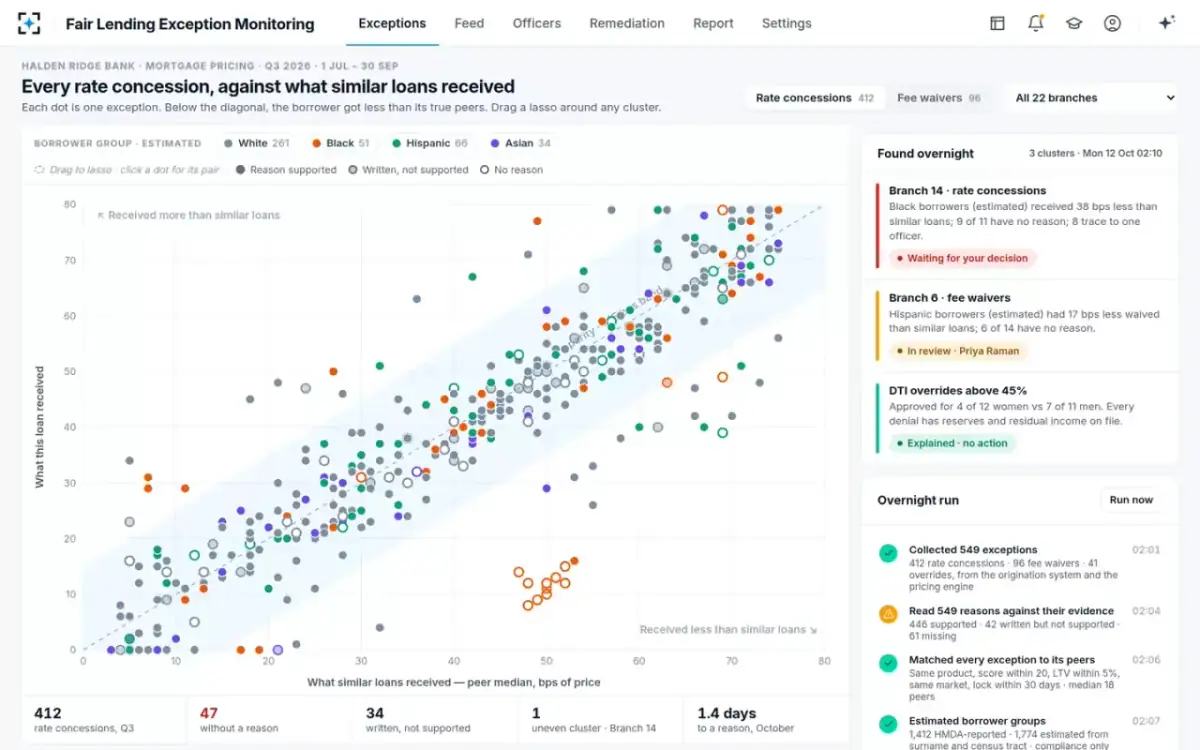
The cluster below the band is 11 loans at one branch: 12 bps on average against 50 for similar loans, a gap that holds after score, LTV, amount and product.
The scatter answers the question a HMDA screen raises. It shows whether a group's prices sit apart from those of similar loans, where the separation is, and which exceptions make it. At the sample bank most concessions sat inside a 15 basis point band around their peers; one branch's sat far below. A bank-wide average dilutes 11 loans among 412 concessions; the inside view showed where the gap was and that it came from one desk.
From a bank-wide gap to the officer behind it
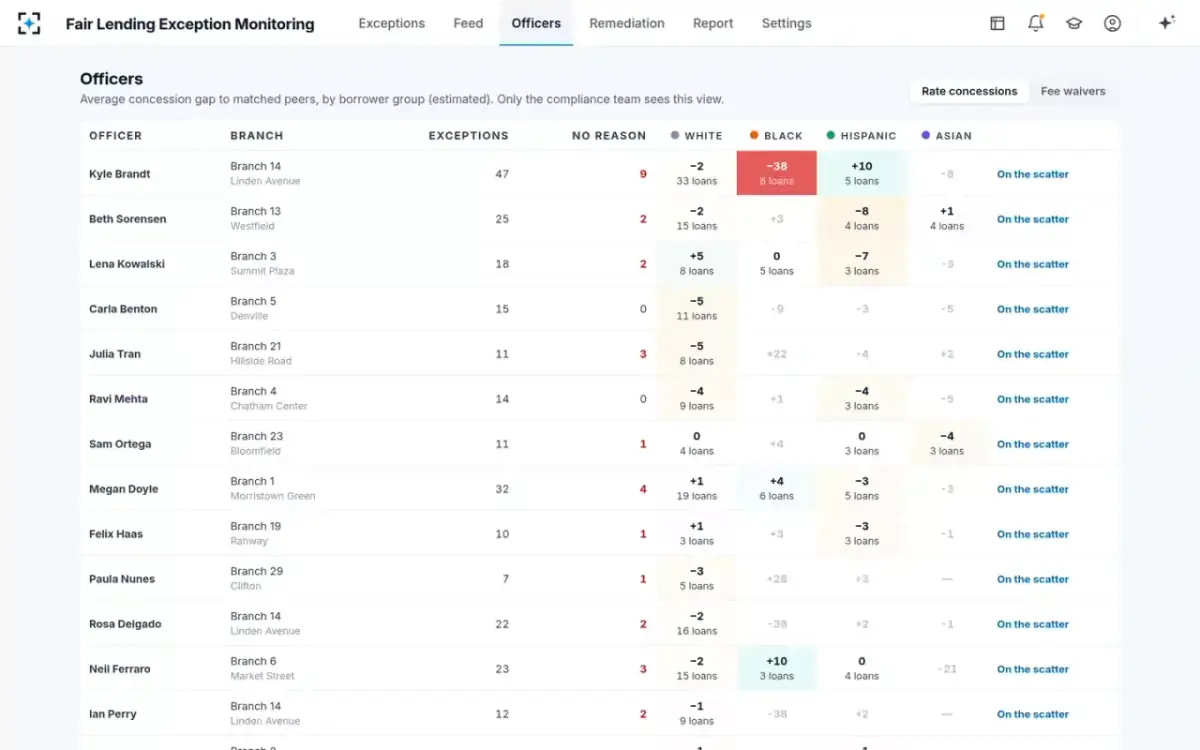
That is the reason to read your HMDA pricing data before an examiner does: not to predict the screen, but to arrive with the explanation, or to have found and fixed what cannot be explained. Whether the statistical test behind a view like this would satisfy your model risk function is covered in the second line's questions; why the comparison is evidence of treatment rather than impact is in disparate treatment vs disparate impact. The Fair Lending Exception Monitoring page shows the full quarter.
Questions people ask
Can the public see our mortgage rates by race?
Yes. The public loan-level HMDA file shows each reported loan's interest rate, rate spread, points and lender credits with the borrower's reported race, ethnicity and sex. It does not show the credit score, the exact loan amount or the loan officer.
Can HMDA data prove discrimination?
Not on its own. The public file lacks the credit score, the loan officer and the rate sheet, so a gap in it can be explained or not explained only with the lender's own data. Regulators treat it as a reason to look: the OCC analyses HMDA data "for possible evidence of disparate treatment", then examines files.
Which HMDA fields are not made public?
Under the CFPB's 2019 policy guidance, the public file leaves out the credit score, the loan officer's NMLS identifier, the application and action dates, the property address and the automated underwriting result, among others. Age, loan amount and property value are published in ranges.
Is rate spread the right measure for a pricing review?
It is a useful screen, because it nets out market rates on the lock date. For an exception review the better measure is the concession from the rate sheet price, since that isolates the part of price a person chose.
Do examiners see the credit score?
Yes. Regulation C requires the credit score relied on to be reported, and examiners work from the register as filed. Only the public version leaves it out.