Fair lending analytics, applied to pricing, is a quarterly exception review: it takes a quarter's discretionary pricing decisions (rate concessions, fee waivers, underwriting overrides), checks each has a legitimate documented reason, compares each with similar loans, finds any group of borrowers treated less well, and decides what to do about it. By hand, most lenders do it after quarter end with an exception report, a matched-pair sample of a few dozen files and weeks of emails to loan officers. Botminds' Fair Lending Exception Monitoring does the reading and comparing overnight on every exception and leaves the decisions to the Fair Lending Officer. This page follows one quarter through it at Halden Ridge Bank, a fictional sample bank: every person, branch and loan below is invented, and every figure is sample data unless a source is named.
Fair lending officers will recognise the shape of the quarter. What changes is where the days go, and how much of the book the analysis actually covers.
Where a quarter's exception review days go, by hand and with the agents
- Pull data4 d
- Chase reasons6 d
- Build the sample5 d
- Test for gaps3 d
- Remedy, report4 d
- Pull to testing3 d
- Report1.5 d
What is fair lending analytics, and what does it include?
Fair lending analytics is the statistical and file-level testing a lender runs to find out whether like applicants were treated alike on a prohibited basis, before an examiner asks. The interagency procedures organise the risk into underwriting, pricing, steering, redlining and marketing, with statistical testing where lending volume is large and file comparison everywhere (FFIEC, 2009). Each area needs its own data and its own comparison.
Five kinds of fair lending analysis, and what each compares
| Analysis | The question | What it compares |
|---|---|---|
| Underwriting | Were similar applicants approved and denied alike? | Denial rates with credit controls; marginal approved and denied files side by side |
| Pricing | Did similar borrowers pay similar prices? | Rates, fees and points after controls; every concession, waiver and override against similar loans |
| Steering | Were similar applicants offered the same products? | Product placement, such as prime against higher-priced loans, by group |
| Redlining | Were areas served alike, whatever their make-up? | Applications and loans by census tract against peer lenders and the market |
| Marketing | Did outreach reach everyone the lender serves? | Where and to whom products were advertised |
This page follows the pricing row, where discretion lives in exceptions. Analytics for it has to do three things a spreadsheet struggles with: see every exception from the rate sheet, read the reason behind each, and compare it with loans that faced the same sheet. A lender evaluating fair lending analytics software should ask to see exactly that, on its own loans; Botminds' solution does those three things for mortgage pricing exceptions and overrides, and does not cover the other four rows.
The quarter closes: 3,186 loans and 549 exceptions
Halden Ridge Bank closed 3,186 first-lien mortgage loans between 1 July and 30 September 2026 across 22 branches and granted 549 exceptions on them: 412 rate concessions, 96 fee waivers and 41 underwriting overrides. The exception collector had been pulling each one from the origination system and the pricing engine through the quarter, with the rate sheet of its lock day, the officer and the approver. At 06:00 on Thursday 1 October it closed the quarter.
By hand, this is where the review would begin. An analyst requests the exception report, joins it to loan data, finds that the reason field is blank on dozens of rows, and starts writing to officers about loans priced in July. Then comes the sample. Priya Raman, the bank's compliance analyst, puts the old arithmetic plainly: "I can review forty files a quarter. We granted 549 exceptions."
The sample bank's quarter, as the agents found it
549
exceptions read and matched to their peers in one overnight run, not a 40-file sample
61of 549
with no reason at quarter end, about one in nine; 42 more written but not supported
18peers
the median number of similar loans each exception was compared with
3clusters
found overnight: two uneven, one explained
Monday 12 October, 02:01 to 02:10: the overnight run
The full run took nine minutes. At 02:01 the agents had the 549 exceptions. By 02:04 they had read every reason against the evidence the bank's Policy 4.2 requires (a competing Loan Estimate for a competitor match, an employer letter for relocation, verified deposits for relationship pricing): 446 supported, 42 written but not supported, 61 missing. At 02:06 each exception was matched to its peers, loans with the same product, a credit score within 20 points, LTV within 5, the same market and a lock within 30 days on the same rate sheet. At 02:07 borrower groups were attached, HMDA-reported where the borrower gave them and estimated from surname and census tract otherwise. At 02:10 the disparity finder had tested 22 branches, 25 officers and 5 products and flagged three clusters.
The morning screen: every concession of the quarter against its peers
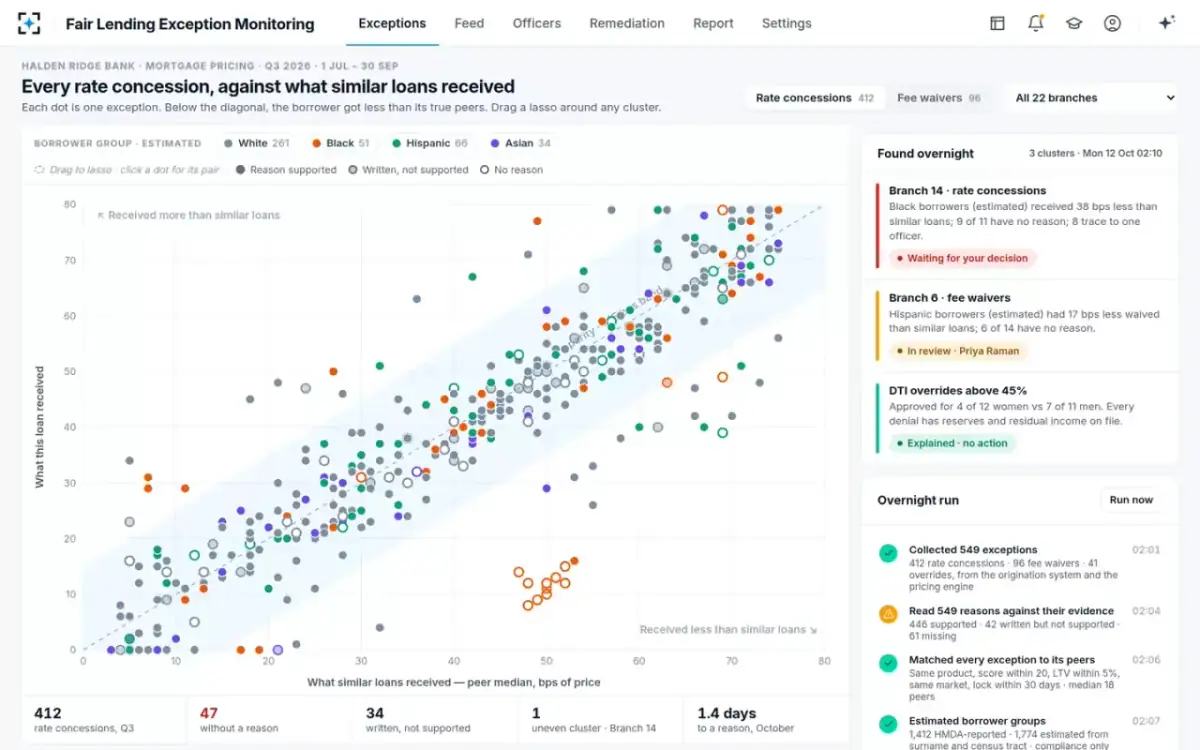
Morning: three clusters, triaged in an hour rather than built in a week
Dana Whitlock, the Fair Lending Officer, starts her Monday from the three clusters rather than from a spreadsheet. Each arrives with its gap, its significance, its missing reasons and the officers involved, so the first decision is simply which to work and who works it.
The three clusters on Monday morning
| Cluster | What the agents found | Status | Who works it |
|---|---|---|---|
| Branch 14 · rate concessions | 11 loans to Black borrowers (estimated) averaged 12 bps against 50 bps for similar loans: 38 bps, p = 0.002. 9 of 11 have no reason; 8 of 11 granted by one officer. | Waiting for a decision; rated high | Dana Whitlock |
| Branch 6 · fee waivers | 14 waivers to Hispanic borrowers (estimated) 17 bps smaller than for similar loans; 6 of 14 have no reason. | In review | Priya Raman |
| Overrides above 45% DTI | Approved for 4 of 12 women against 7 of 11 men; every denial has reserves and residual income on file. | Explained; no action | Recorded in the report |
The third row matters as much as the first. A cluster that the files explain is a finding too: it goes in the report with its explanation, and an examiner who later asks about overrides by sex finds the question already answered. A review built on a forty-file sample rarely produces that kind of negative evidence.
How do you investigate a pricing disparity? The Branch 14 trace
Start from the loans, then the reasons, then the closest pairs, then the people who priced them. Dana drew a lasso around the Branch 14 cluster and opened the investigation. It listed the 11 loans with score, LTV, the concession each got, its peer median and the reason as written. Nine said "No reason entered". One said "Manager approved", classed as written but not supported. One was a relocation discount with the employer letter on file. The page also replayed how the agents got there: the 38 basis point gap held after score, LTV, amount and product, at p = 0.002.
The investigation: 11 loans, their peers and the reasons as written
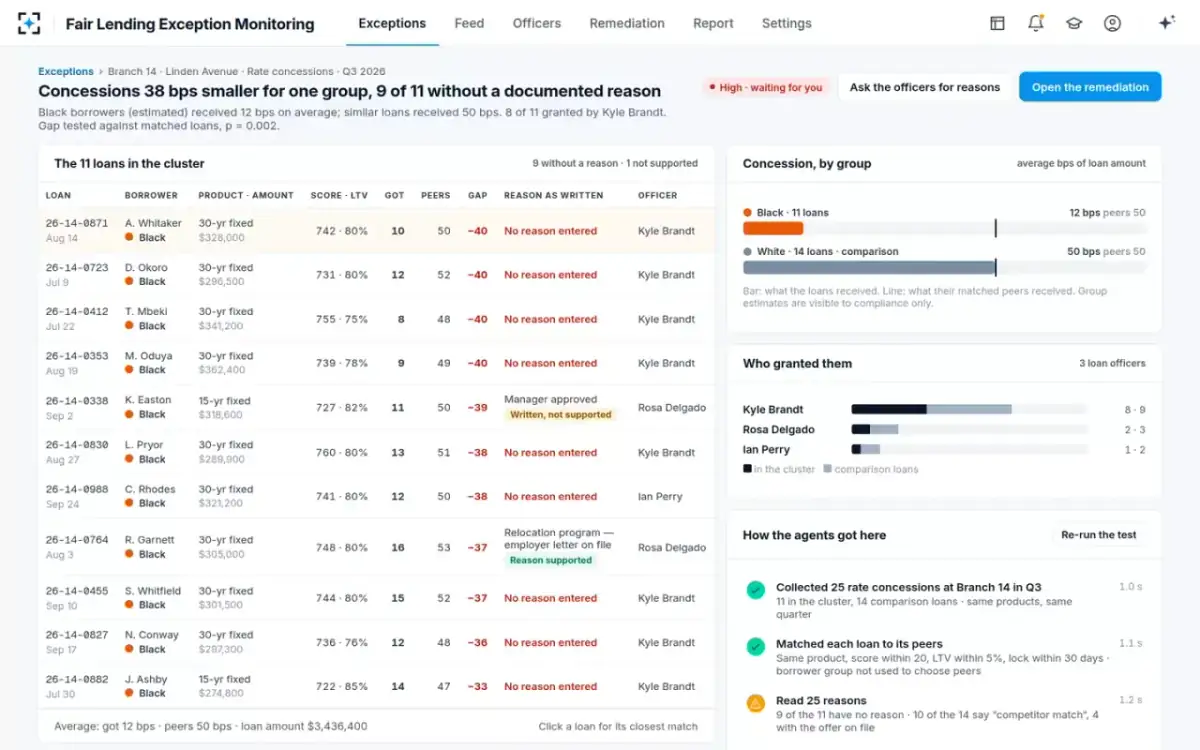
Two more views closed the question of where the gap came from. The matched pair for the first loan put a 742-score file that received 10 basis points beside a 738-score file at the same branch, with the same officer, that received 50 for a "competitor match" with no offer on file: $1,312 of difference on $328,000. The officers view showed the same officer at −38 basis points on 8 loans to Black borrowers and −2 on 33 loans to white borrowers, while every other officer sat within a few basis points. The pattern traced to one desk, not the bank's pricing. Seeing it took the morning; by hand, building the same comparison from a sample would have taken the week the timeline above allows for it, and a sample of forty would quite likely have held none of the 11 loans.
How do you remediate a fair lending pricing disparity?
With three kinds of action: pay back the affected borrowers, narrow the discretion that produced the gap, and change the policy that allowed it. Here they came to three actions, two signatures and $13,060. The report writer drafted three actions from the cluster, each with its working. Dana reviewed them and signed; Harold Bisset, the Chief Compliance Officer, co-signed. Nothing is paid or changed until both sign, and no agent sends money or a letter.
The remediation, drafted from the cluster and signed by two people
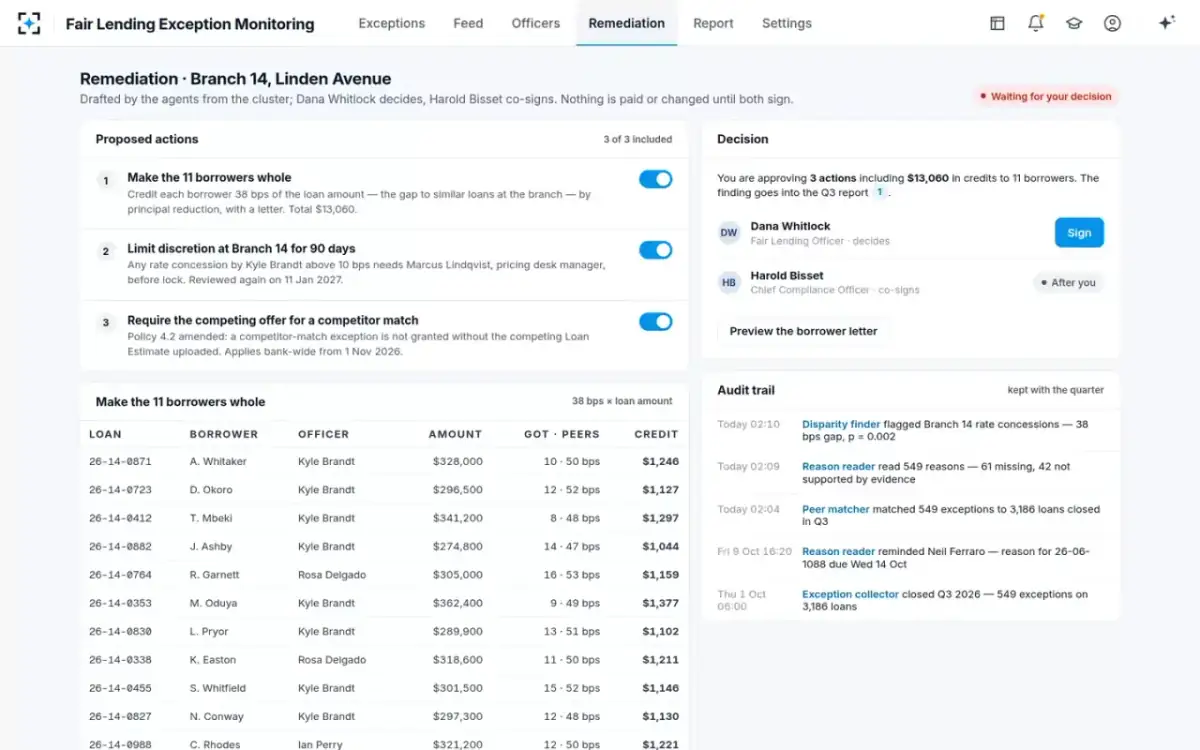
Each action does a different job. The credit corrects the effect for every borrower in the cluster, not just the files a sample would have touched; examiners check whether a lender "provides retrospective remediation to all consumers harmed by a particular violation" (CFPB compliance management review procedures). The 90-day approval requirement narrows one officer's discretion while the pattern is watched, through the pricing desk manager's approval. The policy change addresses the cause for everyone: no competitor match without the competing Loan Estimate. What the credit means to each borrower is examined in what a pricing gap costs the borrower.
What goes in a fair lending report to the board?
Scope and method, results by exception type, findings including the explained ones, actions and their status, and a measure of whether the controls work, each traceable to loans. The Justice Department's Evolve order required the fair lending committee or officer to give "quarterly updates to the Board of Directors regarding the Bank's fair lending compliance" (consent order, ¶6). Many fair lending programmes report quarterly without an order. The usual problem is that the report is assembled separately from the analysis, so its numbers cannot be traced back to loans.
The quarterly fair lending pricing report, every number linked to its loans
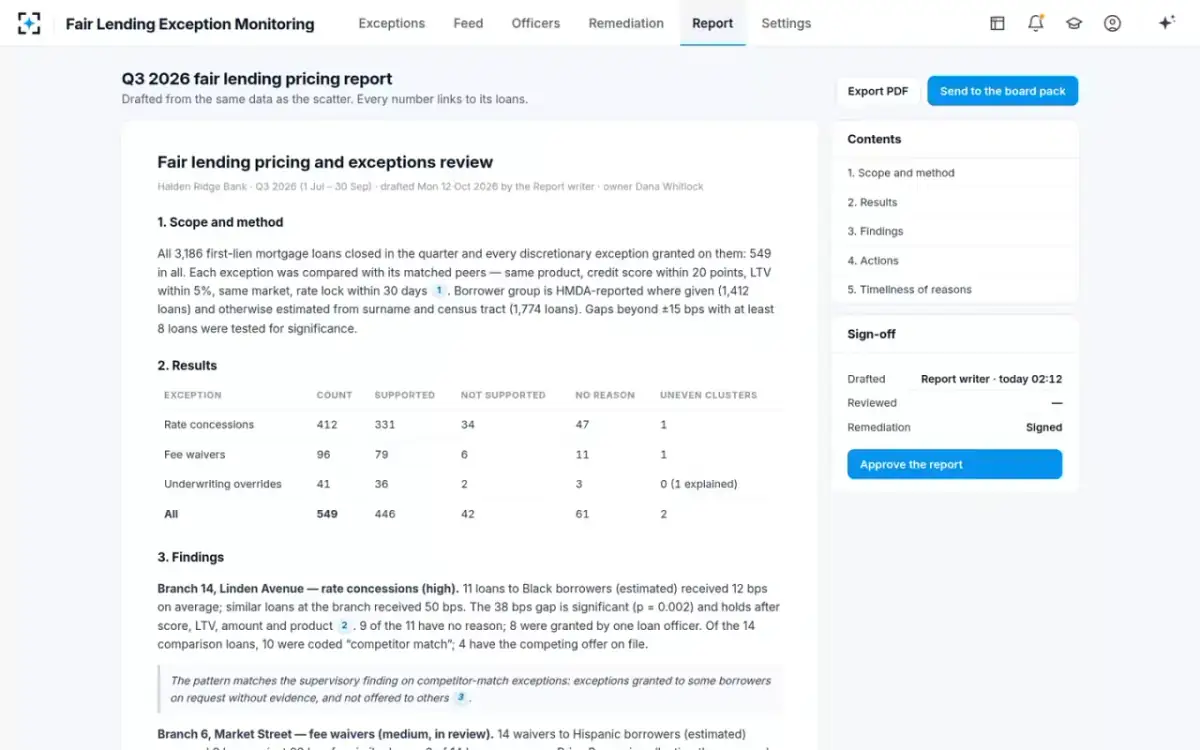
What a quarterly fair lending pricing report to the board should hold
- Scope and method
Which loans and exceptions, how peers were defined, how borrower groups were determined, the tolerance and significance used.
- Results by exception type
Counts, reasons supported, not supported and missing, and clusters found, for concessions, waivers and overrides.
- Findings, including the explained ones
Each cluster, its gap and significance, and either the action taken or the explanation that closed it.
- Actions and their status
Credits paid, limits on discretion and their review dates, policy changes and their effective dates.
- Timeliness of reasons
How quickly reasons arrive after an exception is granted, the measure that shows whether the controls are working.
- A trail from every number to its loans
So an examiner or internal audit can test the report rather than trust it.
Why a 40-file sample misses a cluster of 11
Because a cluster this size is a small share of the book, and a random sample mostly draws around it. By our arithmetic, a random 40 of the sample bank's 549 exceptions would contain none of the Branch 14 cluster's 11 loans 43 times in 100, and two or fewer 96 times in 100. On average it would draw fewer than one. A sample drawn from the 412 rate concessions alone does only a little better: none of the 11, 32 times in 100.
How many of the 11 cluster loans a random 40-file sample would catch
Examiners are told not to wait for large numbers when the pattern is stark: the interagency procedures say a pattern involving as few as four borrowers in one group can warrant examination even below the minimum sample sizes (FFIEC, 2009). A lender's own review that samples cannot hold itself to that standard; one that compares every exception can.
What changed in October, and what the next quarter should show
The quarter's most durable change was not the remediation but the timing of reasons. From October the reason reader asks for a reason the day an exception is granted, with three business days to answer and a reminder on day 2. In the first weeks of October the median written reason arrived in 1.4 days, against the bank's target of three. A competitor match at Branch 14 came in with the Loan Estimate attached and was supported in six minutes; a 40 basis point relationship-pricing concession came in without the deposits it relied on and went back to the officer.
The fourth quarter's review should therefore start in a different place. With reasons gathered at the time, the overnight run after quarter end has little to chase, and the clusters it finds will turn on reasons written when the price was set. Why that matters to an examiner is set out in reasons written at the time, and why every decision in this story stayed with Dana and Harold is in agents compare, people conclude. The Fair Lending Exception Monitoring page walks through the same quarter screen by screen.
Questions people ask
How often should a fair lending analysis be done?
The Evolve order required pricing analysis at least annually and board updates quarterly. A quarterly run matches that board cycle; reading reasons as exceptions are granted makes the quarterly run a summary of work already done rather than the start of it.
What is on a fair lending review checklist for pricing?
The rate sheets and pricing policy, the exception population measured from the sheet, the documented reason and evidence for each exception, a defined peer group, a test with thresholds set in advance, borrower groups reported or estimated, and the follow-through: remediation, limits on discretion and policy changes, with their dates.
Is an explained cluster worth reporting?
Yes. A cluster closed with its explanation, like the sample bank's overrides above 45% debt-to-income, shows an examiner that the question was asked and answered from the files. It is negative evidence that a sample rarely produces.
Who should see the fair lending analytics results?
The compliance team sees borrower groups; the pricing desk and loan officers do not. The board sees the quarterly report with findings and actions, and internal audit or an examiner can trace each number to its loans.
How long does the analysis take each quarter?
By our estimate for a bank of this size, about 22 working days by hand and about 4.5 with the agents, most of the saving in chasing reasons. That is an estimate, not a measured result, and it depends on how reasons are collected.