Portfolio stress testing in Excel is a legitimate method for a community bank. The OCC says so directly: "For most community banks, a simple, stressed loss-rate analysis based on call report categories may provide an acceptable foundation to determine if additional analysis is necessary," and a bank "may be able to examine on a single spreadsheet its key assets and liabilities and link these to income and funding requirements." The bulletin even supplies the template: loan balances by category times two-year stressed loss rates, then the effect on earnings, then on tier 1 capital. What a loss-rate spreadsheet cannot do is say which CRE loans break, or when a maturing loan meets a higher rate. The way to find out whether that matters for a given book is a pilot that reruns last year's spreadsheet test loan by loan on the same data, which is how a bank would evaluate Botminds' CRE Concentration & Stress Testing.
What the spreadsheet route costs, as we estimate it
~6weeks
to build one CRE stress test by spreadsheet on a book of about 500 loans
12days
of that spent collecting rent rolls and operating statements
1a year
how often most spreadsheet tests are run, the OCC's minimum
How do you stress test a loan portfolio in Excel?
Follow appendix B of OCC Bulletin 2012-33, which sets out a basic portfolio-level test in three sections, each a block of rows a spreadsheet can hold. The first stratifies the loan book by call report category, takes quarter-end balances and applies a two-year stressed loss rate to each. The second turns those losses into net income over the two years. The third subtracts the result from tier 1 capital and recomputes the leverage ratio (OCC Bulletin 2012-33, appendix B).
Sheet 1 of the OCC's example: two-year stress losses by call report category
| Category (RC-C) | Balance | Two-year loss rate | Loss |
|---|---|---|---|
| Construction and development | $100M | 20% | $20.0M |
| Farmland | $50M | 8% | $4.0M |
| 1–4 family housing | $100M | 4% | $4.0M |
| Multifamily housing | $75M | 16% | $12.0M |
| Nonfarm nonresidential property | $100M | 8% | $8.0M |
| Agricultural production | $40M | 6% | $2.4M |
| Commercial and industrial | $60M | 14% | $8.4M |
| Consumer and all other | $75M | 4% | $3.0M |
| Total | $600M | 10.3% | $61.8M |
Sheets two and three carry the losses to capital. In the OCC's example, pre-provision net income over the two years falls from $34.5M to $30M; the provision covers the $61.8M of losses plus $10M to keep the allowance adequate; after a $14.6M tax benefit, two-year net income is a loss of $27.2M. Tier 1 capital falls from $88M to $60.8M, and with average assets down from $800M to $738M, the tier 1 leverage ratio falls from 11% to 8.2%.
That is a complete, defensible annual test for many banks. The bulletin adds the advice that turns it into a management tool: "There is significant value in looking at the marginal changes in risk levels indicated by stress testing as management consistently conducts stress testing over time." A spreadsheet run the same way every year, on honest loss rates, shows a board whether its risk is rising.
Choosing loss rates for the spreadsheet
The loss rates carry all the judgement in a loss-rate spreadsheet, so they deserve a page of their own in the board pack. The OCC suggests drawing them from "historical loss experience during previous stressful periods, historical market experience, or other estimates," and its example uses 20% for construction and development, 16% for multifamily and 8% for nonfarm nonresidential over two years. Those are illustrative, but they show the right order of magnitude for a severe case.
The trap is recent history. The FDIC reported a median net charge-off ratio for CRE loans of 0.07% in 2025 (FDIC 2026 Risk Review). A bank that calibrated its stress rates to the last five years would be stressing at a small fraction of what its book lost in the last real downturn. The bulletin warns that periods of low losses "may mask the possibility that future losses could exceed a bank's historical losses," and asks banks to consider "the current economic environment, underwriting standards, and recent collateral appreciation" when choosing a rate.
Two practical rules follow. Write down where each rate came from, and why it is not lower. And run a second, harsher set beside the first: the gap between them tells the board how much of its capital conclusion rests on the rate it chose.
Where the loss-rate spreadsheet stops working for CRE
It stops where the board's questions become about loans rather than categories. Three limits show up first in a CRE book.
The first is maturity. A loss rate applied to the nonfarm nonresidential line treats a loan refinancing next year exactly like one fixed until 2031. In a rising rate environment that is the difference that matters most; the Mortgage Bankers Association's survey found $396 billion, 21% of the commercial and multifamily mortgages serviced by depositories, scheduled to mature in 2026 alone (MBA, February 2026). The second is property type: the call report has no office line, so an office-heavy book and a warehouse-heavy book get the same rate. The third is traceability: when a director asks which loans make up the $8M on the nonfarm nonresidential row, a loss-rate sheet has no answer.
The 2006 interagency guidance points the same way for concentrated banks: stress tests should focus "on the more vulnerable segments" of the CRE portfolio (71 FR 74580), and a segment like office or construction maturing inside the horizon is not a call report category. A bank above the screens, with office or hotel exposure, usually needs a loan-level sheet beside the loss-rate one. The method is worked through on one loan in loan level stress testing.
Building the loan-level sheet in Excel
A loan-level CRE sheet has one row per loan and a block of columns per scenario. It is buildable in Excel; the problem is keeping it current, not writing the formulas.
The columns of a loan-level CRE stress sheet
| Block | Columns | Where the data comes from |
|---|---|---|
| Loan | Balance, rate, fixed or floating, maturity or reprice date, amortisation, property type, market | The core loan system's month-end tape |
| Property | NOI and its date, occupancy, largest tenants and lease ends, appraised value and its date | Rent rolls, operating statements and appraisals, usually outside the core system |
| Scenario | Income shock, value or capitalization rate shock, rate at refinance, by property type | The board-approved scenario library |
| Stressed result | Stressed NOI, debt service at the rate in force, coverage, stressed value, loan to value | Formulas |
| Loss | Fails coverage, value or both; loss given default; projected loss | Formulas and the bank's loss assumptions |
| Roll-up | Losses by property type and market; capital and concentrations after losses | Pivot tables and call report capital |
The second block is the expensive one. At most community banks the latest operating statement and rent roll for each property sit in credit files, not in the core system, and someone has to read hundreds of them, enter the figures and note which are stale. That is where our estimate of the six weeks goes.
Where a spreadsheet stress test's working days go
One test, about 30 working days
- Collecting rent rolls and statements, 12 days · 40%
- Stressing each scenario, 8 days · 26.7%
- Writing the board report, 5 days · 16.7%
- Loan tape and capital, 3 days · 10%
- Ratios against limits, 2 days · 6.6%
Is a spreadsheet enough for community bank stress testing?
For many banks, yes, and the answer turns on the book rather than the bank's size. A bank below the 300% screen, with seasoned multifamily and little construction, can meet the guidance with the OCC's loss-rate template, run annually and compared year on year. A bank above the screens with office, hotel or construction exposure and maturities inside the horizon is the bank the guidance expects to test more thoroughly, and the question is whether a spreadsheet can stay robust when it is rebuilt by hand.
The FDIC's data say how many banks are in the second group. The median CRE concentration at banks of $1 billion to $10 billion was 311% of tier 1 capital plus the allowance at year-end 2025 (FDIC 2026 Risk Review): half the banks in that band are above the 300% line on that measure alone.
A loan-level pilot: rerun last year's test on the same book
The fairest way to judge any replacement for a spreadsheet test is to run it on the same book, the same date and the same scenarios, and compare what each one flags. A pilot does that without asking the bank to trust a new number first. The shape we would propose has four stages over about six weeks.
A six-week loan-level pilot beside the existing spreadsheet test
- Data inWeeks 1–2: data in
- RerunWk 3: rerun
- CompareWeeks 4–5: compare
- DecideWk 6: decide
Weeks one and two load the inputs: the loan tape for the date of the last spreadsheet test, the rent rolls, operating statements and appraisals for each property as they stood then, call report capital, and the scenarios the board approved. Week three reruns the test. Weeks four and five compare, loan by loan and in total. Week six is a short report to the chief risk officer: where the two agree, where they differ and why.
What the pilot compares, side by side
The existing spreadsheet test: One figure per category
The loan-level rerun on the same book: The sum of loan results, cut by property type and market
The existing spreadsheet test: Not identified
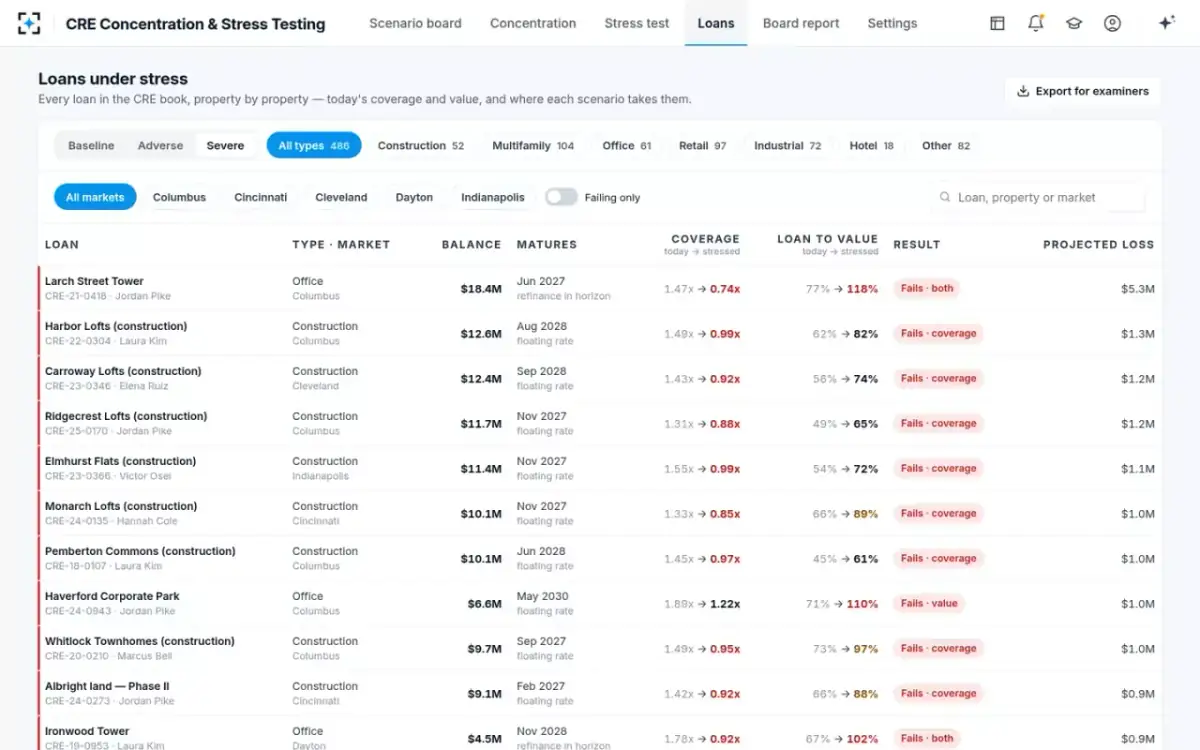
The loan-level rerun on the same book: Each one named, with coverage and loan to value today and stressed
The existing spreadsheet test: Not modelled
The loan-level rerun on the same book: Rate shock only where a loan refinances or reprices in the horizon
The existing spreadsheet test: Often invisible
The loan-level rerun on the same book: Each statement older than the threshold marked and listed
The existing spreadsheet test: Usually not computed
The loan-level rerun on the same book: Every limit re-tested after the losses
The existing spreadsheet test: Days
The loan-level rerun on the same book: Minutes
Agreement in total with disagreement by loan is the most common useful finding: the same loss figure can hide very different loans. The comparison worth bringing to the board is the list of loans the loan-level run flags that the spreadsheet could not, and what the bank would have done differently about each.
CRE Concentration & Stress Testing: the pilot's output, every loan today and stressed
What to bring to a stress testing pilot
Bring the inputs the spreadsheet already used, plus the files behind them. The pilot is only as honest as its data, so the checklist includes the stale ones.
Inputs for a loan-level pilot
- The loan tape at the date of the last stress test
Balance, rate, fixed or floating, maturity or reprice date, amortisation, collateral codes, risk rating.
- Rent rolls and operating statements as they stood
Including the old ones; they should be marked, not replaced.
- The latest appraisal or evaluation per property
With its date, so stale values can be shocked from the right base.
- The board-approved scenario library
Shocks by property type and the rate assumptions the spreadsheet used.
- Call report capital for the same date
Tier 1 capital and the allowance on loans, for concentrations after losses.
- The spreadsheet itself and last year's board report
So the comparison is to what the board actually saw.
After the pilot: monthly runs, and what to watch
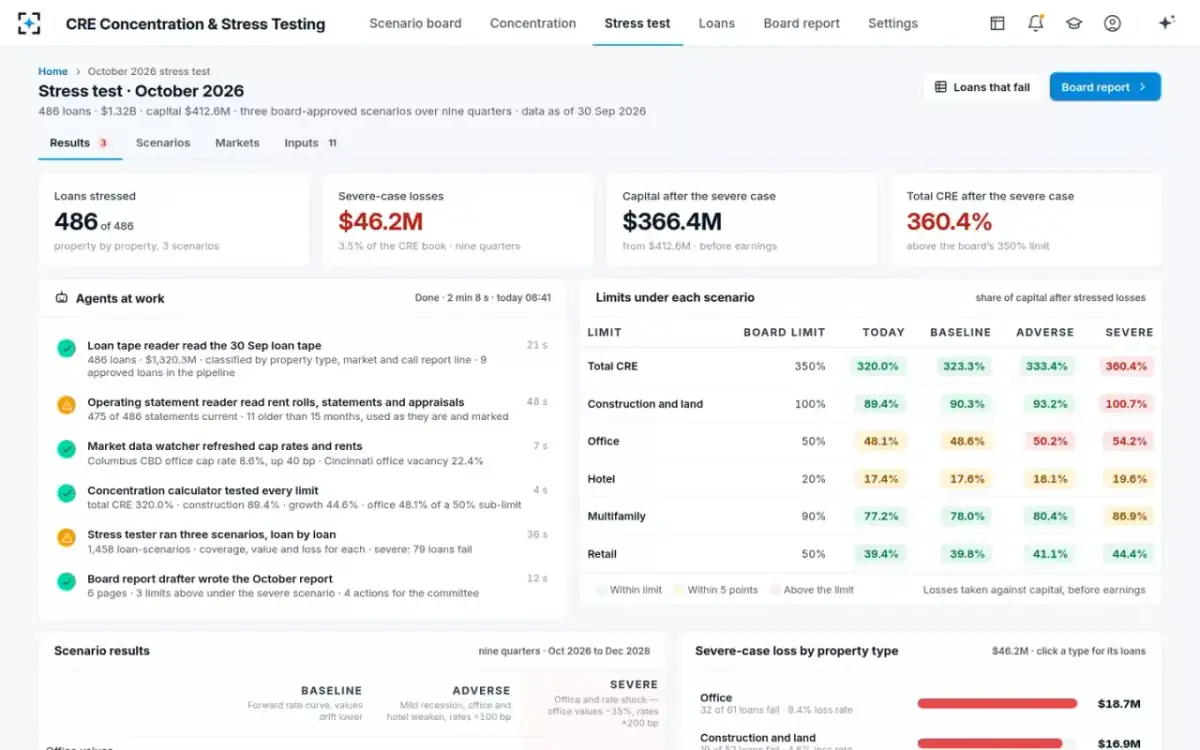
If the pilot earns its place, the next step is cadence. A monthly run on the month-end tape, with an extra run when a market's capitalization rate moves past a threshold the bank sets, turns an annual document into a standing answer. In the solution's fictional sample bank, the whole run, 486 loans under three scenarios, takes about two minutes; the target is twelve tests a year instead of one.
CRE Concentration & Stress Testing: one month's run, from tape to draft report
Two cautions carry over from the spreadsheet. The model risk question does not go away; how a stress engine sits under the April 2026 guidance is in bank stress testing software under SR 26-2. And the board still owns the scenarios: a monthly test on assumptions nobody approved is faster, not better.
Questions people ask
Is there a loan portfolio stress test .xls template?
The OCC's Bulletin 2012-33 includes one in its appendix B: estimated losses by call report category over two years, the effect on two-year net income, and the effect on tier 1 capital and the leverage ratio. It is printed in the bulletin rather than offered as a file, and the OCC's former CRE tool on BankNet was terminated in 2021.
Can a spreadsheet stress test include the rate shock at refinance?
Only at the loan level. A loss-rate sheet by call report category has no maturity dates, so it cannot tell which loans meet a higher rate inside the horizon. A loan-level sheet with each loan's maturity or reprice date can apply the shocked rate only to those loans, using the standard payment formula on the new rate and amortisation.
How long does a CRE stress test take?
No regulator measures it. Our estimate for a spreadsheet test of a book of about 500 CRE loans is around six weeks, most of it collecting and entering property financials. Software that reads those files and re-stresses each loan cuts the run itself to minutes; the bank's review of results and assumptions still takes people's time.
What is a portfolio stress test calculator?
For a bank loan book, it is any tool that applies stressed loss rates or loan-level shocks to the portfolio and reports losses against earnings and capital. Many tools with that name are built for investment portfolios and shock market prices; a CRE loan stress test needs income, rate at refinance and value by loan instead.
How do you move from spreadsheet to stress testing software?
Run both on the same book before switching. Rerun last year's spreadsheet test loan by loan with the same date and scenarios, compare totals and the loans each flags, and keep the spreadsheet as a top-down check until the board is comfortable with the new results.