Banks' CRE exposure is concentrated in the middle of the industry. US commercial banks held $3.14 trillion of commercial real estate loans in September 2026, and banks outside the 25 largest held about 70% of it. Measured against capital, the exposure is highest at banks of $1 billion to $10 billion in assets, whose median CRE concentration was 311% of tier 1 capital plus the allowance for credit losses at year-end 2025, and at regional banks of $10 billion to $100 billion, at 289%; the industry median was 200%. The FDIC counted 1,374 banks, roughly 31% of all banks, as CRE-concentrated a year earlier. These public figures let any bank place itself against its peers before an examiner does. What they cannot show is which of its own loans carry the risk, which is the question Botminds' CRE Concentration & Stress Testing answers each month.
Where bank CRE exposure sits in 2026
$3.14T
CRE loans at US commercial banks, September 2026, seasonally adjusted
69.9%
of domestic banks' CRE held by banks outside the largest 25
311%
median CRE concentration at banks of $1 billion to $10 billion, year-end 2025
1,374
banks CRE-concentrated at year-end 2024, about 31% of all banks
Which banks have the highest CRE exposure?
Measured against capital, banks of $1 billion to $10 billion do, and the largest banks the least. The FDIC's annual Risk Review publishes the median CRE concentration ratio, CRE loans as a share of tier 1 capital and the allowance for credit losses, by bank group. The pattern has held for years: concentration rises with size up to the regional band and then falls sharply.
Median CRE concentration by bank size, year-end 2024
The 2026 Risk Review put the industry median at 200% at year-end 2025, "lower than the Great Recession peak (214 percent at year-end 2008) but higher than the pre-pandemic average" (FDIC 2026 Risk Review). The median for banks of $1 billion to $10 billion slipped from 314% to 311% in the year; the regional median stayed at 289%. A median above 300% means more than half the banks in that band are above the supervisory screen on the ratio alone.
Regional banks' CRE exposure, and how big banks differ
Regional banks hold more CRE relative to capital than the largest banks but have had better loan performance; the largest banks have had the worst office losses on a small share of their books. At banks over $100 billion, the median CRE concentration was 69% at year-end 2024, but these banks carried the industry's highest delinquency. The FDIC reports that the non-owner-occupied CRE past-due and nonaccrual rate for banks over $250 billion fell for a seventh quarter to 3.08% in mid-2026, "below the recent peak of 4.99 percent in third quarter 2024 but well above the pre-pandemic average rate of 0.59 percent" (FDIC, second-quarter 2026 banking profile remarks).
Federal Reserve research explains much of the gap. Glancy and Kurtzman found that "small banks' comparatively modest delinquency rates mostly reflect observable portfolio characteristics—predominantly their low holdings of large-sized office loans—rather than unobserved factors like extension or modification tendencies" (FEDS 2024-072). The same work links higher loan-to-value, larger property size and local remote work to delinquency, especially for office. For a community bank, the lesson cuts both ways: its office loans are usually smaller and less exposed, but where it does hold large office loans, the national pattern applies.
Bank CRE exposure by property type
Nonfarm nonresidential property, which includes office, retail, industrial and hotels, is the largest part of bank CRE; construction is the smallest of the main parts and historically the riskiest. The Federal Reserve's weekly H.8 data give the split for all commercial banks.
CRE loans at US commercial banks, September 2026
| Type | Balance | Share of CRE |
|---|---|---|
| Nonfarm nonresidential | $1,916.9B | 61.0% |
| Multifamily | $641.6B | 20.4% |
| Construction and land development | $457.9B | 14.6% |
| Farmland | $123.6B | 3.9% |
| Total CRE (H.8 definition) | $3,140.0B | 100% |
Performance differs by type and by bank group. At June 30, 2026, the noncurrent rate across all FDIC-insured institutions was 0.99% for construction and development, 1.23% for nonfarm nonresidential and 1.10% for multifamily. For the FDIC's group of other banks over $1 billion, nonfarm nonresidential noncurrent was 2.68%, more than twice the industry rate (FDIC Quarterly Banking Profile, second quarter 2026, table V-A). The FDIC's data do not split office out; the Federal Reserve's supervisors say they are watching community and regional banks concentrated in CRE, with office and multifamily singled out (Federal Reserve, June 2026).
How many banks are CRE concentrated?
The FDIC counted 1,374 banks, about 31% of all banks, at year-end 2024, "resembling year-end 2023." Its definition: "total CRE loans >300 percent, or ADC loans >100 percent, of tier 1 capital and the allowance for credit losses," with unfunded commitments not included (FDIC 2025 Risk Review). Thirty percent of community banks were CRE-concentrated; community banks "held just 15 percent of the banking industry's total loan portfolio" but "29 percent of the CRE loans."
Two cautions about that count. It leaves out the 50% growth leg of the 2006 guidance's second screen, so it is wider than the number of banks that meet the guidance's criteria; and it uses the post-2020 denominator, so it is not comparable with older counts built on total risk-based capital. The arithmetic of each test is in how to calculate the CRE concentration ratio.
Did CRE concentration cause bank failures?
In the 2008 to 2013 failures, yes, above all construction concentration; in the failures since 2023 reviewed by inspectors general, no. The record is worth knowing in both directions, so that a board neither ignores concentration nor assumes today's failures look like the last cycle's.
CRE concentration at small banks that failed, and at small banks overall
Small banks that failed, 2008–2011: 333%
Small banks overall: 210%
Small banks that failed, 2008–2011: 535%
Small banks overall: 276%
Small banks that failed, 2008–2011: 104%
Small banks overall: 46%
Small banks that failed, 2008–2011: 259%
Small banks overall: 71%
The GAO found that 85% of the 414 banks that failed from 2008 to 2011 had less than $1 billion in assets, and that their failures "were largely driven by credit losses on commercial real estate (CRE) loans." The FDIC's inspector general later put the toll of poorly managed concentration risk from 2007 to 2013 at 492 failed institutions and $74.6 billion of losses to the Deposit Insurance Fund (FDIC OIG, EVAL-18-004).
The recent record is different. The inspectors general's reviews of bank failures from 2023 to 2026 attribute them to securities losses, fraud and concentrations outside real estate, not CRE. Today's CRE stress shows up in delinquencies and modifications: the FDIC counted $11.6 billion of modified CRE loans in 2025, 82% of them performing, with banks over $100 billion accounting for more than half the volume while holding 29% of CRE-secured loans. Research gives the tail risk: Jiang, Matvos, Piskorski and Seru estimate that "CRE distress could put dozens to over 300 smaller regional banks at risk of solvency runs" under their scenarios (NBER w31970).
Bank CRE exposure that matures in 2026 and 2027
Exposure is not only how much CRE a bank holds but how much of it must refinance soon at today's rates. The Mortgage Bankers Association's survey found $875 billion, 17% of $5.0 trillion of commercial and multifamily mortgages, scheduled to mature in 2026, with $396 billion of it, 21% of their balance, at depositories, and a further $652 billion across all lenders in 2027 (MBA, February 2026). The figures are unpaid balances at December 31, 2025, so amounts at maturity will be somewhat lower.
The Federal Reserve's May 2026 Financial Stability Report notes that "lenders' willingness to extend or modify maturing loans has helped to limit this risk to date. However, this option may be increasingly limited going forward" (Federal Reserve, Financial Stability Report, May 2026). New York Fed research on large banks' loan-level data adds a capital view: at the end of 2024, "CRE loans expiring within three years account for about 37.0% of marked-to-market capital for less-capitalized banks, compared with 27.8% for better-capitalized banks" (Crosignani and Prazad, Staff Report 1130).
For a board comparing itself with peers, maturity is the column public ratios leave out. Two banks at 300% are different banks if one has a third of its CRE refinancing inside two years and the other a tenth. A bank can compute its own share from the loan tape in an afternoon; the sample bank in the solution has two thirds of its CRE book, $866.8M, maturing or repricing before December 2028, which is why its rate shock matters as much as its value shock.
How to compare your bank's CRE exposure with peers
Compute your ratio the way the FDIC does, then place it in your size band and look past the ratio. Every bank's call report is public, so peers can be compared line by line, but a ratio says nothing about which loans would fail.
Placing a bank against public CRE data
- Use the same denominator as the FDIC
Tier 1 capital plus the allowance for credit losses; an older total-capital ratio will not compare.
- Compare within your size band
311% is the median for $1–10B banks; 200% is the whole industry. Use the band.
- Add the growth leg
The FDIC count ignores 36-month growth; the 2006 screen does not.
- Split by property type
H.8 and the call report do not show office separately; your own book can.
- Compare performance, not just size
Noncurrent and past-due rates by type against the FDIC's group figures.
- Show committed, not just funded
Approved construction draws raise the ratio between call reports.
- Stress it
Peer position today says nothing about capital after a severe year; a stress test does.
What public data cannot tell a board
It cannot say which loans. A bank at 280% with seasoned multifamily and low loan-to-values may carry less risk than a bank at 220% with office loans maturing next year into higher rates. Peer medians are a starting point for a board conversation; the conversation itself needs the bank's own loans stressed on their own numbers.
CRE Concentration & Stress Testing: the bank's own book, by property type, after a severe year
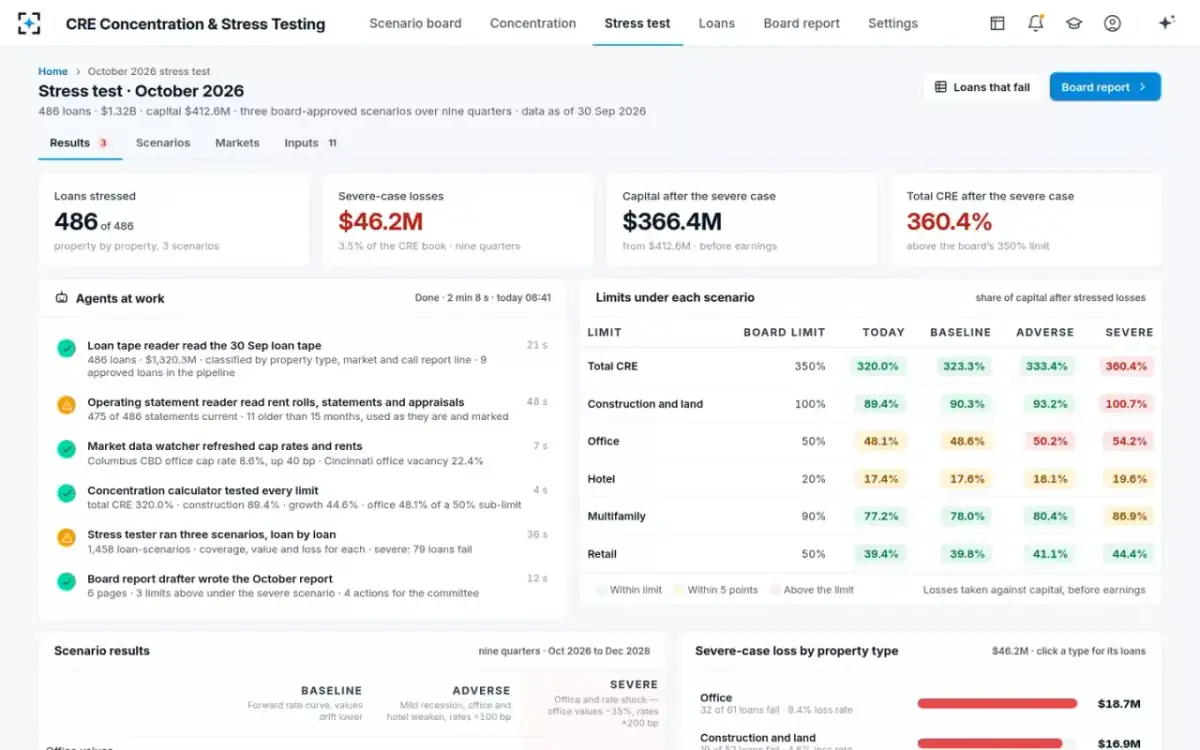
In the solution's fictional sample bank, 486 CRE loans worth $1,320.3M, the severe scenario projects $46.2M of losses over nine quarters, 3.5% of the book. Office and construction carry most of it, and twelve office loans carry $13.0M. A peer comparison would have placed this bank in its size band; the stress test names the dozen loans the board should talk about.
CRE Concentration & Stress Testing: every loan as a square, by property type
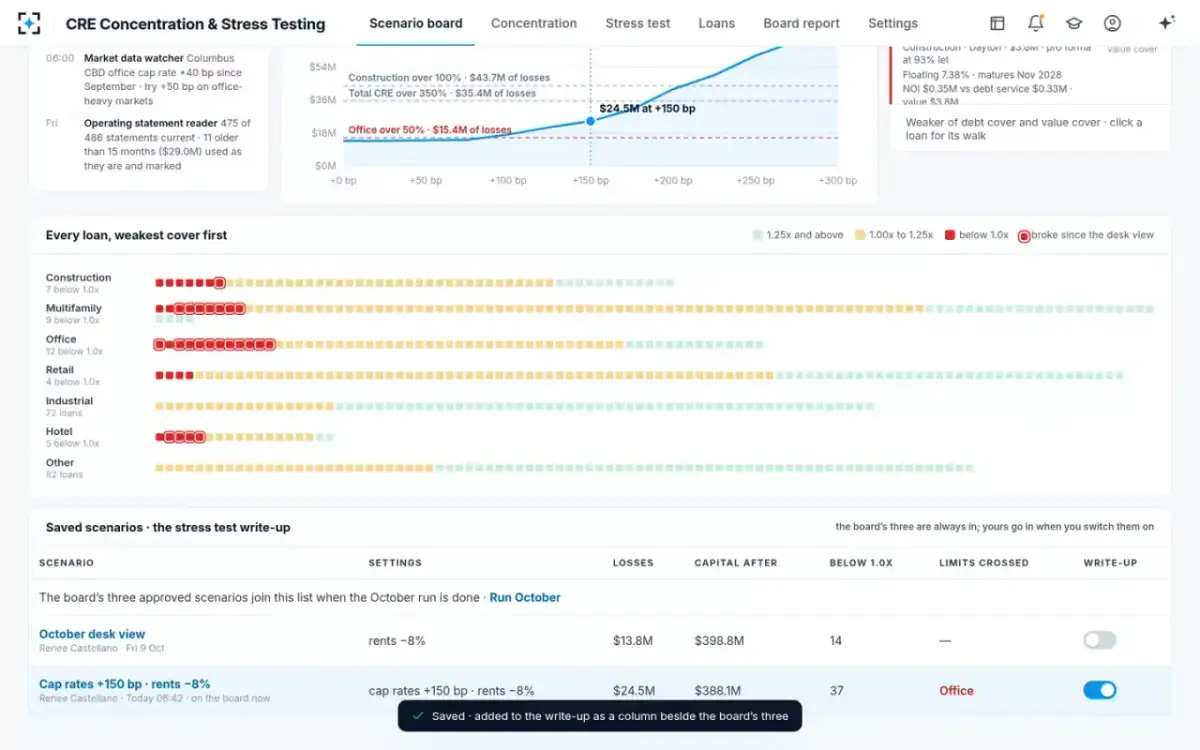
A board that sees its peer position and its own loans together can ask the right question: not "are we above the median?" but "which loans would take us over our limits, and what do we do about them now?" The board risk committee's responsibilities start from there.
Questions people ask
What is the median CRE concentration by bank size?
At year-end 2025 the FDIC reported 311% for banks of $1 billion to $10 billion, 289% for $10 billion to $100 billion, and 200% for the industry. At year-end 2024 it reported 195% for community banks, 163% for banks under $1 billion and 69% for banks over $100 billion, all on tier 1 capital plus the allowance.
Are regional banks more exposed to CRE than big banks?
Relative to capital, yes: regional banks' median concentration of 289% compares with 69% at banks over $100 billion. The largest banks have had the worst office loan performance, though, and accounted for more than half of CRE loan modifications in 2025 while holding 29% of CRE-secured loans.
Where can I find a bank's CRE concentration ratio?
No agency publishes each bank's ratio in a ready table, but every bank's call report is public. Add schedule RC-C items 1.a, 1.d, 1.e.(2) and Memorandum item 3, and divide by tier 1 capital (RC-R item 26) plus the allowance for credit losses on loans, the lines the OCC's CRE booklet cites. The FDIC's Risk Review publishes the medians to compare against.
Is high CRE exposure a sign a bank will fail?
Not by itself. In 2007–2011, 23% of banks over both supervisory screens failed against 0.5% of banks over neither, but most concentrated banks survived, and none of the 2023–2026 failures reviewed by inspectors general was CRE-driven. Risk management, capital and the quality of the loans decide the outcome.
Do credit unions have CRE exposure too?
Yes. Federally insured credit unions held $187.1 billion of commercial loans secured by real estate in the second quarter of 2026, about 93% of their commercial loans, according to the NCUA's quarterly data summary, which began reporting the split that quarter.