To calculate the CRE concentration ratio, add the bank's construction and land loans, multifamily loans, non-owner-occupied nonfarm nonresidential loans and unsecured loans that finance real estate, then divide by tier 1 capital plus the allowance for credit losses attributed to loans and leases. The 2006 interagency guidance looks twice at the result: construction and land at 100% or more of that capital, or total CRE at 300% or more with growth of 50% or more over 36 months. The hard part is not the division. It is picking the right call report lines, the right denominator, which changed in 2020, and the right balance from three years ago. Botminds' CRE Concentration & Stress Testing recomputes all three tests from the month-end loan tape, so the ratio a board sees is never a quarter stale.
The worked example on this page is an illustrative bank with round numbers, built to show the arithmetic; it is not sample data from the solution. The regulatory text is linked where it is quoted.
Where the CRE concentration ratio sits today
200%
median CRE concentration ratio across the banking industry at year-end 2025
311%
median for banks with $1 billion to $10 billion in assets
289%
median for banks with $10 billion to $100 billion
What is the CRE concentration ratio formula?
The formula is CRE loans divided by tier 1 capital plus the allowance for credit losses on loans and leases, expressed as a percentage. Two ratios come out of it. The construction ratio puts only construction, land development and other land loans on top. The total CRE ratio puts every loan the guidance counts as commercial real estate on top, construction included.
The numerator lines are named in the OCC's Commercial Real Estate Lending booklet. For construction, it is call report schedule RC-C, Part I, items 1.a.(1) and 1.a.(2), plus Memorandum item 3. For total CRE, it is items 1.a, 1.d, 1.e.(2) and Memorandum item 3 (OCC, Commercial Real Estate Lending, footnotes 87 and 89). Item 1.d is multifamily. Item 1.e.(2) is nonfarm nonresidential property where repayment depends on third-party rent or a sale or refinancing. Memorandum item 3 picks up loans that finance real estate, construction and land development but are not secured by real estate.
What is left out matters as much. Item 1.e.(1), loans secured by owner-occupied nonfarm nonresidential property, is not in the total CRE ratio, because the guidance covers loans whose repayment comes from the real estate rather than from the borrower's business. Farmland and 1–4 family mortgages are out too. Getting the owner-occupied split right is the single largest judgement in the numerator, and the 50% rent test that decides it has its own guide.
What goes into the total CRE ratio, line by line
Numerator: total CRE, $1,220M
- Construction and land, 1.a · 24.6%
- Multifamily, 1.d · 25.4%
- Non-owner-occupied nonfarm nonresidential 1.e.(2), with Memo item 3 · 50%
Denominator: $400M
- Tier 1 capital, RC-R item 26 · 90%
- Allowance for credit losses on loans · 10%
Why tier 1 capital plus the allowance, and not total capital?
Because the agencies changed the denominator on March 31, 2020, and every supervisory calculation since uses tier 1 capital plus the allowance. The 2006 guidance itself still reads "total capital," which its footnote 5 defined as total risk-based capital from schedule RC-R (71 FR 74580). The 2020 joint statement replaced that for supervisory purposes: the agencies "will consistently calculate credit concentrations using tier 1 capital plus the appropriate allowance for loan and lease losses (ALLL) or allowance for credit losses (ACL) as the denominator" (OCC Bulletin 2020-29).
The reason was practical. The agencies issued the statement "in response to changes in the type of capital information available after the implementation of the Community Bank Leverage Ratio (CBLR) rule," to give "a consistent approach for calculating credit concentrations for all banking organizations." Tier 1 capital and the allowance are reported by every bank; the statement is careful about scope: the approach "applies only to supervisory calculations for credit concentration ratios and does not affect the calculation of total capital used for other purposes."
The OCC booklet spells out the allowance to use. A bank on the current expected credit losses methodology adds "the allowance for credit losses attributed to loans and leases"; a bank not yet on it adds the entire allowance for loan and lease losses. Tier 1 capital comes from RC-R item 26 (OCC booklet, footnote 88). An allowance for credit losses on held-to-maturity securities or on off-balance-sheet exposures is not part of it.
The same illustrative bank on two denominators
Old spreadsheet: total risk-based capital: $425M total risk-based capital, including $25M of subordinated debt in tier 2
Since March 2020: tier 1 plus the allowance: $360M tier 1 + $40M allowance on loans = $400M
Old spreadsheet: total risk-based capital: $300M ÷ $425M = 70.6%
Since March 2020: tier 1 plus the allowance: $300M ÷ $400M = 75.0%
Old spreadsheet: total risk-based capital: $1,220M ÷ $425M = 287.1%: under 300%
Since March 2020: tier 1 plus the allowance: $1,220M ÷ $400M = 305.0%: over 300%
Old spreadsheet: total risk-based capital: Neither criterion met
Since March 2020: tier 1 plus the allowance: Total CRE criterion met, if growth is 50% or more
That is the practical trap. A spreadsheet built before 2020, or a vendor template copied from the 2006 text, can show a bank comfortably below 300% while its examiner's calculation shows it above. Enforcement orders now write the newer denominator into the requirement: the OCC's 2025 consent order with EH National Bank sets the bank's concentration limits and sub-limits as percentages of tier 1 capital plus the allowance for credit losses (OCC AA-WE-2025-20).
How to calculate the CRE concentration ratio, step by step
Work from the same call report the examiner will use, in this order. Each step names its source line so a reviewer can re-perform it.
The CRE concentration calculation on one illustrative bank
| Step | Source and arithmetic | Result |
|---|---|---|
| 1. Construction, land development and other land | RC-C items 1.a.(1) $45M + 1.a.(2) $255M | $300M |
| 2. Multifamily | RC-C item 1.d | $310M |
| 3. Non-owner-occupied nonfarm nonresidential | RC-C item 1.e.(2); item 1.e.(1) owner-occupied $240M is excluded | $590M |
| 4. Real estate finance not secured by real estate | RC-C Memorandum item 3 | $20M |
| 5. Total CRE | Steps 1 + 2 + 3 + 4 | $1,220M |
| 6. Denominator | Tier 1 capital, RC-R item 26, $360M + allowance for credit losses on loans and leases $40M | $400M |
| 7. Construction ratio | $300M ÷ $400M | 75.0% |
| 8. Total CRE ratio | $1,220M ÷ $400M | 305.0% |
| 9. Growth over 36 months | ($1,220M − $780M three years ago) ÷ $780M | 56.4% |
| 10. Screens | Construction under 100%; total CRE at or above 300% with growth at or above 50% | Second criterion met |
Step 9 is where hand calculations most often slip. The growth leg compares today's total CRE balance with the balance 36 months earlier, so it needs the call report from twelve quarters back, on the same line definitions. A bank that has reclassified loans between owner-occupied and non-owner-occupied in between is not comparing like with like. The OCC and Federal Reserve staff who studied the screens measured growth "using total CRE on a call report basis since owner-occupied could not be eliminated, lacking data prior to 2007" (Friend and Glenos, 2013), which shows how much the line split matters.
Step 10 has to be read exactly. The construction test stands on its own. The total CRE test has two legs, and both must be met: a bank at 340% with 20% growth does not meet the second criterion, and a bank at 260% with 80% growth does not either. Neither is a safe result, as the next sections show.
The 300% CRE concentration test: what it means when a bank crosses it
Crossing 300% with 50% growth, or 100% in construction, means the bank "may be identified for further supervisory analysis" (2006 guidance). It is not a breach. The OCC booklet repeats the point in a footnote of five words: "These criteria are not CRE lending limits" (OCC booklet, footnote 86). There is no regulatory maximum CRE concentration.
What changes is the evidence the bank is expected to keep. A bank over the screens should show board-approved limits and sub-limits, management information that stratifies the book, market analysis and portfolio stress testing that quantifies the effect of changing conditions on asset quality, earnings and capital. Examiners read the ratio as a reason to look, and then grade the risk management. The ratio also matters below the line: the guidance is explicit that a bank "that has experienced rapid growth in CRE lending, has notable exposure to a specific type of CRE, or is approaching or exceeds" the criteria may be looked at.
Do the screens predict anything? The failure record
They did, strongly, in the last downturn. OCC and Federal Reserve staff tracked 7,379 banks from March 2007 to September 2011 and grouped them by which criteria they met at the start. The failure rate rose with every criterion added, and the construction test carried the most weight on its own.
Failure rates, 2007 to 2011, by which concentration test a bank met
The same study estimated that banks over the construction criterion alone accounted for about 80% of the losses to the FDIC's insurance fund from 2007 to 2011. That is the reason to compute the construction ratio monthly, not just the headline 300%: construction books move fastest, through draws on approved commitments, and a bank can cross 100% between two call reports without making a single new loan.
Common mistakes in the CRE concentration calculation
Most errors are classification errors, not arithmetic ones. The list below is the one we would check before a board pack goes out.
Seven checks before the ratio goes to the board
- The denominator is tier 1 capital plus the allowance on loans
Not total risk-based capital, and not the allowance including securities or unfunded commitments.
- Item 1.e.(2) only, never 1.e as a whole
Owner-occupied nonfarm nonresidential loans are outside the total CRE ratio.
- Memorandum item 3 is included
Unsecured loans to developers and real estate investment trusts count when their performance tracks the CRE market.
- The growth base is twelve quarters back, on today's definitions
Reclassifications in between distort the 50% test.
- Unfunded commitments are shown separately
The FDIC's count of concentrated banks excludes them; the board still needs the funded-plus-pipeline figure.
- Benchmarks and board limits are labelled apart
The 100% and 300% screens are supervisory indicators; the board's limits are the bank's own.
- The ratio is recomputed after stress losses
Losses reduce capital, so a book under 300% today can cross it in the severe case.
The last check is the one most often missed. A stress test that reports losses but not the concentration ratio after those losses answers half the board's question. The loan-level stress test produces the losses; the ratio after losses divides the same CRE book by capital reduced by them.
The ratio after stress losses: a second number the board needs
A concentration ratio after stress is the same CRE book, less the loans charged off in the scenario, divided by capital reduced by those losses. Because losses come out of the denominator in full and out of the numerator only once, the ratio rises under stress even as the book shrinks. That is the arithmetic behind the guidance's request that stress tests quantify the effect of changing conditions on "asset quality, earnings, and capital" (2006 guidance).
The illustrative bank's total CRE ratio before and after a severe scenario
| Measure | Today | After $50M of stress losses |
|---|---|---|
| Total CRE | $1,220M | $1,170M |
| Tier 1 capital plus the allowance on loans | $400M | $350M |
| Total CRE ratio | 305.0% | 334.3% |
| Board limit, say 350% | 45 points of headroom | 15.7 points of headroom |
| Headroom in dollars of CRE | $180M | $55M |
Read in dollars, the change is stark. A bank with $180M of room under its own limit today has $55M after a severe year, and that is before it funds the construction loans it has already approved. Boards set limits on the ratio; they decide on new lending in dollars. A report that converts one into the other saves the committee the arithmetic, and what a concentration risk report should show sets out the rest of the page.
How CRE Concentration & Stress Testing recomputes the ratio every month
In the solution, a loan tape reader classifies every loan on the month-end tape by property type, market and the call report line the guidance uses, and leaves any owner-occupied question for the credit file rather than changing the status itself. A concentration calculator then tests total CRE, construction and 36-month growth against the board's limits and the supervisory benchmarks, shown apart, with and without approved loans not yet funded, and states headroom in dollars.
CRE Concentration & Stress Testing: every loan in the book, with the line it is counted on
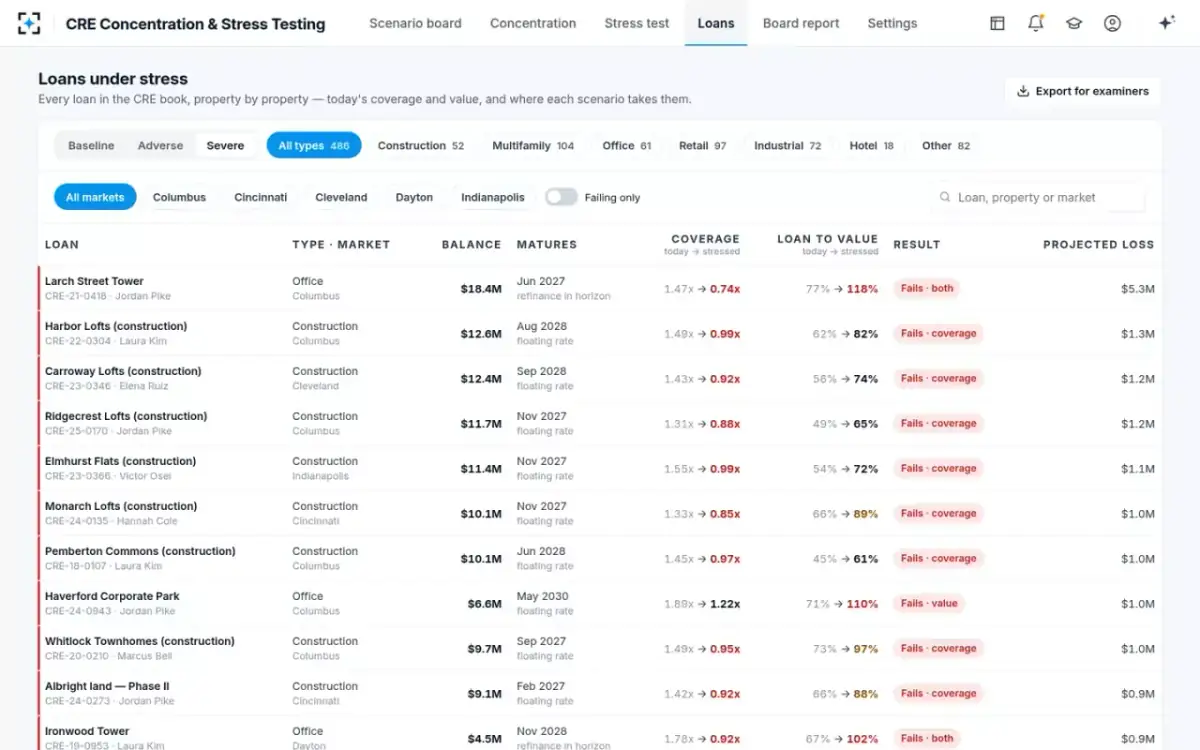
The denominator is a setting the bank controls, read from its call report. Where an older configuration still points at total risk-based capital, the fix is to point it at tier 1 capital plus the allowance on loans, and to restate the board's limits on the same basis, since a 350% limit on one denominator is not a 350% limit on the other.
Questions people ask
Does owner-occupied CRE count in the concentration ratio?
Not in the total CRE ratio. The OCC lists RC-C items 1.a, 1.d, 1.e.(2) and Memorandum item 3, leaving out item 1.e.(1), owner-occupied nonfarm nonresidential loans. Owner-occupied construction loans do count, because all of item 1.a is in.
What is tier 1 capital plus ACL?
It is tier 1 capital from call report schedule RC-R item 26 plus the allowance for credit losses attributed to loans and leases. Since March 31, 2020 the OCC, Federal Reserve and FDIC have used it as the denominator for every supervisory credit concentration ratio, under their joint statement in OCC Bulletin 2020-29.
Is 300% a regulatory limit on CRE lending?
No. The 2006 guidance calls the criteria "high-level indicators" and says they "do not constitute limits on an institution's lending activity." A bank above 300% is expected to show stronger risk management, including board-approved limits and stress testing; a bank below it is not automatically safe.
How many banks are above the CRE concentration thresholds?
The FDIC counted 1,374 banks, roughly 31% of all banks, as CRE-concentrated at year-end 2024, using total CRE above 300% or construction above 100% of tier 1 capital plus the allowance. That count ignores the 50% growth leg, so it is wider than the guidance's second criterion (FDIC 2025 Risk Review).
Are unfunded commitments included in the CRE concentration ratio?
The call report lines carry outstanding balances, and the FDIC's count of concentrated banks states that "unfunded commitments are not included." A board still needs the ratio with approved, unfunded construction loans added, because those draws will raise the ratio without any new approval.
How often should the ratio be calculated?
The guidance asks for concentrations to be reported to management and the board "on a periodic basis" and sets no frequency. Quarterly, with the call report, is the floor most banks use; a bank near a limit, or with a large construction pipeline drawing down, has reason to compute it monthly.