A scenario analysis Excel template works when the portfolio is small, the exposures are linear and one person owns the numbers: a sheet of factor shocks, a sheet of exposures, a multiplication and a comparison with limits. It stops working when the same scenario has to be versioned, challenged, priced with full revaluation across hundreds of portfolios and reported with a trail an examiner can follow. More to the point, a template speeds up the part of the work that was already the quickest. On the solution's own estimate, a new hypothetical scenario takes about 22 working days at a typical firm, and two thirds of them go on drafting the shocks, arguing their sizes and getting them approved, which no spreadsheet touches. Botminds' Stress Testing and Scenario Analysis prices the whole unit, the approved scenario, and is built to bring it to a day.
The worked example uses the solution's fictional sample firm, Quillfield Capital, and one of its funds, Global Balanced. The cost method is ours; no regulator or independent study publishes what a stress scenario costs to build, so the page shows how to measure it yourself.
Where a new scenario's working days go, and which ones a template can touch
By hand, about 22 working days
- Read the source and draft the shocks, 3 days · 14%
- Argue each shock size by email, 8 days · 36%
- Run and explain the drivers, 3 days · 14%
- Get the CRO's agreement, 4 days · 18%
- Build the committee page, 4 days · 18%
How to do scenario analysis in Excel
Build it as four sheets and keep them separate. Inputs hold the scenario: each factor shock, its size, horizon, source and the version number. Exposures hold each position's sensitivity to each factor: market value for equities and currencies, duration for rates, spread duration for credit. Calculation multiplies exposures by shocks and sums them by portfolio. Results compare each portfolio's loss with its limit. Excel's What-If tools, Scenario Manager and data tables, let one sheet hold several scenarios or vary one or two inputs across a range.
A scenario analysis Excel template: the sheets and the columns that make it auditable
| Sheet | Columns | What usually goes wrong |
|---|---|---|
| Inputs: the scenario | Factor, shock, units, horizon, source and page, version, date approved, approver | Shocks overwritten in place, so last quarter's scenario no longer exists |
| Exposures | Position, portfolio, market value, factor, sensitivity, as-of date | Positions pasted from two systems on different dates |
| Calculation | Exposure × shock per factor, summed by position and portfolio | Linear arithmetic applied to options and other non-linear instruments |
| Results | Loss in bp of NAV, limit, share of limit, top three drivers | Limits typed in, not linked to a register; nobody can see who changed one |
| Log | Who changed what, when and why | Usually missing altogether |
Scenario analysis Excel example: one fund, five shocks
For linear positions a template gives the right answer. In the sample, Global Balanced holds a short-yen forward overlay worth 9.0% of NAV; the scenario moves USD/JPY by −14%. Exposure times shock, 9.0% × 14%, is 1.26% of NAV: exactly the −126bp the risk engine reports. Its US large-cap equities, 14.7% of NAV, lose 4.5% in the scenario: −66bp, again matching.
The sample fund's loss: what a linear template reproduces and what it cannot
| Position | % of NAV | Shock | Template: exposure × shock | Full revaluation |
|---|---|---|---|---|
| USD/JPY forward overlay, short yen | 9.0% | USD/JPY −14% | −126bp | −126bp |
| US large-cap equities | 14.7% | Global equities −4.5% | −66bp | −66bp |
| Developed ex-Japan equity futures | 11.6% | Global equities −4.5% | −52bp | −52bp |
| JGB 20-year 1.1% 2046, yen-hedged | 2.9% | JGB yields +80 to +95bp | Needs duration and convexity | −41bp |
| Japan equities | 3.1% | TOPIX −16%, yen +14% | Needs the currency treatment | −13bp |
The template's trouble starts with the fourth line. A long-dated bond's loss depends on duration and convexity at today's yield; a yen-hedged position depends on how the hedge is booked; an option depends on volatility and time as well as price. In the sample's Global Macro Fund, a long USD/JPY call spread loses 198bp in the same scenario, a number no exposure-times-shock row can produce. A template that multiplies a delta by a 14% move will be wrong by an amount nobody sees, which is why stress tests that reach a board are better run on a risk engine with full revaluation.
What does one stress scenario cost to build?
Price it as the sum of people's days across five steps, plus the run, plus the rework when the scenario changes. No regulator or independent study publishes a figure; the closest public number is the SEC's 2020 estimate for a whole derivatives risk management program under Rule 18f-4, one-time costs of $150,000 to $500,000 per fund and ongoing costs of 65% to 75% of that a year, of which stress testing is one part (Rule 18f-4 adopting release). To measure your own, date the first email and the approval on your last three new scenarios and count who was involved on each day.
The cost of one approved scenario, written as a sum
Drafting
analyst days × day rate
Reading the source, often in another language, and setting each shock with a reason.
Market risk analyst
Arguing sizes
(analyst + reviewers) days × day rates
The largest block on the solution's estimate: eight of about 22 days.
Analyst, CRO, portfolio managers
Running and explaining
operations days + engine time
Pulling positions, fixing data, running, naming drivers for every portfolio.
Risk operations
Approval and the paper
CRO days + committee preparation days
Agreement, then rebuilding the numbers for the committee.
CRO, committee secretary
Rework is the hidden term. CESR's guidelines for UCITS ask that whenever the design of a stress test changes, the old and new versions be run side by side at least once and the results compared (CESR/10-788, explanatory text 70). A template has no versions, so every change means rebuilding both. The SEC anticipated the economics in its own release: once a fund has a stress testing framework in place, "subsequent stress tests could be automated and, as a result, be less costly" (Rule 18f-4 adopting release, footnote 209).
How long does it take to build a stress scenario?
About 22 working days end to end at a typical firm, on the solution's own estimate, and the calendar time is longer because the steps wait on each other. A template changes the three days of running and the four days of building the committee page; it does not change the eight days spent arguing sizes, which is where the time goes. In the sample firm the Japan scenario was drafted on 14 October, challenged on the night of 15 October and decided on 19 October, three days before the quarterly committee.
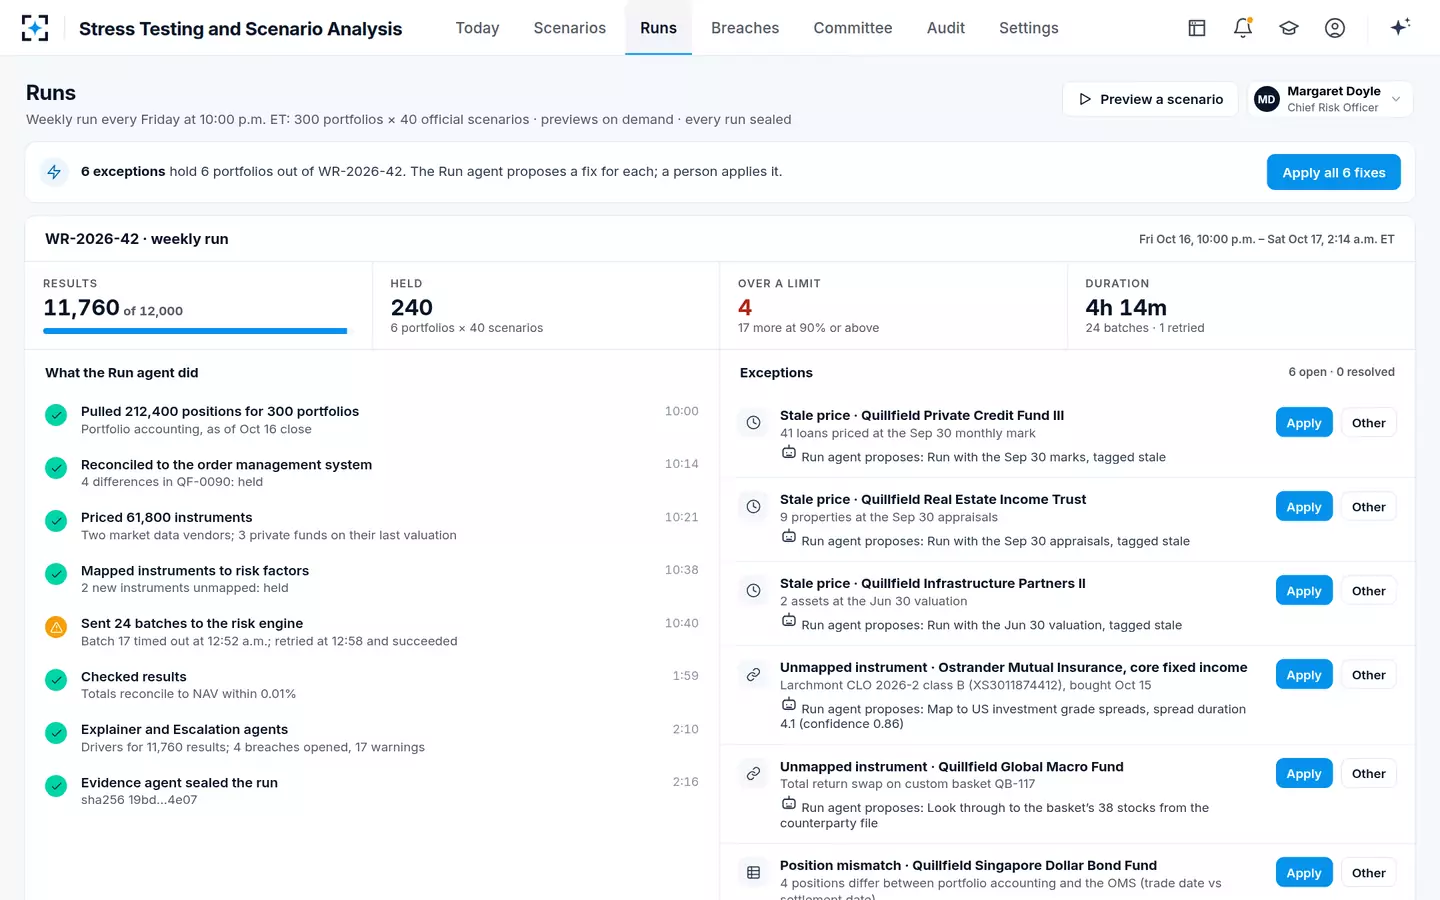
Stress Testing and Scenario Analysis: the weekly run a template would have to replace
What a template is genuinely good for
Three jobs, and it does them well. Prescribed sensitivities: a single-factor grid at sizes set by a rule, run quarterly on a stable book, is arithmetic a template handles cleanly. Sanity checks: a linear template beside the risk engine's output catches a mapping error quickly, because for forwards and cash equities the two should agree, as they do to the basis point for the sample fund's yen overlay. And teaching: a junior analyst who builds the exposure-times-shock sheet once understands what the engine is doing and where its answer will differ.
The mistake is to stretch it into the official process. Each extension, another portfolio, a second editor, an option book, a board report, adds a control the spreadsheet does not have and a person must supply by hand. A template used for checks alongside a governed run costs little; a template used as the governed run costs the rework, the trail and, eventually, the examiner's question nobody can answer.
Building the template so it survives an audit
If a template is the right tool for now, build it so its numbers can be proved later. Keep one file per approved scenario version and never edit an approved file; changes create a new version with a new date. Store the positions extract and the price file used with each run, not a link to a live source. Protect the calculation sheet, and keep inputs, exposures and results on separate sheets so a reviewer can see what changed. Add a sign-off sheet with the drafter, the reviewer, the approver and the date, and record why any shock was changed after review.
Those steps are what the rules' record-keeping assumes. CESR's guidelines for UCITS ask that completed stress tests and their results be clearly documented and the program's execution traceable, and Rule 18f-4 asks funds to keep stress test results for five years. A template built this way can meet them for a small book; it simply needs a person to do by discipline what a governed run does by design.
When does a spreadsheet stop being enough for stress testing?
When any of four things is true: the book holds options or other non-linear instruments; more than one person edits the numbers; the results go to a board, a committee or a regulator; or the firm runs more scenarios on more portfolios than one analyst can check by eye. A fund with a derivatives risk management program usually meets at least three: it holds derivatives, several people touch the numbers and the board receives the results.
The third deserves weight. In the SEC's Allianz order, the items the portfolio management team altered before sending them to investors included risk reports, daily performance data, "attribution spreadsheets" and "expected value ('EV') sheets" (SEC order 34-94927). An editable file is easy to change and hard to prove unchanged. The risk committee report sets out what a provable figure needs.
Keep the template if all of these are true
- One or a few portfolios, mostly linear
Cash equities, bonds over small moves, forwards: exposure times shock is close enough.
- One owner, one reviewer
Nobody else edits the file, and the reviewer signs a dated copy.
- Prescribed sizes
Single-factor sensitivities at sizes a rule sets, such as Form PF's market factor grid, leave little to argue about.
- No board or regulator reads the numbers directly
Internal what-ifs only.
- A handful of scenarios a year
Few enough that versions can be kept as separate, locked files.
Scenario analysis Excel template vs a governed run
The same scenario, built two ways
Excel template: Typed by the analyst; the source lives in an email.
Governed run in Stress Testing and Scenario Analysis: Drafted with a cited passage or window; challenged against daily history since 1990.
Excel template: Overwritten, or saved as file names.
Governed run in Stress Testing and Scenario Analysis: Each version kept; official results only from approved versions.
Excel template: Exposure × shock; options approximated.
Governed run in Stress Testing and Scenario Analysis: The firm's risk engine, full revaluation, every portfolio, every week.
Excel template: Pasted positions; stale marks invisible.
Governed run in Stress Testing and Scenario Analysis: Positions reconciled; stale marks flagged; portfolios held rather than priced on a guess.
Excel template: An email saying "fine".
Governed run in Stress Testing and Scenario Analysis: The CRO's decision with a reason code; the drafter cannot approve.
Excel template: Numbers pasted into slides.
Governed run in Stress Testing and Scenario Analysis: Drafted from signed runs; every figure opens its run, scenario version and date.
Where Stress Testing and Scenario Analysis fits, and where a template is enough
The solution earns its cost where scenarios are written and argued, books are non-linear and many people answer for the same numbers. Its agents draft each shock with a citation, challenge it against daily history, drive the firm's own risk engine across every portfolio, explain each loss by position and draft the committee papers from signed runs; people approve every scenario and decide every breach. It does not replace the risk engine, and it does not decide which events matter.
A template is enough for a firm with a single fund of linear exposures and a few prescribed sensitivities a quarter. Form PF's amended market factor grid, for example, prescribes each move, equities up and down 10% among them, and asks for each factor on its own (Form PF, amended form); a well-kept template can answer that. Portfolio stress testing software the committee will trust covers what to look for when a template is no longer enough.
Measure your own cost per scenario before you compare options
Take the last three new scenarios your firm approved and reconstruct each one's calendar: the date of the first email or note, the date shock sizes were settled, the date of the first full run, the approval date and the date the committee paper went out. Count who worked on each and for how many days. That gives you a cost per approved scenario in your own terms, and it shows which block dominates. If, as in the solution's estimate, arguing sizes is the largest, a faster engine or a better template will not move the total much.
The same three scenarios make the fairest trial of any alternative. Rebuild them, with the original sources, in whatever you are evaluating, and compare the days, the number of disputed shocks surfaced and whether every figure in the resulting paper can be traced to its run. In the solution, the design target for the whole path is one business day from a central bank statement to an approved scenario; a trial on your own scenarios is how to test that target against your reality.
Questions people ask
Is there a free scenario analysis Excel template?
A generic base, best and worst case template answers a different question, usually about a budget or a project. For portfolio stress testing, build your own from four sheets, inputs, exposures, calculation and results, plus a log, and keep each approved scenario as a locked version.
How do you run scenario analysis with multiple variables in Excel?
Put every factor shock for a scenario on one input sheet and let Scenario Manager switch between scenarios, or use a two-variable data table to vary two shocks across a grid. Beyond two variables, data tables stop helping and a scenario sheet per event is clearer.
Can Excel handle options in a stress test?
Only approximately. Exposure times shock ignores convexity, volatility and time, so it misstates options most in exactly the large moves a stress test is for. In the sample, a USD/JPY call spread loses 198bp in one scenario, a figure that needs full revaluation.
What does stress testing software cost compared with a template?
Vendors don't publish prices, so compare total cost: people's days per scenario, rework when scenarios change, and the cost of reconstructing a figure for an examiner. On the solution's estimate, 8 of about 22 days per new scenario go on arguing sizes, which software only shortens if it challenges shocks, not just runs them.
How many scenarios should a fund run?
Enough to move every factor its portfolios are exposed to, in combinations that are plausible. The sample firm keeps an official set of 40, adding a scenario only when it retires or replaces another, and runs all 40 on 300 portfolios each week.