Historical stress testing applies the market moves of a real crisis window, such as October 1987, the autumn of 2008 or March 2020, to the positions a fund holds today, and reports what the same moves would cost now. Its appeal is that nobody can call the scenario impossible: it happened. Its weakness is that a replay is only as good as three choices the analyst makes, which window, over what horizon, and how instruments that did not exist then are mapped onto factors that did. Botminds' Stress Testing and Scenario Analysis uses history in both directions: it replays official historical scenarios on every portfolio each week, and its Calibration agent tests every hypothetical shock against daily factor history from 1990, naming the window each one echoes and sending back the ones history cannot support.
The figures below are our own arithmetic on the Federal Reserve's daily data, and on the Bank of England's published accounts of 2022. The product examples come from the solution's fictional sample firm, Quillfield Capital.
How large the 10-year Treasury moved in stress windows, over ten trading days
What is historical stress testing?
Historical stress testing takes the factor moves observed over a past window, equity indices, yield curves, credit spreads, exchange rates, volatilities, and applies them to today's positions as if they happened again from today's starting point. It answers a simple question a committee understands: if 2008 happened to this book, what would we lose?
The simplicity is deceptive. The moves in the figure above depend on where the window starts and ends; a different ten days in the same month can halve them. Today's book holds instruments that did not exist in 1987 or 2008, so each needs a proxy. And the starting levels differ: a 100bp fall in the 10-year Treasury yield from 3.7% in late 2008 is not available from a yield of 0.5%, so the definition must say whether rate moves are replayed in basis points or in relative terms, and what happens near zero. Every one of those choices should be written into the scenario's definition, or the replay of the same window will not be the same replay next quarter.
Which historical scenarios should a fund test?
A fund should replay the windows that hit its own risks hardest, which is not the same list for every fund. An equity income fund cares about 1987 and 2008; a multi-asset fund with a yen funding overlay cares about October 1998 and August 2024; a long-duration bond fund cares about 2022. The windows below cover the main mechanisms; each teaches something different.
Six windows and what each one tests
| Window | What moved | What it tests in today's book |
|---|---|---|
| October 1987 | The Dow Jones Industrial Average fell 22.6% in one session, on 19 October. | Equity gap risk and option books: losses that arrive before anyone can rebalance. |
| October 1998 | The dollar fell 15.6% against the yen in ten trading days, the largest such move since 1990 in the Fed's data. | Carry and funding trades in a currency that can move against them all at once. |
| Autumn 2008 | The 10-year Treasury yield fell 100bp in ten trading days to 1 December, the largest ten-day fall since 1990. | Credit and liquidity together: correlated losses across sleeves that looked diversified. |
| March 2020 | Treasuries rallied, then sold off: the 10-year yield rose 64bp in seven trading days from 9 March while equities fell. | Safe-asset selling, margin calls and the failure of the usual hedge. |
| September 2022 | 30-year gilt yields rose 130bp in three trading days, three times any previous move over a similar period. | Leverage against long-dated rates, collateral calls and forced selling into the fall. |
| August 2024 | The dollar fell 11% against the yen from 10 July to 5 August; the 10-year Treasury fell 48bp in ten trading days. | A crowded carry trade unwinding, with equities and rates moving at the same time. |
Currency windows deserve the same attention as rate windows. In the Federal Reserve's H.10 data since 1990, a ten-trading-day fall of 5.1% in the dollar against the yen happens in about one window in a hundred; October 1998 saw 15.6%, October 2008 8.0%, March 2020 7.3% and August 2024 8.4% (Fed H.10, FRED DEXJPUS, our arithmetic). A fund that funds anything in yen should replay at least one of them.
What was the touchstone scenario in the Allianz case?
It was a replay of 1987, and it existed. The SEC's order describes the stress tests in Allianz Global Investors U.S.'s Structured Alpha risk reports as including "a -20% decline in the S&P 500 Index coupled with a +300% increase in implied volatility – the so-called 'touchstone' scenario – which mirrored the October 1987 market crash" (SEC order 34-94927, 2022). On 19 October 1987 the Dow Jones Industrial Average "dropped 22.6 percent in a single trading session, a loss that remains the largest one-day stock market decline in history," in the words of Federal Reserve History (Federal Reserve History).
The case is worth studying for what it says about historical scenarios, not only about fraud. A replay of 1987 that moves only the equity index tells an options book very little; the touchstone moved implied volatility too, which is what hurts a short-option strategy. The scenario was well designed. What failed, according to the order, was what happened to its results afterwards, which the risk committee report takes up. A good historical library is necessary, and it is not sufficient.
How do you scale a historical shock to today's portfolio?
You decide, and write down, four things: the horizon, the measure of change, the mapping and the starting point. Each changes the answer more than most committees realise.
The horizon is the easiest to get wrong. In March 2020 the 10-year Treasury yield fell from 1.56% on 19 February to 0.54% on 9 March, then rose to 1.18% by 18 March, 64bp in seven trading days, while equities were falling. A replay that measures ten-day changes ending on 23 March sees only a 22bp rise and misses the fact that the fund's hedge lost money in the same week as its equities. Choose the horizon from the portfolio, how fast it could reduce risk or meet a margin call, and replay the path, not just the endpoints, when the path is the story.
March 2020 in three numbers a single endpoint hides
−102bp
10-year Treasury, 19 February to 9 March 2020
Fed H.15, our arithmetic
+64bp
the same yield, 9 to 18 March, in seven trading days
Fed H.15, our arithmetic
$140B
peak daily variation margin called by clearing houses, 9 March 2020, from about $25B in February
BCBS-CPMI-IOSCO, 2022
The measure of change matters for rates near zero and for prices that have trended: an absolute basis-point move and a relative move give different shocks from today's level. The mapping matters for anything newer than the window: a private credit sleeve has no daily price history in 1998, so the analyst chooses a proxy, a high-yield spread or a loan index, and the choice should be on the record. And the starting point matters for options and anything with a barrier: replaying 2008's volatility on a book whose options are near the money today is not the same event as it was then.
History's largest move is not a ceiling: what September 2022 showed
A stress set calibrated to the largest move on record would have missed September 2022. The Bank of England's account to Parliament is precise about it:
That period saw two daily increases in 30 year gilt yields of more than 35 basis points. The biggest daily increase before last week in the data that goes back to 2000 was 29 basis points. Measured over a four day period, the increase in 30 year gilt yields was more than twice as large as the largest move since 2000.
Sir Jon Cunliffe, Bank of England, letter to the Treasury Committee, 5 October 2022
The Bank's later account puts the move at 130 basis points in three trading days by 28 September, "a move three times larger than any other historical move over a similar period" (Bank of England Quarterly Bulletin, 2023), and between 1 August and 14 October the 30-year gilt yield rose by more than 270 basis points (Financial Stability Report, December 2022). The previous record holder was March 2020's dash for cash. A scenario capped at that record would have been less than half the size of what happened two and a half years later.
The lesson for a fund's scenario rules is direct. "What is a 1-in-100 shock?" has a clean statistical answer, a move that one window in a hundred reaches, which for the 10-year Treasury over ten days since 1990 is a 44bp rise. But a rule that blocks any shock beyond the historical record treats the record as a law of nature. History tells you how rare a move has been; it cannot tell you the next one will be smaller.
Correlations break in the windows you replay
Historical windows are valuable precisely because relationships fail in them. CESR's guidelines for UCITS using value at risk told funds to "take into account the breakdown of common relationships and standards. For instance, correlations can heavily change due to stress situations" (CESR/10-788, explanatory text 68). A replay captures the breakdown that actually happened, which a correlation matrix estimated in calm markets cannot.
March 2020 is the standard example. The Financial Stability Board's review found that "the flight to safety behaviour morphed into broad-based selling in mid-March, when even the safest and most highly liquid assets such as government bonds experienced large price declines" (FSB, Holistic Review of the March Market Turmoil, November 2020). For a balanced fund, that is the week the bond sleeve stopped hedging the equity sleeve. Replaying the full window, rather than the worst day for equities, keeps that in the test.
Historical vs hypothetical stress scenarios: borrowing sizes from history
The two are complements. A hypothetical scenario describes an event that has not happened, but its shocks should still be sized against windows that have; a historical replay is plausible by construction, but it describes only the past. The best hypothetical scenarios combine windows deliberately and say so.
The Bank of England's system-wide exploratory scenario shows the technique. Its ten-day shock moved gilt yields by 115 basis points, "slightly less than the equivalent cumulative moves seen during the 2022 LDI episode," and sterling corporate bond spreads by 130 basis points, roughly equal to the cumulative moves of the 2020 dash for cash, while "not all market indicators are stressed to historical peaks, eg equities" (Bank of England, SWES final report, November 2024). Two windows, combined into one event that never happened, each size defended by its source. Scenario analysis vs stress testing sets out where that design work ends and the pricing begins.
A historical replay you can defend: what to write into its definition
- The window, start and end date
And why those dates: the peak-to-trough, the worst ten days, or the full episode.
- The horizon and whether the path matters
A ten-day endpoint, or the daily path where the hedge failed mid-window, as in March 2020.
- Absolute or relative changes, factor by factor
Especially for rates near zero, volatilities and anything that has trended since.
- The proxy for every instrument the window lacks
Named per asset class, so the same replay next quarter uses the same proxies.
- How private and stale marks are treated
A replay on a private credit sleeve priced at last quarter's mark is a replay on a guess.
- The rarity of each move, measured the same way every time
The share of windows since a fixed date that reached it, with the overlap caveat stated.
Replaying history in Stress Testing and Scenario Analysis
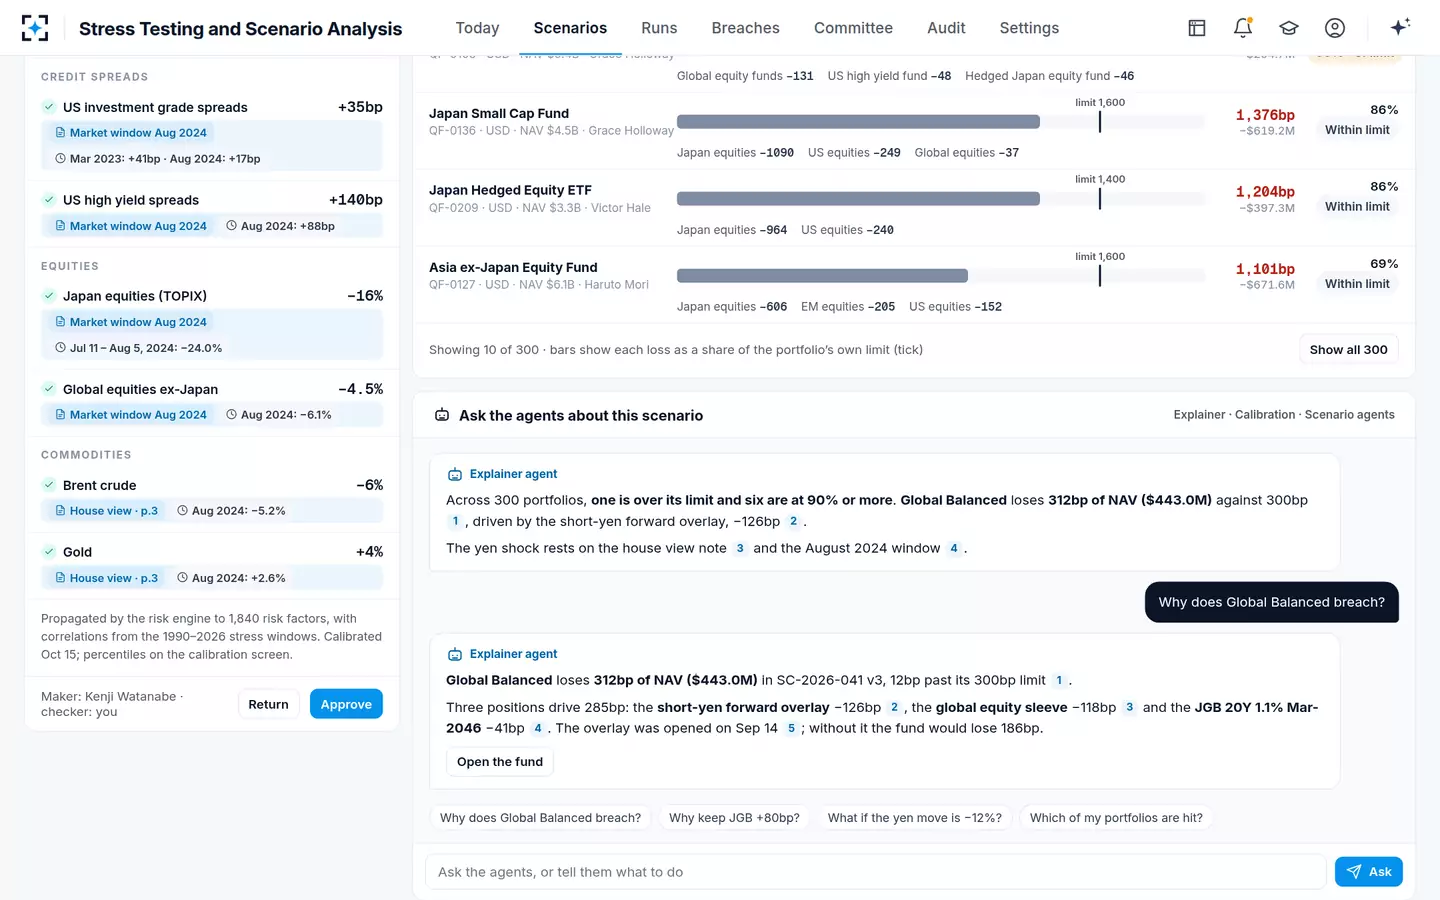
In the solution, historical windows play two roles. Historical scenarios sit in the official set and run every week on every portfolio like any other. And every hypothetical shock is checked against daily factor history from 1990, scaled to the scenario's horizon, with its nearest analog windows named, so the committee sees what each shock echoes. In the sample firm's Japan scenario, the yen shock cites the 2024 carry-trade unwind, and the US Treasury shock was sent back because its direction contradicted the scenario's own story.
Stress Testing and Scenario Analysis: every shock beside the window it echoes
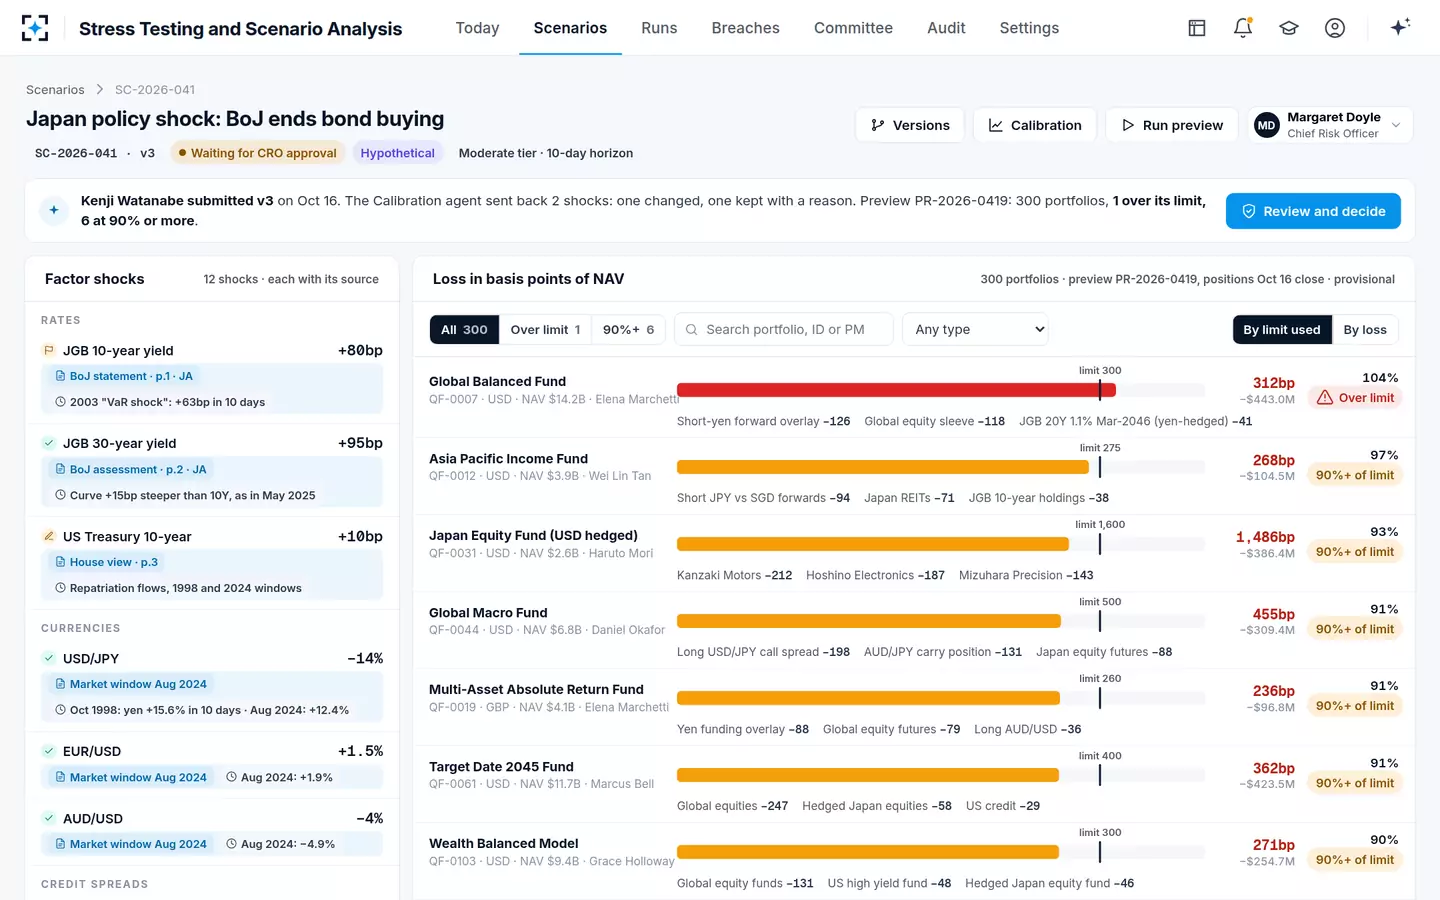
The sample firm's rules ask for a written reason for any shock rarer than 1-in-100 and block anything rarer than 1-in-500. Those are settings, not facts of nature, and September 2022 is the argument for treating them with care: a block calibrated only to past windows would have refused a shock the gilt market then delivered. A firm adopting such a rule should decide in advance how a scenario beyond the record gets in, with whose approval and on what evidence. The solution records the reason and the approver either way.
Asking why a shock was kept, and getting the answer cited
Questions people ask
What is the difference between historical and hypothetical stress testing?
A historical stress test replays moves that happened in a real window, such as March 2020; a hypothetical test describes an event that has not happened. Hypothetical scenarios usually borrow their sizes from historical windows, as the Bank of England's 2024 system-wide scenario did with the 2022 gilt episode and the 2020 dash for cash.
How far back should historical data go?
Far enough to include the windows that would hurt your portfolio. Daily data from 1990 covers 1998, 2001, 2008, 2020, 2022 and 2024 for rates and currencies. For value at risk the rules differ: Rule 18f-4 asks for at least three years of data and CESR's guidelines at least one, which is why VaR can miss what a historical replay catches.
What is a 1-in-100 shock?
A move that one window in a hundred reaches in the history you measure it against. For the 10-year Treasury over ten trading days since 1990, that is a 44bp rise on our arithmetic; the largest was 82bp. Because rolling windows overlap, the count measures rarity, not probability.
How did the 2022 gilt crisis break historical stress tests?
It exceeded the record. The Bank of England reported two daily rises in 30-year gilt yields of more than 35 basis points, against a previous daily maximum of 29 since 2000, and a four-day rise more than twice the previous record. Scenarios capped at history would have been too small.
Is the 1987 crash still a useful scenario?
Yes, for equity gap risk and for option books, provided implied volatility moves too. The scenario in the Allianz case combined a 20% fall in the S&P 500 with a 300% rise in implied volatility, which is what made it relevant to a short-option strategy.