A data migration reconciliation report compares what left the old system with what arrived in the new one: counts, sums of key amounts, and the items that do not match. For an insurance policy conversion, a useful example has three layers. It ties the policy count, it ties written premium and every coverage limit, and it lists every policy that differs with the cause. The third layer is the one most reports leave out, and it is the one that matters: a wave can tie out in total while hundreds of policies are wrong, because the rises and the falls cancel. The example below comes from a fictional sample conversion run through Botminds' Policy Data Conversion, which re-rates every converted policy and traces each difference to its source before anyone signs.
The net difference understates the error on this wave by more than half
What is reconciliation in data migration?
Reconciliation in data migration is the proof that the target holds what the source held: nothing lost, nothing added, nothing changed in meaning. It is usually done at three levels. A count shows completeness. A sum of key fields, a control total, shows that amounts survived in aggregate. A field-by-field comparison of each item shows that each one survived. Most reports stop at the second level.
Insurance regulators use control totals themselves. When examiners load a company's data into their own audit software, the NAIC handbook tells them that "the totals of those key fields should be calculated to ensure there is a complete data conversion", and that if the totals disagree "the examiner and company must determine the cause of the discrepancy" (NAIC Market Regulation Handbook, 2017, chapter 11). The same chapter is careful about what totals prove: examiners "may want to test a sampling of paper files against electronic files to ensure the electronic files are maintained in an accurate and complete manner." Totals show the load was complete. Only the files show it was accurate.
A data migration reconciliation report example, measure by measure
Take the sample conversion: Larkhaven Mutual, a fictional insurer, is moving 214,860 in-force policies off its legacy mainframe one wave of renewals at a time. Wave 3 is 18,412 homeowners policies in Iowa and Nebraska. After test load 3 and one approved fix, the wave reconciliation reads as follows.
Wave 3 tie-out: the measures a conversion reconciliation report should carry
| Measure | Legacy system | New system | Result |
|---|---|---|---|
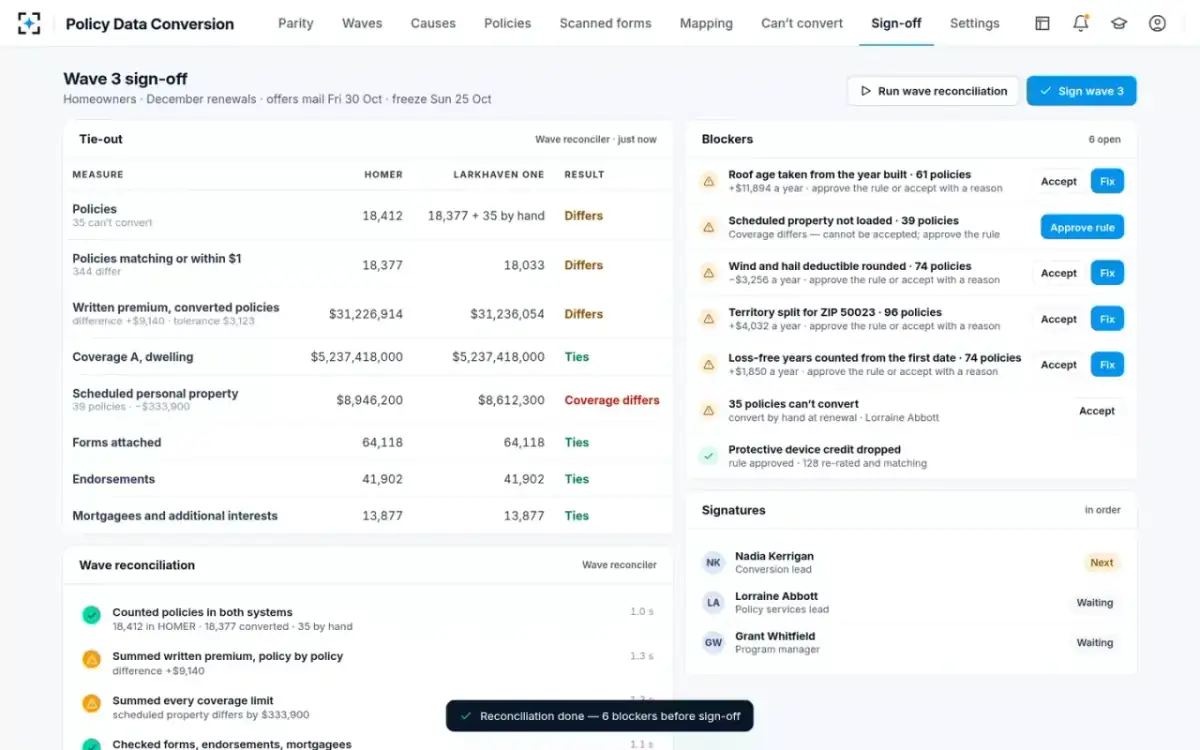
| Policies | 18,412 | 18,377 converted + 35 to convert by hand | Differs: 35 cannot convert yet |
| Policies matching to the cent or within $1 | 18,377 compared | 18,033 | Differs: 344 policies |
| Written premium, converted policies | $31,226,914 | $31,236,054 | Differs: +$9,140 against a $3,123 tolerance |
| Coverage A, dwelling | $5,237,418,000 | $5,237,418,000 | Ties |
| Scheduled personal property | $8,946,200 | $8,612,300 | Coverage differs: −$333,900 on 39 policies |
| Forms attached | 64,118 | 64,118 | Ties |
| Endorsements | 41,902 | 41,902 | Ties |
| Mortgagees and additional interests | 13,877 | 13,877 | Ties |
Read the table the way a signer should. Coverage A ties to the dollar, forms and endorsements tie by count, and a batch-level report could stop there with a premium difference of $9,140 on $31.2 million, about three hundredths of one percent. Yet 344 policies still differ, and 39 customers have lost scheduled coverage for jewelry, furs and fine art. Neither shows up in a total.
A reconciliation that lists its blockers, not just its totals
Why a wave that ties out in total can still be wrong
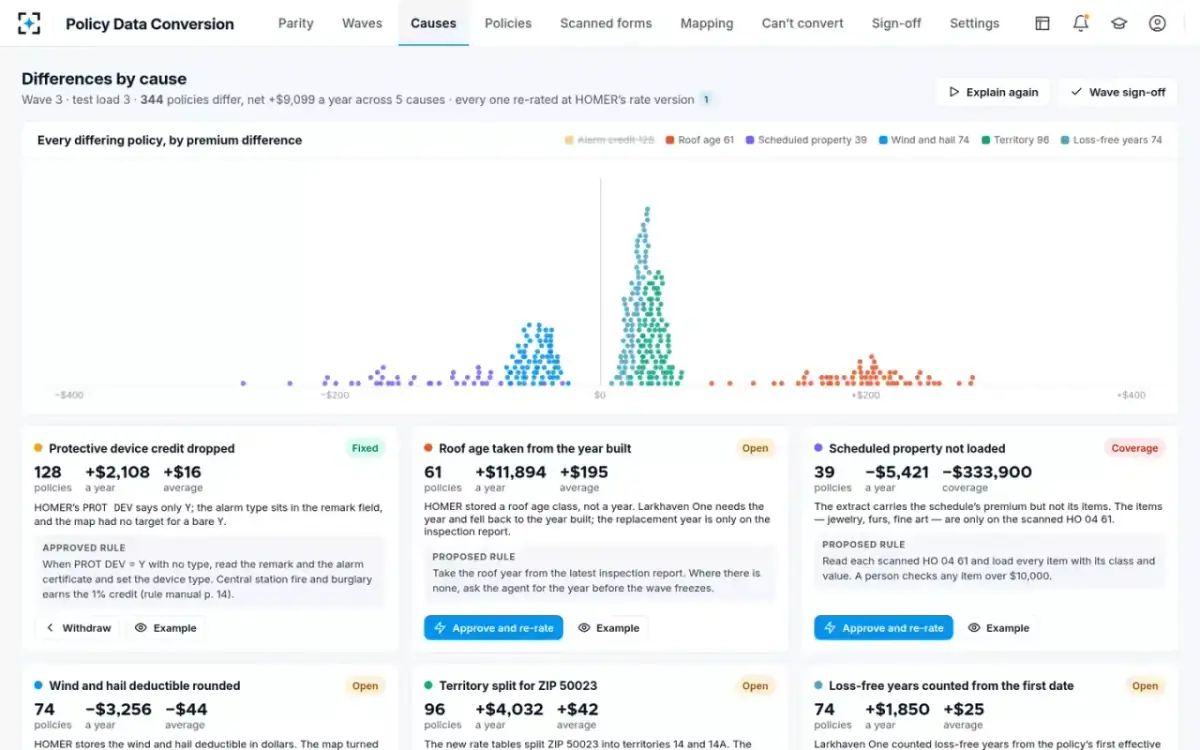
Because conversion errors push premiums in both directions, and a total adds them together. In the sample wave, a roof age taken from the year the house was built raised 61 premiums by $11,894 a year. A wind and hail deductible stored in dollars and rounded to a whole percentage lowered 74 premiums by $3,256. Scheduled jewelry that never loaded lowered 39 premiums by $5,421. Before the first fix, the six causes netted to +$11,207, while the policies that rose and the policies that fell moved at least $28,561 between them.
Nothing stops the netting from reaching zero. Move one cause's size a little and a wave with 472 wrong policies reports a perfect premium tie. That is why a premium total, however small its variance, cannot be the acceptance test for a conversion: it measures the balance of the errors, not their size.
The 472 policies that differed, by cause
Wave 3 at test load 3
- Alarm credit dropped · 27%
- Territory split · 20%
- Deductible rounded · 16%
- Loss-free years · 16%
- Roof age · 13%
- Schedule not loaded · 8%
Count, sum, compare: three levels of reconciliation
Each level answers a different question, and a report should say which levels it covers. Countanswers whether every policy arrived; in the sample it shows 35 that could not convert. Sumanswers whether amounts survived in aggregate: written premium, every coverage limit, schedules, deductibles.Compare answers whether each policy is the same policy: same coverage, same forms, and the same premium when re-rated at the rate version the legacy system used.
What each kind of reconciliation sees on the same wave
Batch-level reconciliation: Policies, forms and endorsements loaded.
Policy-by-policy reconciliation: The same, plus every policy re-rated and compared field by field and rating step by step.
Batch-level reconciliation: Adds $2,108 to a $31 million total: inside the sample’s own $3,123 wave tolerance.
Policy-by-policy reconciliation: Found on step 6 of each policy, traced to a bare Y and a remark, fixed by one rule.
Batch-level reconciliation: Invisible if the schedule premium was carried; forms count ties.
Policy-by-policy reconciliation: Found as a coverage difference on each of 39 policies, $333,900 in all.
Batch-level reconciliation: Mixed in with conversion errors.
Policy-by-policy reconciliation: Excluded: both sides rated at the legacy rate version.
Batch-level reconciliation: A variance and a tolerance.
Policy-by-policy reconciliation: A list of every differing policy, its cause, its evidence and its owner.
Data migration reconciliation techniques that find what totals miss
Four techniques find the errors a total cannot: re-rating each policy, comparing step by step, tracing in both directions, and grouping by cause. The first two are specific to insurance; the last two are standard audit practice applied to a policy file.
Re-rate every converted policy at the legacy rate version. The new system's premium for the current term, at the same rate version, should equal the legacy premium; any difference is the conversion.Compare rating step by step. A homeowners premium in the sample is built in 11 steps; a difference on step 6, the protective device credit, points straight at one field. Trace both ways. GAO's guide to data reliability describes it: "tracing from source documents to the database can help identify any gaps", while tracing from the database back to source documents finds values entered incorrectly (GAO-20-283G, Assessing Data Reliability). In a conversion the gaps are items on scanned schedules that never reached the extract; the wrong values are defaults the map filled in.Group differences by cause. Policies that differ for the same reason should be fixed by one rule and re-rated together, so the report shrinks by cause rather than by policy.
GAO's guide also lists the routine data tests a reconciliation should run before any of this: "checking total number of records provided against agency totals", testing for missing records and missing values in key data elements, duplicates, invalid identifiers, values out of range and dates "outside valid time periods or in an illogical progression". Those catch broken extracts. They do not catch a plausible wrong value, which is what most conversion errors are.
Rises on one side, falls on the other: the shape a total hides
Coverage never shows up in a premium total
A coverage difference can leave premium untouched, or move it by less than the tolerance, while the customer loses the thing they bought. In the sample, Teresa Villanueva's scheduled personal property endorsement listed four jewelry items worth $18,400. The extract carried the schedule's $202.40 premium but not its items, so the new system held no items at all. The same was true on 39 policies, $333,900 of scheduled property. A claim for a stolen ring would have found nothing scheduled.
So a reconciliation report needs coverage measures that are compared by value, not counted: every limit, every scheduled item, every deductible, every mortgagee and additional interest. And it needs a rule that coverage differences cannot be accepted with a reason; they can only be fixed. How such a gap turns into a notice the insurer never planned to send is covered in data migration risks and mitigation.
Data conversion reconciliation tolerances: what to accept and what never to
Set three tolerances and write them down before the first test load: one per policy, one per wave and one for coverage. The sample conversion uses $1.00 per policy, counted as rounding; 0.01% of written premium for the wave at sign-off; and no tolerance at all on coverage. Anything outside a tolerance is either fixed by a rule or accepted with a written reason and an owner.
The size of the per-policy tolerance should reflect how the result will be judged. State examiners sample files and count errors against a tolerance of their own: North Carolina, for example, has applied "a 0 percent tolerance level for the use of forms and rates/rules that were neither filed with nor approved by the Department and 5 percent for all other areas reviewed" (North Carolina Department of Insurance exam report, 2017). A policy rated on an unfiled basis because of a conversion default is the zero-tolerance kind.
Why nobody downstream will catch it
The people who use the converted data next are not set up to find conversion errors. Actuaries work under a professional standard that asks them to review data for reasonableness, but defines a review as "an examination of the obvious characteristics of data", warns that such a review can miss defects, and expressly stops short of requiring an audit (Actuarial Standard of Practice No. 23, Data Quality; the standard is read in full in ASOP 23 data quality). A 1% credit missing from 128 of 18,412 policies is not an obvious characteristic.
Underwriters see the converted policy at the next renewal, policy services when the customer calls, examiners when they sample. Each of those finds errors one at a time, after they have reached a customer. The conversion's own reconciliation is the only point at which every policy is compared before anyone is affected.
Data migration validation best practices: a checklist
The checklist below turns the techniques above into checks a reconciliation report should show it has passed. It applies whether the comparison is done by people, by scripts or by agents.
Data migration validation checklist for a policy conversion wave
- Count every policy both ways
Legacy to new and new to legacy. Every policy that did not convert has a reason and an owner.
- Run the routine data tests first
Missing values, duplicates, invalid codes, out-of-range values and illogical dates in the extract.
- Tie written premium and every coverage
Coverage A through scheduled items, deductibles, forms, endorsements and mortgagees, by value, not only by count.
- Re-rate every policy at the legacy rate version
Never compare a converted premium with a legacy premium rated on a different version.
- Compare each rating step
So a difference points to one field, not to a total.
- Trace from the scans to the new system
Schedules, certificates and endorsements that exist only on paper are where gaps hide.
- Group differences by cause
Fix each cause with one approved rule; re-rate every policy it touches.
- Report gross as well as net
Premium added and premium lost, side by side, so netting cannot hide a cause.
- Block on coverage
A coverage difference is fixed, never accepted with a reason.
- Sign in order, with the trail attached
Each rule, its approver and the re-rate results per test load travel with the report.
Who signs the data migration reconciliation report, and what each signature means
Three people sign, each for something different. In the sample conversion the conversion lead signs first, for the comparison itself: every policy compared, every cause ruled on. The policy services lead signs second, for the customer side: the policies that cannot convert, and the renewal offers that will go out on the converted data. The program manager signs last, for the tie-out as a whole, and only when every policy ties out or each open item is accepted with a reason.
The roles behind those signatures are described in every seat on a policy conversion, and where the report sits on the wave's calendar is set out in the data migration plan template.
Questions people ask
What should a data migration reconciliation report include?
Counts in both directions, control totals for every key amount, and a list of every item that differs with its cause, owner and status. For a policy conversion add every coverage measure by value and a per-policy re-rate result. In the sample wave that list was 472 policies across six causes at test load 3.
What tolerance is acceptable in a conversion reconciliation?
It depends on the measure. Rounding differences of a dollar or so per policy are normal when systems round differently; a wave tolerance should be a small share of written premium, such as the 0.01% in the sample. On coverage the right tolerance is none.
What is a control total in data migration?
A control total is the sum of a key field, such as written premium or Coverage A, calculated in the source and again in the target. The NAIC handbook tells examiners to compare such totals when they load company data, to confirm a complete conversion; it proves completeness in aggregate, not that each item is right.
How long does a reconciliation take on a conversion wave?
By hand, most of a cycle. Botminds estimates five working days to reconcile premium and coverage and five more to trace differences to their causes, out of 22 for one convert, load and compare cycle on one wave. With agents comparing every policy, those ten days become about one and a half.
Can data migration reconciliation be automated?
The comparing can; the accepting cannot. Re-rating, step-by-step comparison, tracing and grouping by cause are mechanical once the rules are written. Deciding whether a cause is fixed or accepted, and signing the wave, are judgments that belong to named people.