An allowance for credit losses rollforward is the schedule that takes the allowance from its opening balance to its closing one through the period's activity — provisions, charge-offs, recoveries and anything else that moved it. It exists in two forms that are easy to confuse: a disclosure with prescribed lines, which a reader of the financial statements is entitled to, and a management bridge with as many lines as the bank needs to explain itself, which is what a committee and a controller actually argue over. Both have to end at the same number, and the second has to tie to the segment schedule beneath it. CECL Allowance Management is Botminds' solution for the quarterly close, and the bridge is where it shows its arithmetic: every component of the change, and an unexplained difference line that is allowed to be something other than zero.
The product figures come from a fictional sample bank running through the solution: Ashgrove Plains Bank, $3,618.4 million of loans, third quarter of 2026. The bank and its people are invented and their numbers are sample data, not a customer's measured result. The industry figures beside them are the FDIC's, and the difference between the two kinds of number is marked wherever they appear together.
The industry's own roll-forward, second quarter of 2026
$223.9B
reserve balances across insured institutions, down $153.5 million or 0.1% in the quarter
172.7%
reserve coverage ratio: the allowance against noncurrent loans
145.6%
the same ratio at community banks, down 73 basis points in the quarter
What is an allowance for credit losses rollforward?
It is the activity in the allowance account over a period, set out so that a reader can see what changed it. The accounting standard frames it as a comprehension requirement rather than a form: "to enable a financial statement user to understand the activity in the allowance for credit losses for each period, an entity shall separately provide by portfolio segment and major security type the quantitative disclosures of the activity in the allowance" (FASB Accounting Standards Update 2016-13). Two words there do more work than the list that follows. Separately, by portfolio segment: one consolidated roll-forward does not satisfy it. Understand: the schedule exists to be read, not only to be footed.
What it is not is an explanation. A roll-forward that shows a provision of $3,911 thousand tells a reader the provision was $3,911 thousand. Why the allowance moved — which segments, which drivers, how much was judgement — is a different schedule, and conflating the two is how a committee ends up discussing a disclosure instead of a decision.
What goes in the allowance rollforward disclosure?
Six lines, by portfolio segment: the beginning balance; the current-period provision for expected credit losses; the initial allowance recognised on purchased financial assets with credit deterioration, if applicable; write-offs charged against the allowance; recoveries of amounts previously written off, if applicable; and the ending balance. Two of the six are conditional, which is why many banks' disclosures show four lines and are complete.
The conditional lines are worth a moment. The purchased-assets line appears only where the bank has acquired assets that had already deteriorated — after an acquisition, typically — and it is an allowance recognised on acquisition rather than a provision through earnings, so burying it inside the provision line misstates both. The recoveries line is separated from write-offs for a reason too: a bank with large gross charge-offs and large recoveries looks very different from one with small net charge-offs, and netting them hides the difference.
The same movement, twice: the disclosure and the management bridge
The management bridge answers a question the disclosure does not ask: what, specifically, moved the number? It has as many components as the bank needs, and its components are causes rather than account entries. At the sample bank the quarter's bridge has six movement bars between two balances, and only one of them — net charge-offs — corresponds to a line of the disclosure.
One quarter's bridge: $44,812K at 30 June to $47,509K at 30 September
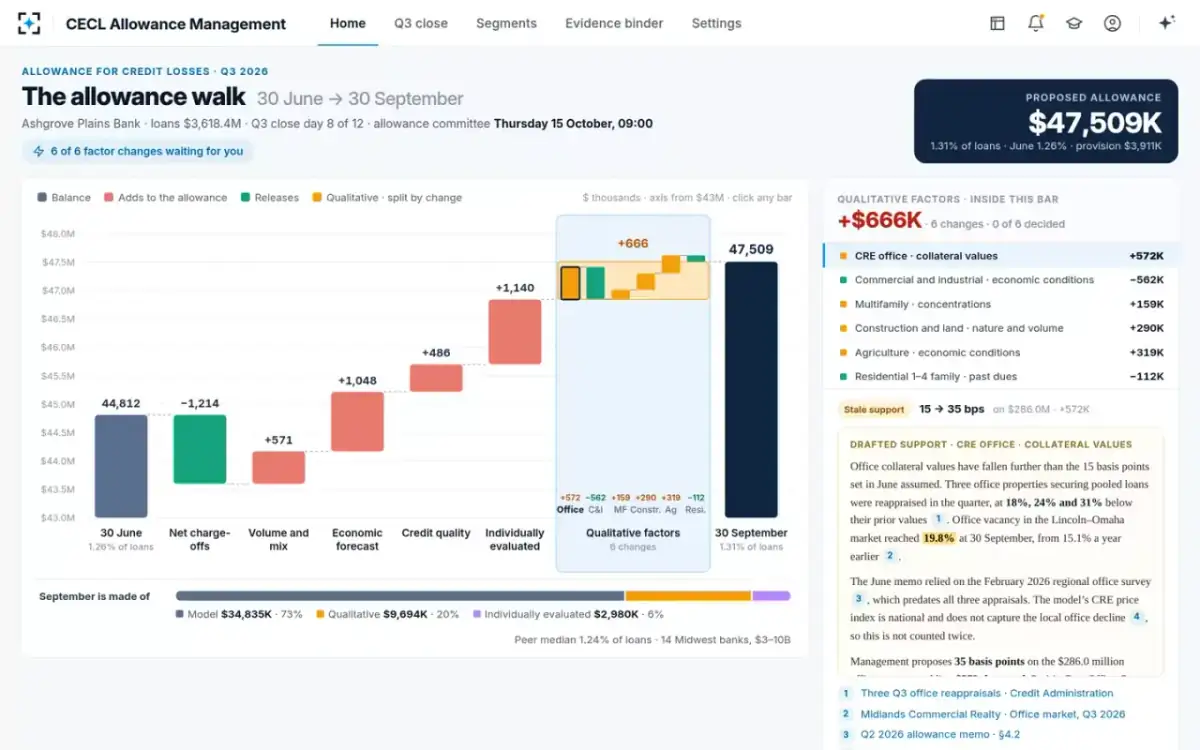
Each bar is a different kind of claim. Volume and mix is arithmetic: balances changed, the modelled rates did not. The economic forecast bar is the model's output under a new vintage. Credit quality is grade and delinquency migration inside the model. Individually evaluated is a handful of named loans with their own appraisals. Qualitative factors is the only bar that is wholly judgement, which is why it is the one a committee spends its time on and the one examiners question most.
Where each movement lands: the disclosure, the Call Report and the bridge
| The movement | In the disclosure (ASC 326-20-50-13) | In the Call Report (Schedule RI-B, Part II) | In the management bridge |
|---|---|---|---|
| Opening balance | a. The beginning balance in the allowance | Item 1, the balance most recently reported for the 31 December report — the schedule is year to date | Allowance at 30 June, with last quarter’s ratio beside it |
| Provision | b. Current-period provision for expected credit losses | Item 5, provisions for credit losses | Not a bar: the provision is what the bridge produces, not what moves it |
| Write-offs | d. Writeoffs charged against the allowance | Item 3, charge-offs, and item 4, write-downs arising from transfers of financial assets | Folded into one net charge-offs bar, with gross figures in the segment schedule |
| Recoveries | e. Recoveries of amounts previously written off, if applicable | Item 2, recoveries | Folded into the same net bar |
| Acquired credit-deteriorated assets | c. The initial allowance on purchased financial assets with credit deterioration, if applicable | Reported within item 6, adjustments, where it does not fit items 2 to 5 | Its own bar when it occurs, so it is never read as a provision |
| Everything else that moved the estimate | Not separately disclosed — it is inside the provision | Inside item 5, provisions — the Call Report does not split it either | Five bars: volume and mix, economic forecast, credit quality, individually evaluated loans and qualitative factors |
| Closing balance | f. The ending balance in the allowance | Item 7, which must equal the allowance reported in Schedule RC, item 4.c | Allowance at 30 September, with the unexplained difference stated |
How do you tie the allowance rollforward to the Call Report?
Through three instructions, each of which catches a different reconciliation error. The first sets the shape: "Institutions should report reconcilements of the allowances for credit losses on loans and leases held for investment, held-to-maturity debt securities, and available-for-sale debt securities in columns A, B, and C, respectively" (FFIEC 031 and 041 instructions, Schedule RI-B). Three columns, three allowances. A bank whose internal roll-forward covers only loans has one column of three.
The second is the footing rule, and it is also the tie-out to the balance sheet: "Balance end of current period. Report in columns A, B, and C the sum of items 1, 2, 5, and 6, less items 3 and 4. The amount reported in column A for this item must equal the allowance amount reported in Schedule RC, item 4.c." If the roll-forward's closing figure and the balance sheet disagree, the Call Report will not pass its own edit, which is the cheapest place to find the problem.
The third is the one that absorbs everything the first two do not cover, and the one to watch.
“Adjustments. Report all activity in the allowances for credit losses, as applicable, that cannot be properly reported in Schedule RI-B, Part II, items 2 through 5, above.”
FFIEC 031 and 041 Call Report instructions, Schedule RI-B
Adjustments is a legitimate line with legitimate contents — an initial allowance on acquired credit-deteriorated assets, the effect of a business combination, the allocated transfer risk reserve for the banks that must maintain one. It is also where a reconciliation that was never finished tends to come to rest. A material adjustments figure that the allowance memo does not explain is an open question in every subsequent examination, and the question gets harder to answer as the quarters pass.
One timing difference trips up almost everybody once. Schedule RI-B Part II is calendar year to date, starting from the balance last reported for 31 December, while the management bridge and the quarterly disclosure run from the start of the quarter. A September roll-forward that ties quarter to quarter and a September Call Report that runs from January are both right and will not agree line for line; reconciling them means adding the three quarters, not comparing one.
What is an unexplained difference, and why show one?
It is the gap between the bridge's components and the actual movement in the allowance — the amount the bank's explanation does not account for. Most management bridges do not have this line, because the last component is calculated as whatever makes the schedule foot. That is not a bridge; it is a subtraction with labels on it.
Showing the difference changes what the schedule is for. A bridge built from the segment schedule, in which each component is computed independently and the residual is printed, is a test the bank can fail. In the sample quarter the residual is zero and the screen says so: the bridge ties to the segment schedule with an unexplained difference of $0, an allowance of $47,509 thousand, a change of +$2,697 thousand and a provision of $3,911 thousand. The zero is informative precisely because a non-zero was possible.
The quarter's bridge, with the residual printed rather than absorbed
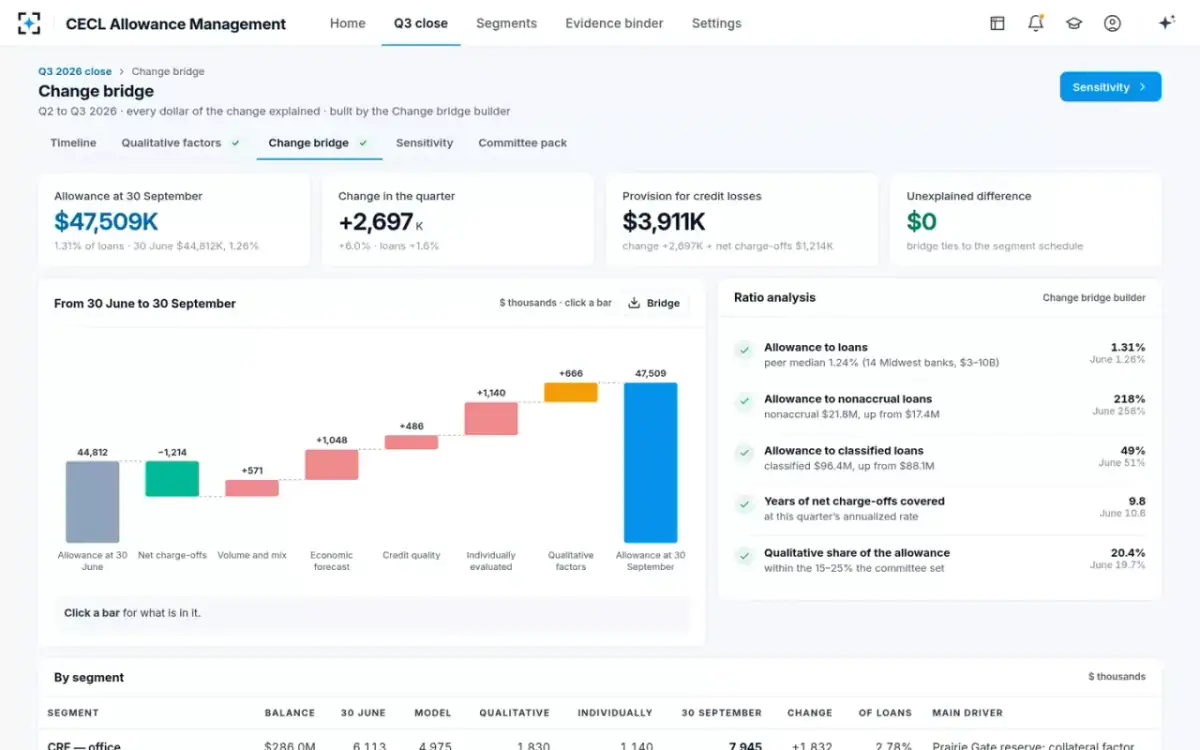
Reading the bridge: which bars are arithmetic and which are judgement
A committee that treats all six bars alike spends its time on the wrong ones. Two are effectively mechanical: volume and mix moves with balances the bank cannot restate, and net charge-offs is history. Two are model output: the economic forecast bar and the credit quality bar move with the vintage and the migration data, and the questions about them are questions about the model, which belong to its independent review rather than to the quarterly close.
The two that are genuinely decided in the quarter are individually evaluated loans and qualitative factors — $1,140 thousand and $666 thousand of a $2,697 thousand movement at the sample bank, or two-thirds of it. Both are decisions by a named person, both rest on documents with dates, and both can be re-performed by anyone who asks. Those are the bars to put the time into, and the memo should say which is which rather than presenting six equal columns.
What the closing allowance is made of
Allowance at 30 September, $47,509K
- Model, $34,835K · 73%
- Qualitative factors, $9,694K · 20%
- Individually evaluated, $2,980K · 6%
What is a good reserve coverage ratio?
There is no target, and the first useful thing to say about coverage is that it moves for two reasons which look identical on a chart. The FDIC's industry figure for the second quarter of 2026 rose to 172.7%, and the Quarterly Banking Profile explains why: reserves were essentially flat at $223.9 billion while noncurrent loans fell $4.7 billion, or 3.5%. Coverage improved because the denominator shrank. At community banks over the same quarter the ratio fell 73 basis points to 145.6%, as the allowance grew more slowly than noncurrent balances.
The same arithmetic runs at a single bank. Coverage at the sample bank fell from 258% to 218% while the allowance rose — because nonaccrual balances rose faster, from $17.4 million to $21.8 million. A bridge that reports the ratio without the two balances behind it invites a board to read a strengthening allowance as a weakening one.
Five ratios, and the balance behind each one
Allowance to loans
Q31.31%
Q21.26%
What movedPeer median 1.24% — 14 Midwest banks of $3–10bn
Allowance to nonaccrual loans
Q3218%
Q2258%
What movedNonaccrual balances rose from $17.4M to $21.8M
Allowance to classified loans
Q349%
Q251%
What movedClassified balances rose from $88.1M to $96.4M
Years of net charge-offs covered
Q39.8
Q210.6
What movedAt this quarter’s annualised charge-off rate
Qualitative share of the allowance
Q320.4%
Q219.7%
What movedInside the 15–25% band the committee set
Should you compare your allowance ratio to peers?
As context, yes. As a target, emphatically not, and the Comptroller's Handbook says so in terms that leave no space for interpretation: "it is inappropriate for the board of directors or management to make further adjustments to ACLs for the sole purpose of reporting ACLs that correspond to a peer group median, a target ratio, or a budgeted amount" (Comptroller's Handbook, Allowances for Credit Losses).
The handbook also explains why the comparison is weaker than it looks. "Management should apply caution when performing peer comparisons as there may be significant differences among peer [banks] in the mix of financial asset portfolios, reasonable and supportable forecast period assumptions, reversion techniques, the data used for historical loss information, and other factors." Two banks of the same size in the same state can differ in every one of those, so a gap to the median is a question rather than a finding — the right response is to look for the portfolio or assumption that explains it, and to write down the answer.
Used that way the comparison earns its place in the pack. The sample bank sits at 1.31% of loans against a peer median of 1.24% for fourteen Midwest banks of $3 to $10 billion, and the memo can say which segments account for the difference. What it must not do is move a factor to close the gap, which would be the practice the handbook forbids, dressed as a qualitative adjustment.
How to explain the quarter's change to the board in one page
Four things, in this order, fit on a page and answer the questions a board actually asks. The opening and closing balances with the change in dollars and in basis points of loans. The components, largest first, with one sentence each. The two or three ratios that moved, each with its denominator. And the decisions taken: which factors moved, who accepted them, and what the committee is being asked to approve.
What to leave out is as useful. The disclosure's lines belong in the financial statements, not in the memo; a board that is shown provisions, write-offs and recoveries has been given the accounting entries rather than the explanation. The model's methodology belongs in the validation report. The segment schedule belongs in the appendix, where it supports the bridge for anyone who wants to check it.
One component, opened: what the qualitative bar is made of
A bridge that ties is not an accounting nicety. It is the thing that lets a controller book the provision the day after the committee meets, and the thing an auditor opens first. To see one built from the segment schedule with its residual printed, start from CECL Allowance Management.
Questions people ask
Is the allowance rollforward the same as the change bridge?
No, and treating them as one artefact causes trouble in both directions. The roll-forward is a disclosure with six prescribed lines, provided by portfolio segment, which a reader of the financial statements is entitled to. The bridge is a management schedule with as many components as the bank needs to explain what moved the estimate, and its components are causes rather than entries. They must end at the same closing balance; they share almost no lines in between.
What is the difference between the provision and the change in the allowance?
Net charge-offs. The provision is the expense recognised in the period; the change in the allowance is that expense less the amounts written off and plus recoveries. At the sample bank the allowance rose $2,697 thousand while the provision was $3,911 thousand, the difference being $1,214 thousand of net charge-offs. A board paper that reports one and not the other will be asked for the other.
Does the roll-forward have to be given by segment?
Yes. The standard asks for the activity to be provided separately by portfolio segment and major security type, so a single consolidated schedule does not meet it. That requirement also does useful work internally: a consolidated roll-forward can hide two segments moving in opposite directions, which is exactly the movement a committee most needs to see.
What belongs in the Call Report's Adjustments line?
Activity that cannot properly be reported in items 2 through 5 — the instructions say so directly. In practice that means an initial allowance on purchased assets with credit deterioration, effects of business combinations and pushdown accounting, and the allocated transfer risk reserve activity for institutions required to maintain one. What should not be there is a residual nobody has traced, and a material figure on that line should be explained in the allowance memo rather than left to the next examination.
What is a good allowance to loans ratio?
The honest answer is that there is no such figure, and chasing one is a practice the Comptroller's Handbook names as inappropriate. The ratio is an output of a methodology applied to a particular book, so it varies with asset mix, forecast period, reversion technique and loss history. The useful questions are whether the ratio moved for reasons the bank can name, and whether a gap to peers is explained by the portfolio rather than by an adjustment made to close it.
Why would a bank print an unexplained difference of zero?
Because the line is the test, not the result. If the bridge is built from the segment schedule component by component and the residual is calculated rather than assumed, a zero means the explanation is complete; without the line, a zero means nothing, since the last component could have been derived to produce it. The same logic applies in reverse: a small non-zero residual shown openly is better evidence of a controlled process than a perfect total that was forced.