UBPR peer groups are the groups of similar banks against which the Uniform Bank Performance Report compares each bank's ratios. Since 2026, insured commercial banks are placed in one of 8 peer groups by average assets alone, down from 17 groups that also used the number of banking offices and whether the bank was headquartered in a metropolitan area; savings banks, credit card banks, bankers' banks and newly chartered banks have groups of their own. The UBPR is computed from the Call Report and published, free, for every insured commercial and savings bank, so a swing that looks odd against peers is visible to examiners, analysts and depositors within days of filing. Botminds' Call Report Analysis is an agentic solution for the edits and explanations of the Call Report; it shows public peer trends beside an item as context for the reviewer, and never lets them stand in for the bank's own reasons.
The peer group definitions and methods below are quoted from the FFIEC's UBPR User's Guide, Technical Information (April 2026); the screens come from the solution's fictional sample bank.
The eight UBPR peer groups for insured commercial banks, from 2026
| Peer group | Average assets for the latest quarter |
|---|---|
| 1 | In excess of $100 billion |
| 2 | Between $10 billion and $100 billion |
| 3 | Between $3 billion and $10 billion |
| 4 | Between $1 billion and $3 billion |
| 5 | Between $300 million and $1 billion |
| 6 | Between $100 million and $300 million |
| 7 | Between $50 million and $100 million |
| 8 | Less than $50 million |
| De novo (by year opened) | Less than $750 million; grouped with banks that opened the same year, for five years |
What are UBPR peer groups?
They are the comparison sets behind every peer average and percentile in a bank's UBPR. "Banks are assigned to one primary peer group to permit average ratios to be calculated," the guide says; peer data "show the average performance of a group of banks with similar characteristics" and "can be used as a benchmark against which an individual bank's asset and liability structure and earnings may be measured." Most banks sit in one of the insured commercial bank groups. Banks whose business makes them outliers among commercial banks get line-of-business groups instead: savings banks, credit card specialty banks and bankers' banks.
There are also supplemental groups, used alongside the primary one. Trust activity is compared within five fiduciary peer groups by fiduciary assets reported in Schedule RC-T; savings banks are also grouped by mutual or stock ownership; and a state average report compares banks within a state, where there are at least six.
What changed in UBPR peer groups in 2026?
The commercial bank groups were cut by more than half and simplified to one criterion. "In 2026, the number of commercial bank peer groups was reduced from 17 to 8, and criteria for commercial bank peer groups is based solely on asset size," the guide says. "The number of banking offices and headquarters location (in a metropolitan statistical area or not) were removed from peer group criteria."
UBPR commercial bank peer groups, before and after the 2026 change
Before 2026: 17 commercial bank peer groups
From 2026: 8, plus de novo groups by year
Before 2026: Asset size, number of banking offices, and headquarters inside or outside a metropolitan statistical area
From 2026: Average assets for the latest quarter, from Schedule RC-K, alone
Before 2026: Smaller groups of banks with similar size, branch network and market
From 2026: Larger groups of similar size; the branch network and the market are no longer held constant
Before 2026: Read the peer number on the cover page
From 2026: Read it again: the peer group, and so the averages and percentiles, may have changed
The practical effect is that a rural bank with a dozen branches and a city bank with two are now compared with each other if their average assets fall in the same band. Ratios that depend on the branch network, such as overhead or core deposit funding, will spread more widely within a group, and percentile ranks on those ratios will tell a bank less about its real competitors. The Custom Peer Group Bank Report, which recomputes peer statistics for a group the user defines by FDIC certificate number, is the tool for a comparison the standard groups no longer give.
How is a bank's UBPR peer group chosen?
By its average assets, measured each quarter. Commercial bank peer groups "are defined by asset size using 90-day average assets from Call Report Schedule RC-K," and the grouping "is reviewed quarterly." Newly chartered commercial banks are compared with banks that opened in the same year for five years, then join an asset-based group. A bank's current peer group number and its criteria are printed on the cover page of its UBPR.
Specialised banks are sorted first. A bank is a credit card specialty bank if credit card loans exceed 50% of total loans and total loans plus securitised and sold credit cards exceed 50% of total assets; bankers' banks, which serve only other banks, have a single group. Savings banks are placed in four asset bands of their own, from over $1 billion to under $100 million.
Where commercial banks fall in the new size bands: roughly a third sit in peer group 5
How is the UBPR peer group average calculated?
As a trimmed average, not a simple mean. "The peer group average for a given ratio is trimmed or adjusted to eliminate the effect of outliers or banks above the 95th and below the 5th percentile," the guide says, and the result "in most cases is very close to the median." It suggests reading it as "the performance of the-bank-in-the-middle for a specific ratio."
The guide's own worked example of a trimmed peer average
180banks
in the example peer group
18banks
excluded as the top and bottom 5% on return on assets
1.26%
trimmed average return on assets for the group
-1.60%
lowest return on assets in the group, against 6.35% for the highest
Two consequences matter when reading the numbers. The banks trimmed differ from ratio to ratio, so "averages for separate ratios cannot be added or otherwise combined"; a peer's average loans plus its average securities need not sum to anything meaningful. And where fewer than five banks report a ratio, the report prints a double number sign (##) instead of a peer value. Peer averages are published once most banks have filed, "generally" 30 to 35 days after the report date.
Percentile rankings: where you sit, not how you are doing
A percentile rank places the bank among every bank in its peer group on one ratio. At the 80th percentile for the tier one leverage ratio, 20% of the group is higher and 80% lower. Unlike the average, the ranking uses all banks in the group, trimmed or not. The guide is careful about meaning: "A high or low percentile ranking is a simple statement of statistical fact; it does not imply a good, bad, satisfactory, or unsatisfactory condition."
The averages carry the same caution. "The grouped averages do not constitute supervisory targets or ideal values," the guide says. A bank at the 95th percentile for nonaccrual loans has a question to answer, not a finding against it; the answer is in its own loans.
What is the difference between the UBPR and the Call Report?
The Call Report is what the bank files; the UBPR is what the agencies compute from it. "The source of all bank and savings institution financial data in the UBPR is Call Reports," with structure data such as office counts and holding company added from agency files. The UBPR turns the filed amounts into ratios, percentages and growth rates, adds the peer averages and percentiles, and lays them out over several years.
Its arithmetic differs from the Call Report's in ways that trip readers. Income on pages 1, 3, 7 and 11 is annualised for interim quarters, by 4 in March, 2 in June and 1.3333 in September; year-to-date averages are built from Schedule RC-K's quarterly averages; tax-exempt income is grossed up to a taxable-equivalent basis; and after a merger that grows assets by more than 25%, profitability ratios use only post-merger averages. A ratio that "moved" in the UBPR can therefore reflect annualisation or a merger rather than anything new on the balance sheet.
Is Call Report data public?
Almost all of it, and quickly. The General Instructions make every schedule available to the public except a short list of items, mostly deposit insurance assessment data, and post it on the FFIEC's public data site once the data are accepted and prepared for publication (FFIEC 031 and 041 General Instructions). The UBPR follows: "The UBPR for a given bank is usually published within a day of the underlying Call Report being filed," and for the current quarter it is recalculated every night (UBPR User's Guide; reports at the FFIEC CDR public site).
What is not public is the bank's reasoning. Quality-edit explanations stay confidential with the agencies. So the figure that fired an edit appears in public, compared with peers, the morning after filing, while the explanation of why it moved is seen only by the agencies' analysts. The public reads the number without the reason.
How do examiners use the UBPR?
To decide where to look. The OCC's procedures for regulatory reporting begin with it:
Review the bank's UBPR and applicable OCC reports or analytical tools to identify areas for potential transaction testing. For example, examiners should be alert to large increases or decreases in income statement or balance sheet accounts and consider sampling related report schedules to test for accuracy.
OCC, Comptroller's Handbook, Regulatory Reporting, examination procedures
The FDIC works the same way. Its risk-scoping module lists Call Reports and UBPRs among the outside sources for planning an examination (FDIC, Risk Scoping Activities), and the sample scope memorandum in its examination manual begins one section: "Asset Quality will be the primary review area, due to negative portfolio performance metrics noted in the UBPR and adverse findings at the previous two examinations" (FDIC RMS Manual, section 21.1). A large swing against peers is often the first thing an examiner asks about, months after the explanation was written.
Why peer context explains nothing on its own
A peer group's movement can tell a reviewer which explanations will be needed; it cannot be one. The guide makes the point with its own example: a bank whose net interest income to average earning assets is 3.03% against a peer average of 3.96%, at the 15th percentile, "may appear to be having profit-margin difficulties," until its balance sheet is examined and turns out to hold far more investments and noncore funding than its peers. The ratio was normal for that bank; only the composition explained it.
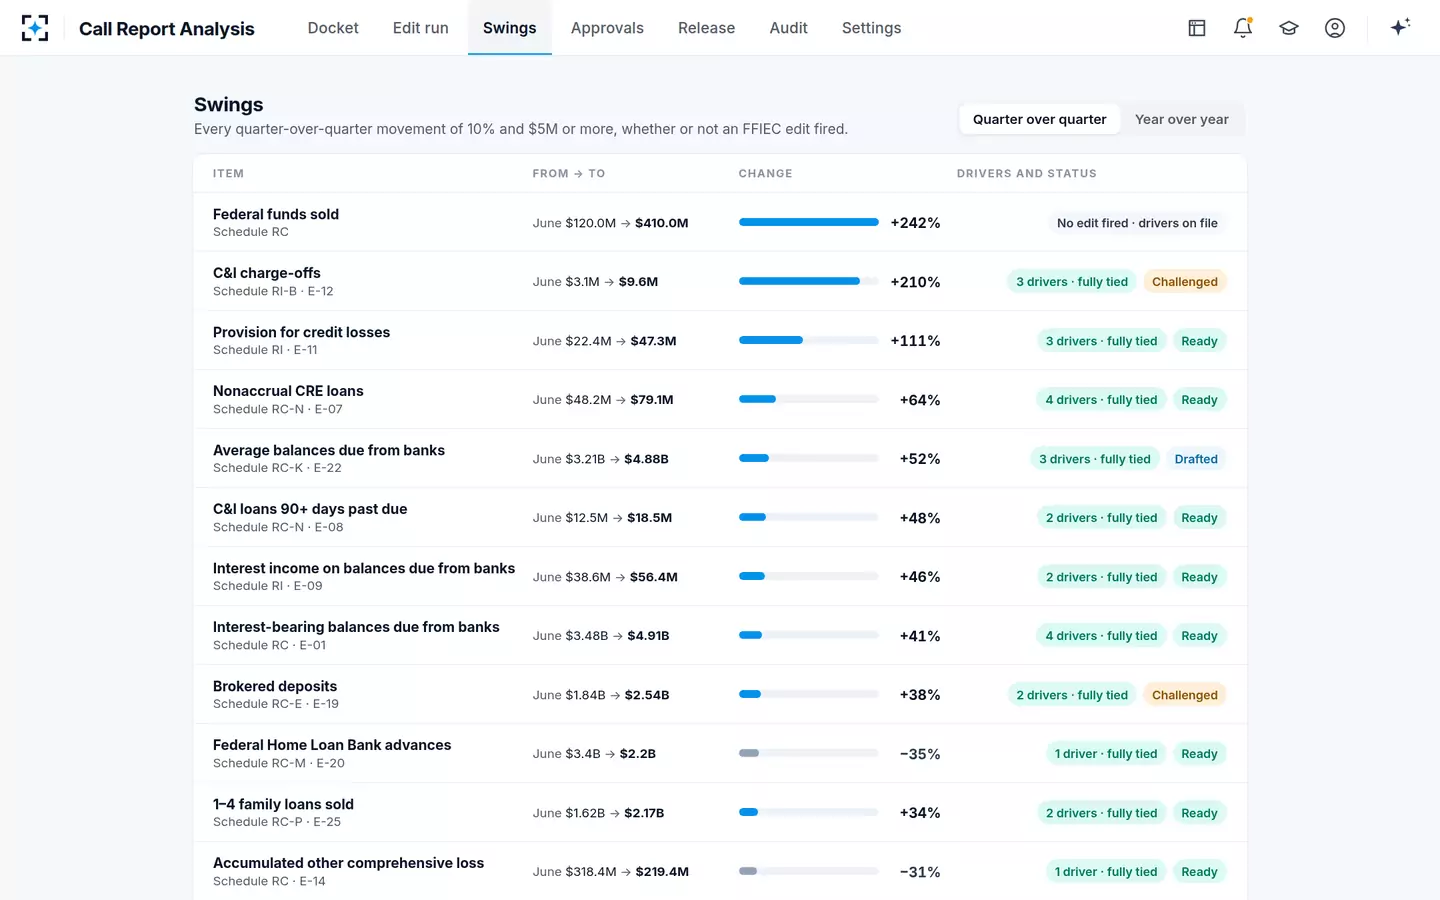
That is the rule Call Report Analysis applies to its own agents. A peer context agent can show public UBPR peer trends beside an item, labelled "Context only, never a driver," and the Variance agent is barred from using them: an explanation's drivers come from the bank's journals, subledgers and documents, or they are not drivers. When nonaccrual loans rose 64% in the sample bank's quarter, the explanation named three loans and a paydown, not a regional trend in office property.
Every movement of 10% and $5 million, explained from the bank's own data
How do I read a UBPR report before the examiner does?
Start where the guide starts, and read the bank's own movements against its peers before the report is filed, using last quarter's UBPR and this quarter's draft. The method the guide describes is a "decision tree": summary ratios on page 1 lead to the supporting pages, so a ratio can be traced to its cause.
Seven steps to read your UBPR the way an examiner will
- Check the cover page
Peer group number and criteria, and footnotes for mergers or Subchapter S; after 2026, confirm which group you are in now.
- Read page 1 against peers and against your own trend
The guide's rule: compare with the peer group, consider the bank's trends over time, and watch the peer averages' own trends.
- Follow each outlier down the decision tree
From a summary ratio to the earnings, balance sheet or asset quality page that drives it.
- Strip out the arithmetic
Annualisation, tax-equivalent income and merger adjustments can move a ratio with no change in the business.
- Read the percentile as a position, not a grade
Then ask whether your balance sheet composition explains it.
- List the movements a stranger would ask about
Large increases or decreases in income statement or balance sheet accounts are what examiners are told to watch.
- Check each has an explanation with evidence
Edit explanations are confidential, but the examiner will ask the same question; the answer should already exist.
Step 7 is where the reporting desk's work meets the public data. Every swing listed in step 6 is a quality edit or a decomposition the desk has already done, or should have. Fluctuation analysis to the Call Report's standard covers how to explain those movements so the answer survives a second reader, and call report edit checks covers the agencies' wording rules. The sample quarter is on the Call Report Analysis page.
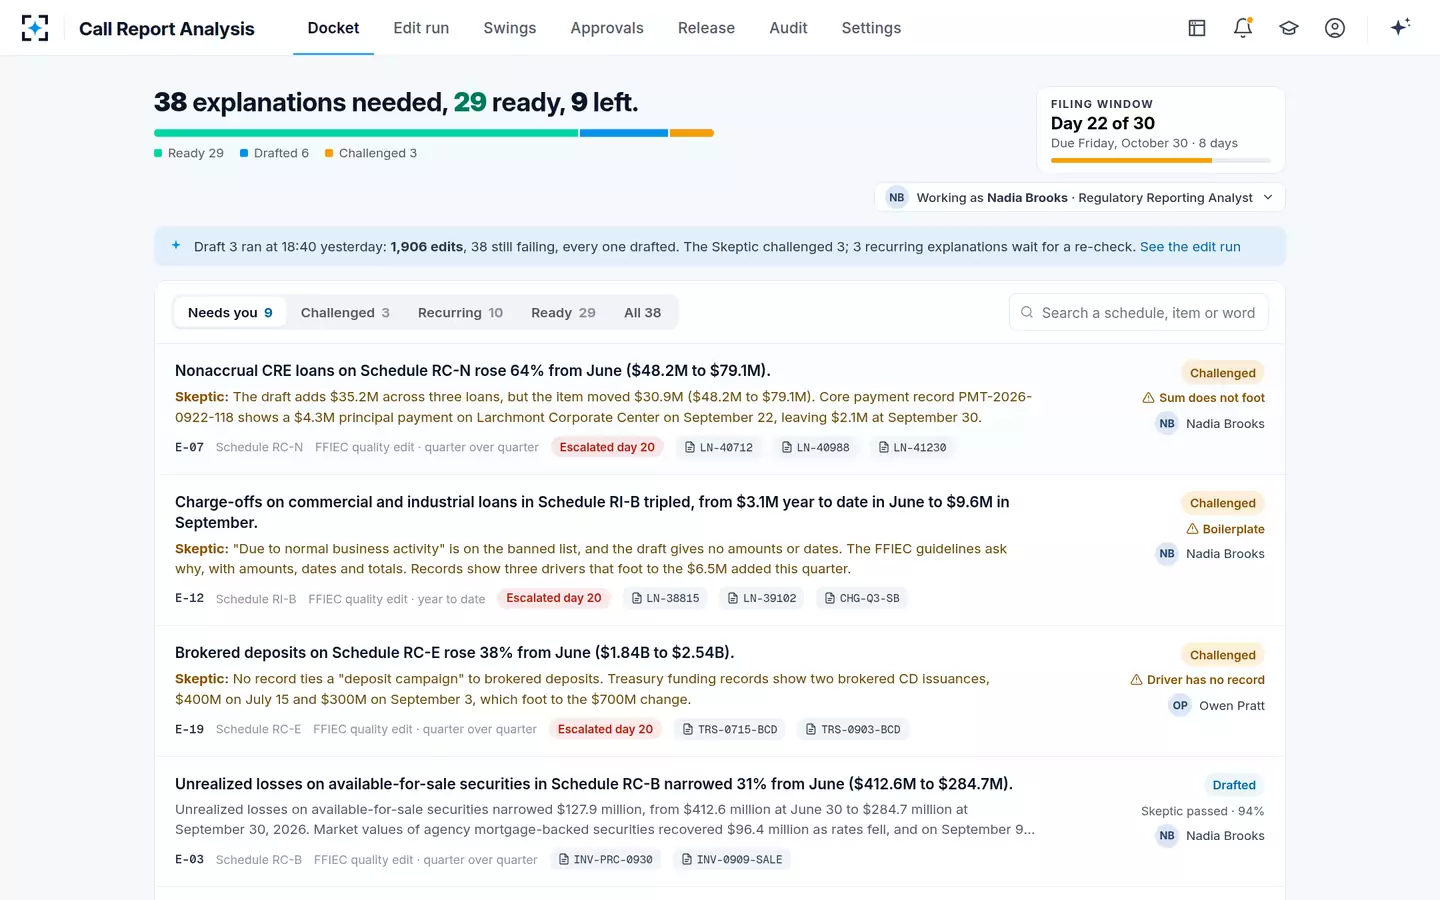
The quarter's open explanations, each a sentence with its figures
Questions people ask
Where can I get a bank's UBPR?
Free, on the FFIEC Central Data Repository's public site, searchable by bank name, FDIC certificate number, RSSD ID or OCC charter number. The site has data for most banks back to December 31, 2002, plus peer group, state average and distribution reports and bulk downloads.
Can I compare my bank with a peer group I choose?
Yes. The Custom Peer Group Bank Report recomputes UBPR peer statistics for a group the user defines, by FDIC certificate number or through the site's search, and shows the bank's data beside them in UBPR format.
How often is the UBPR updated?
For the current quarter, every night. The current and four prior quarters are recalculated every Friday night, and the prior twenty-one quarters once a quarter, about two weeks before banks begin submitting the next Call Report. Amendments therefore reach the public figures quickly.
Does the UBPR cover credit unions?
No. It covers FDIC-insured commercial banks, savings banks and savings associations. Credit unions file the NCUA's 5300 Call Report, which the NCUA publishes through its own tools.
What does ## mean in a UBPR?
It means there were too few banks to compute a valid peer value: fewer than five observations for that ratio. A plus or minus ## in the bank's own column means the ratio was above 999 or below -999.