Fluctuation analysis in accounting is the comparison of a balance or income line with an earlier period, or with an expectation, followed by an explanation of every movement large enough to matter. Done well, it is a test: the movement is split into the transactions that caused it, each one traced to a source, and the part that cannot be traced, the residual, is reported rather than rounded away. Done badly, it is a sentence that sounds like a reason. The Call Report demands the first kind, because its quality-edit explanations go to an agency analyst who wants dates and amounts, and because examiners pick schedules to test from the bank's largest swings. Botminds' Call Report Analysis is an agentic solution that applies this standard to every Call Report movement above the bank's thresholds: agents split each swing into drivers tied to the general ledger and subledgers, show the residual, and block any explanation that leaves too much unexplained.
The worked example comes from the solution's fictional sample bank, Corvane National Bank, for September 30, 2026; the method follows the PCAOB's standard on analytical procedures, linked below.
One Call Report swing, split: the first draft overclaimed, the second leaves nothing over
First draft: $35.2M of drivers for a $30.9M rise
- Supported by the change · 88%
- Residual: $4.3M overclaimed · 12%
Version 2: the $30.9M rise, fully explained
- Halvorsen Park Office, $17.6M · 57%
- Brightwater Commons, $11.2M · 36%
- Larchmont, $6.4M less $4.3M paydown · 7%
What is fluctuation analysis in accounting?
It is an analytical procedure: compare what was recorded with what you would expect, and investigate the differences. The PCAOB's auditing standard describes analytical procedures as "evaluations of financial information made by a study of plausible relationships among both financial and nonfinancial data," built on the premise that such relationships "may reasonably be expected to exist and continue in the absence of known conditions to the contrary" (PCAOB, AS 2305). A fluctuation is a break in the expected relationship; the analysis finds out why.
The standard lists what can cause one: "specific unusual transactions or events, accounting changes, business changes, random fluctuations, or misstatements." The last item is the reason the work exists. Four of the five causes are innocent and the fifth is an error, and from the outside they look the same. Only tracing the movement to its transactions tells them apart.
What is the difference between flux analysis and variance analysis?
Mostly the comparison point. In common usage, flux or fluctuation analysis compares a balance with an earlier period of the same entity, quarter over quarter or year over year, while variance analysis compares results with a budget, plan or standard. The method is the same: decompose the difference into causes and quantify each. On the Call Report the comparison is always with the bank's own earlier filing, so the work is flux analysis, whatever the team calls it.
Flux analysis and variance analysis compare against different things
Flux (fluctuation) analysis: The same line in an earlier period
Variance analysis: A budget, forecast or standard
Flux (fluctuation) analysis: Accounting, regulatory reporting, external and internal audit
Variance analysis: Financial planning and business management
Flux (fluctuation) analysis: What happened to this balance, and is it recorded right?
Variance analysis: Why did results differ from plan, and what do we do?
Flux (fluctuation) analysis: The basis of most quality-edit explanations and of the swings examiners notice
Variance analysis: Rarely relevant: the instructions ask about what was reported, not what was planned
What threshold should trigger a fluctuation explanation?
A threshold set by materiality and by the reader, usually as a percentage and a dollar amount together. Auditing standards do not give a number; they give the logic. "In planning the analytical procedures as a substantive test, the auditor should consider the amount of difference from the expectation that can be accepted without further investigation. This consideration is influenced primarily by materiality," AS 2305 says, and the amount must allow for small misstatements adding up to a large one.
Using both a percentage and a dollar floor stops small lines from flooding the review and large lines from hiding big moves behind small percentages. A 10% move in a $3 million line is $300,000; a 2% move in a $3 billion line is $60 million. The FFIEC's quality edits set their own tests, and a bank's thresholds should catch what they do not.
Fluctuation thresholds in practice: the auditor's logic and one bank's settings
| Threshold | Sample bank in Call Report Analysis | Why it is set that way |
|---|---|---|
| Quarter over quarter | 10% and $5 million, both met | Catches moves that matter without flooding review with small lines |
| Year over year | 20% and $10 million | Catches slow drifts a quarterly test misses |
| Largest acceptable residual | $0.25 million or 2% of the movement | The difference that may be left without further investigation |
| Regardless of size | Every FFIEC quality edit that fails | An agency analyst will read the explanation |
| Level of detail | Schedule line, not report total | Detailed expectations find misstatements broad ones hide |
A fluctuation explanation is a sum, and the residual is part of it
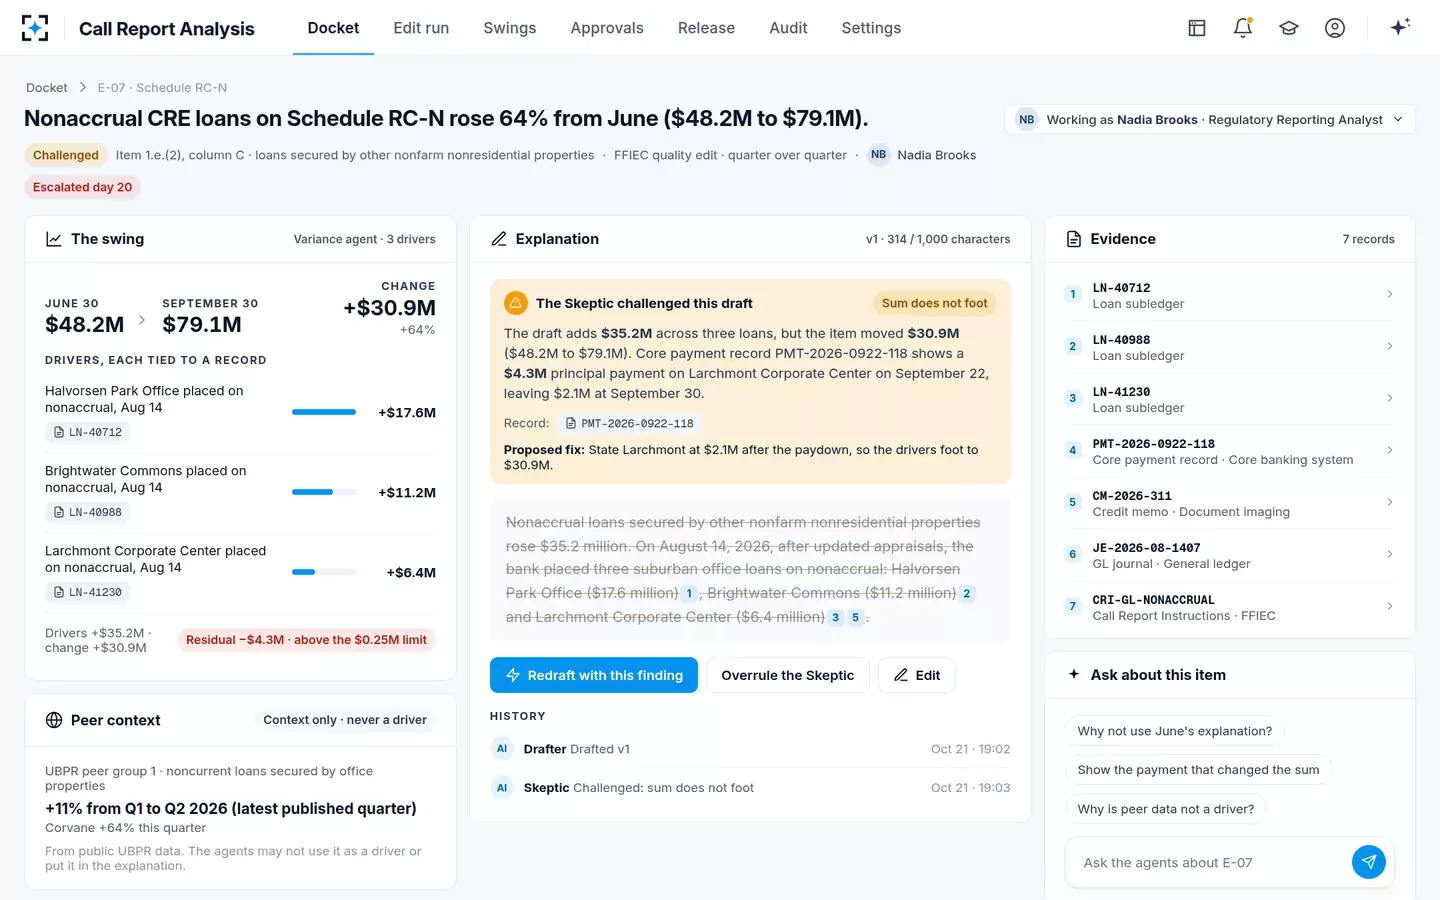
The movement equals the drivers plus the residual. Writing it that way turns an explanation into something checkable. In the sample quarter, nonaccrual loans secured by other nonfarm nonresidential property rose from $48.2 million to $79.1 million, a $30.9 million movement. The first draft listed three office loans placed on nonaccrual on August 14, at $17.6 million, $11.2 million and $6.4 million: $35.2 million, a residual of minus $4.3 million.
The residual was not noise. A core banking payment entry showed $4.3 million of principal applied to the third loan on September 22 from the proceeds of an outparcel sale, leaving $2.1 million on nonaccrual at quarter end. With that driver added, the sum foots exactly and the explanation is complete. Without it, the bank would have told its supervisor that one loan was $4.3 million larger than it was, in an explanation that read perfectly well. The trace of that edit through the agents shows how the challenge was raised.
What is an unexplained residual, and why it is the finding
An unexplained residual is the part of a movement the listed causes do not account for. Small residuals are expected; estimates and rounding leave some. A residual above the threshold is a lead: the place where a missed transaction, a misclassification or an error is most likely to be. The auditing standard says so plainly. Unexplained differences "may indicate an increased risk of material misstatement," and when no explanation can be obtained the auditor must use other procedures to decide whether the difference is a misstatement.
The auditor should evaluate significant unexpected differences. Reconsidering the methods and factors used in developing the expectation and inquiry of management may assist the auditor in this regard. Management responses, however, should ordinarily be corroborated with other evidential matter.
PCAOB, AS 2305, Substantive Analytical Procedures, paragraph .21
The last sentence is the one most fluctuation analysis fails. An explanation built from emails, such as "credit says three loans went on nonaccrual," is a management response; it becomes evidence only when the loans, amounts and dates are matched to the loan subledger and the payment history. A residual is what is left when the answer was asked for and not checked.
How do you explain quarter over quarter changes on a Call Report?
By naming the transactions that moved the balance, with their dates and amounts, and saying when in the quarter they happened. The agencies' guidance on explanations is specific about timing: "If fluctuations are due to recent purchases or divestitures, provide information on when these transactions occurred during the quarter" (FFIEC Guidelines for Resolving Edits). A purchase on the last day of the quarter moves the period-end balance in Schedule RC but barely touches the quarterly average in Schedule RC-K, and an analyst comparing the two needs the date to see why.
Balance sheet lines are point-in-time, so a quarter-over-quarter change is simply the end balance less the prior end balance. The OCC adds a warning that belongs at the top of every fluctuation file: "Variations in how the bank collects and reports data can distort information and trend analysis" (OCC, Regulatory Reporting). A line that moved because a product was re-mapped, or a source system changed, needs that said first, before any business reason.
How do you explain income statement changes on the Call Report?
Convert year to date into the quarter before explaining anything. Call Report income items are cumulative for the calendar year, which the agencies' own edit description states: "Income statement items are reported on a calendar year-to-date basis." A June figure covers six months and a September figure nine, so the third quarter alone is September less June.
Year-to-date figures hide the quarter: C&I charge-offs in the sample bank
In the sample, charge-offs on commercial and industrial loans "tripled," from $3.1 million year to date in June to $9.6 million in September. The quarter's own charge-offs were $6.5 million, more than double the first half's total. An explanation that says "due to normal business activity," which the sample bank bans, fails twice: it gives no cause and it does not say which number it is explaining. In the sample, the Skeptic challenged a draft for that phrase and pointed to three charge-offs in the loan records that foot to the $6.5 million.
Disaggregate before you explain
A total that barely moved can hide two large movements that cancel. AS 2305 makes the point in its own terms: "Expectations developed at a detailed level generally have a greater chance of detecting misstatement of a given amount than do broad comparisons," and "Disaggregation helps reduce this risk." The Call Report already disaggregates more than most management reports, line by line and schedule by schedule, so the analysis should start at the line, not at the total.
The practical test is reclassification. If a $40 million loan moved from one Schedule RC-C line to another, total loans do not change and neither line's movement is explained by new business. Only line-level analysis shows that the cause of both swings is one transfer, and only the transfer's documentation shows whether the new line is right.
How do auditors use fluctuation analysis?
As evidence, with conditions. Under AS 2305 an analytical procedure can be a substantive test, but the auditor must first test the controls over the data used or otherwise support its completeness and accuracy, must set an expectation precise enough to catch a material misstatement, and, where the procedure is the principal test of a significant assertion, must document the expectation, the comparison and any further procedures performed on significant unexpected differences. For significant risks, the standard adds, analytical procedures alone are unlikely to be sufficient.
Bank examiners use the same logic from the other side. The OCC's procedures start from the UBPR, watch for large increases or decreases in balance sheet and income statement accounts, and sample the related Call Report schedules for testing. A bank whose own fluctuation analysis has already split those swings into documented drivers hands the examiner the work they were about to do. UBPR peer groups explains what the examiner sees first.
A fluctuation explanation is complete when it passes these six tests
- It says which number it explains
The line, the two amounts and the movement; for income, the quarter, not the year to date.
- Its drivers add up
Drivers plus residual equal the movement, and the residual is within the threshold.
- Each driver is corroborated
A journal entry, subledger line, payment or document, not only someone's say-so.
- It gives dates
When in the quarter each transaction happened, especially near quarter end.
- It rules out the boring causes
Mapping changes, system changes and reclassifications between lines, stated first if they apply.
- It cites the instruction
Where the treatment depends on a definition, the page or Glossary entry relied on.
Where Call Report Analysis applies the standard to every swing
The solution runs the same test on every movement above the thresholds, whether or not an FFIEC edit fired. The Variance agent splits each swing into drivers from general ledger journals and the loan, deposit and securities subledgers and shows the residual; a driver without a source is not counted, and peer data are never a driver. An explanation whose residual exceeds $0.25 million or 2% of the movement cannot be accepted, and the Skeptic, a second agent, foots every figure again before an analyst reads the draft.
Every movement of 10% and $5 million, each with drivers tied to sources
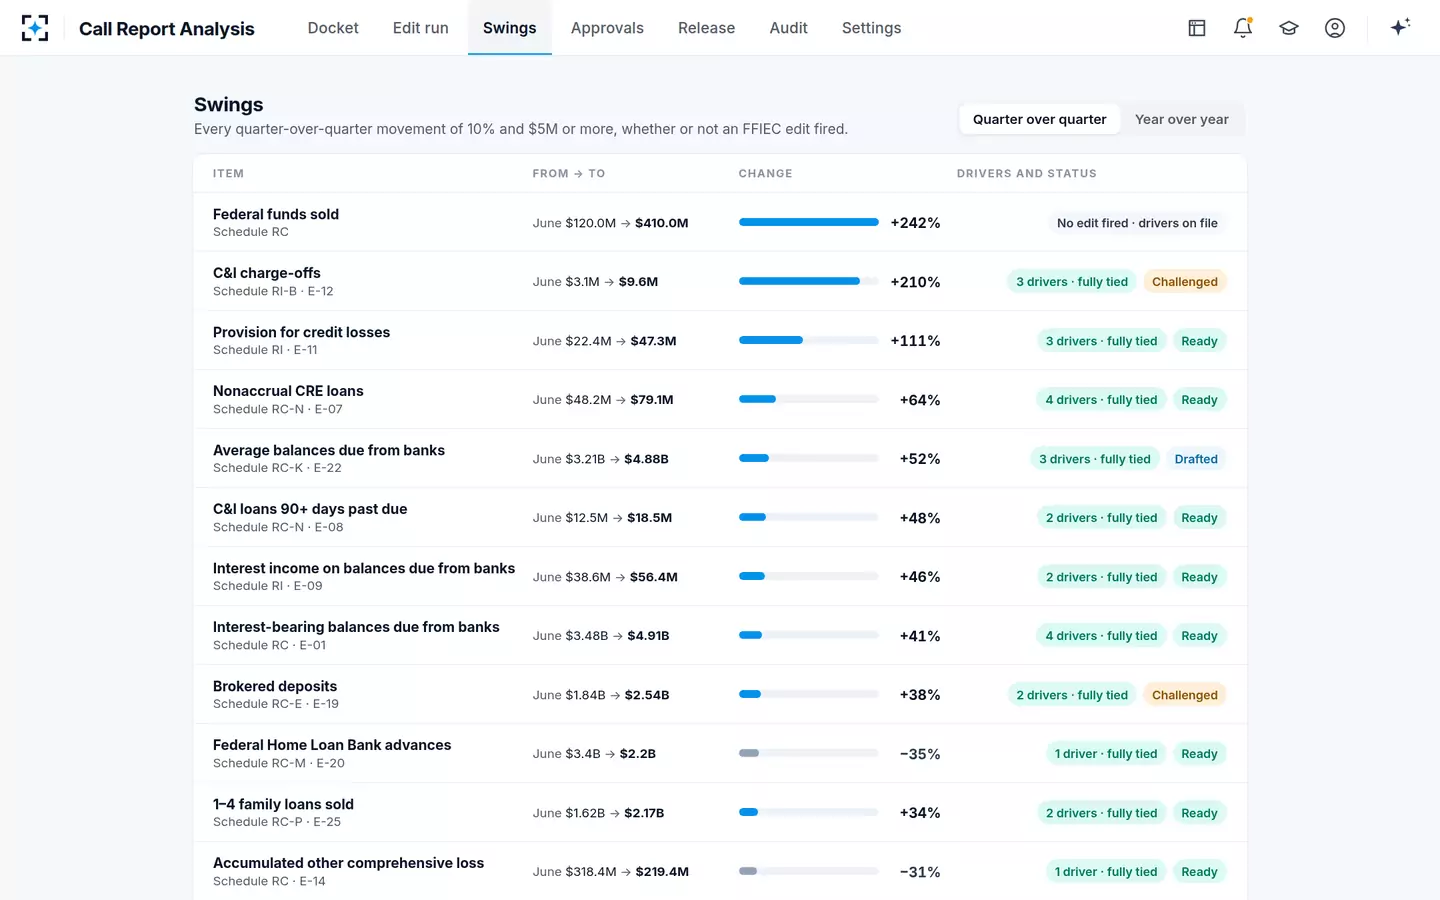
The residual is shown on every item, beside the drivers, so the reviewer sees what is unexplained before reading a word of the narrative. In the sample, the challenge on the first draft named the payment that broke the sum and proposed the fix; the analyst opened the payment entry, asked for a redraft, and accepted version 2 with a residual of zero.
The residual, shown before the narrative: -$4.3M, above the limit
To run the same analysis on your own last quarter, start from Call Report Analysis.
Questions people ask
Does every Call Report swing need a written explanation?
Only failing quality edits need one in the filing. But examiners pick schedules to test from large movements in the UBPR, so a bank that explains every material swing in its own workpapers, edit or no edit, has the answer ready when asked.
What if a fluctuation cannot be explained?
Treat it as a possible error until shown otherwise. AS 2305 says unexplained differences may indicate an increased risk of material misstatement and require other procedures; on a Call Report that means testing the line's detail before filing, not writing a general explanation.
Can peer or market trends explain a fluctuation?
They can give context, not a cause. A peer group's rising nonaccruals do not explain why this bank's loans went on nonaccrual; the loans, dates and amounts do. Call Report Analysis shows peer trends beside an item, labelled as context, and never lets them into the explanation.
How precise should a fluctuation expectation be?
Precise enough that a difference large enough to matter would stand out. AS 2305 ties precision to the factors that drive the amount and the level of detail used: monthly beats annual, and line-level beats company-wide.
Are income statement fluctuations easier to explain than balance sheet ones?
Often, because they are more predictable. AS 2305 notes that relationships involving income statement accounts tend to be more predictable than those involving only balance sheet accounts, since they represent transactions over a period rather than a point in time.