New York DFS Circular Letter No. 7 (11 July 2024) expects insurers using AI systems or external consumer data in underwriting or pricing to test for unfair or unlawful discrimination "prior to putting AIS into production and on a regular cadence thereafter, as well as whenever material updates or changes are made." The test is a three-step assessment: whether the model produces disproportionate adverse effects, whether a legitimate, lawful and fair explanation accounts for them, and whether a less discriminatory alternative exists. For the first step the letter encourages several metrics and names six kinds. On a real model those metrics often disagree, and the letter's documentation expectation means the insurer has to write down which result governs and why. Botminds' AI Bias & Fairness Testing runs the metrics for every group pair, traces any gap to its inputs, tests alternatives and drafts that reasoning; the model owner decides and the model risk validator signs.
"insurers are encouraged to use multiple statistical metrics in evaluating data and model outputs to ensure a comprehensive understanding and assessment."
New York DFS, Insurance Circular Letter No. 7 (2024)
What does Circular Letter 7 require for testing?
It sets when to test, what the test must cover and how to document it. When: before production, on a regular cadence, and after material changes to the model or its data, with a description of output testing "conducted at least annually." What: a "comprehensive assessment" in three steps, run for any protected class whose membership is known or "may be reasonably inferred using accepted statistical methodologies." How: quantitative metrics plus a qualitative assessment, which means "being able to explain, at all times, how the insurer's AIS operates and to articulate a logical relationship between ECDIS and other model variables with an insured or potential insured individual's risk" (NY DFS, 2024).
And the paperwork: "An insurer should appropriately document the processes and reasoning behind its testing methodologies and analysis," and "should be prepared to make such documentation available to the Department upon request." The Department may examine the work "within the scope of regular or targeted examinations" under Insurance Law § 309, or through a special report under § 308.
The letter addresses all insurers authorized in New York, Article 43 corporations, HMOs, fraternal benefit societies and the State Insurance Fund. It does not apply to Child Health Plus, the Essential Plan or Medicaid managed care, and it is "not intended to address phases of the insurance product lifecycle other than underwriting and pricing."
Six metrics, one model: the verdict matrix
The six kinds of metric the letter names are the adverse impact ratio, denials odds ratios, marginal effects, standardized mean differences, z- and t-tests, and drivers of disparity. Run them on one fictional model and they tell different stories by group. The model is a fictional insurer's personal auto rating plan, version 7.2, tested on 184,260 New York quotes with Black, Hispanic and Asian drivers compared with White drivers, and thresholds from the insurer's own testing standard.
One model, six metrics, three groups: the verdicts do not line up
Black: 0.72Fails
Hispanic: 0.86Passes
Asian: 1.03Passes
Black: 1.72Fails
Hispanic: 1.24Passes, near the line
Asian: 0.94Passes
Black: 4.6%Fails
Hispanic: 2.4%Passes
Asian: −0.6%Passes
Black: 0.24Fails
Hispanic: 0.14Passes
Asian: −0.03Passes
Black: z ≈ −36Significant
Hispanic: z ≈ −18Significant
Asian: z ≈ +3Significant
Black: ZIP territory, 51%Traced
Hispanic: —No failing test to trace
Asian: —No failing test to trace
For Black-probable drivers every metric points the same way: four of the insurer's thresholds fail, the gap is significant many times over, and the decomposition traces half of it to one input. For Hispanic drivers the picture splits. Every threshold passes, the odds ratio of 1.24 sits a hair under its 1.25 line, and yet the difference in the preferred-tier rate is highly significant. For Asian drivers the gap is significant in the favourable direction. A report that printed only the adverse impact ratio would say "pass" for Hispanic drivers and stop. A report that printed only the z-test would say "fail."
Why do the metrics disagree?
Because they measure different things, and some of those things cannot all be equal at once. The adverse impact ratio compares rates of a favourable outcome; the odds ratio compares odds of an adverse one; the standardized mean difference compares average premiums; the marginal effect holds expected loss constant; the z-test asks only whether a difference is larger than chance. Each has its own threshold, and a gap can sit on different sides of different lines.
Some disagreement is mathematical. Kleinberg, Mullainathan and Raghavan proved that for risk scores, three common fairness conditions cannot all hold "except in highly constrained special cases" (2016); Chouldechova showed that several criteria "cannot all be simultaneously satisfied when recidivism prevalence differs across groups" (2017). The Casualty Actuarial Society's paper makes the insurance point: "many of the fairness metrics are mutually incompatible and hence cannot be satisfied simultaneously," and in its French auto example only the calibration-type criterion held (Mosley and Wenman, CAS, 2022).
Sample size is the other cause. With 184,260 quotes, a z-test finds almost any difference significant; a threshold on an effect size does not move with sample size. That is why the letter asks for several metrics, and why a written explanation of how they were weighed is not optional.
Standardized mean difference interpretation
The standardized mean difference is the gap between two groups' average outcomes divided by the standard deviation, so it reads in standard deviations rather than dollars. The letter describes it as "Measuring the difference in average outcomes between protected classes and control groups." The usual yardstick is Cohen's: effect sizes are "small (d = 0.2), medium (d = 0.5), and large (d ≥ 0.8)," and "Unlike significance tests, effect size is independent of sample size" (Sullivan and Feinn, 2012).
On the fictional model, Black-probable drivers' indicated premium is 0.24 standard deviations above White drivers', just past a "small" effect and past the insurer's 0.20 threshold; Hispanic drivers' is 0.14. A 0.20 threshold is therefore a choice to flag effects from the bottom of Cohen's scale up. That is defensible for pricing, where small average differences add up across a book, but it should be written down as a choice, not presented as a rule.
Marginal effect fairness test: holding risk constant
A marginal effect asks how much group membership changes the outcome when everything else is held fixed. The letter defines marginal effects as "Assessing the effect of a marginal change in a predictive variable on the likelihood of unfavorable outcomes, particularly for members of protected classes." In the fictional insurer's standard, the test is the effect of group on premium, holding expected loss constant: for Black-probable drivers it is 4.6% of premium, above the 3.0% threshold.
Of the six, it is the metric closest to the letter's own language about "similarly situated" insureds, because it compares people with the same expected loss. Colorado's unadopted draft for life insurers used the same idea, a regression marginal effect with permitted controls, and set its trigger at five percentage points of approval probability (Colorado DOI draft, 2023). When the marginal effect fails, the question "is the gap just risk?" has largely been answered: no.
Drivers of disparity: from a failing number to an input
The sixth metric is not a number but an attribution: "Identifying variables in AIS that cause differences in outcomes for protected classes relative to control groups," estimated by "sensitivity analysis, Shapley values, regression coefficients, or other suitable explanatory techniques" (NY DFS, 2024). On the fictional model, a Shapley decomposition splits the 11.7-point preferred-tier gap between Black-probable and White drivers across the inputs.
Half of the gap comes from one input: drivers of disparity on a fictional rating model
Black–White preferred-tier gap, 11.7 points
- ZIP code territory · 50%
- Credit-based insurance score tier · 24%
- Vehicle age · 9%
- Prior insurance lapse · 6%
- Annual mileage and years licensed · 3%
- Other inputs and interaction · 8%
The decomposition turns "the model fails" into "this input fails," which is what Step 2 needs. Whether ZIP code territory has "a legitimate, lawful, and fair explanation" is now a specific question with specific evidence: in the fictional model's worst territory, the five-digit factor charges 31% above the state average where losses run 8% above. Proxy discrimination in insurance follows that input through to its replacement.
Less discriminatory alternatives: Step 3 in practice
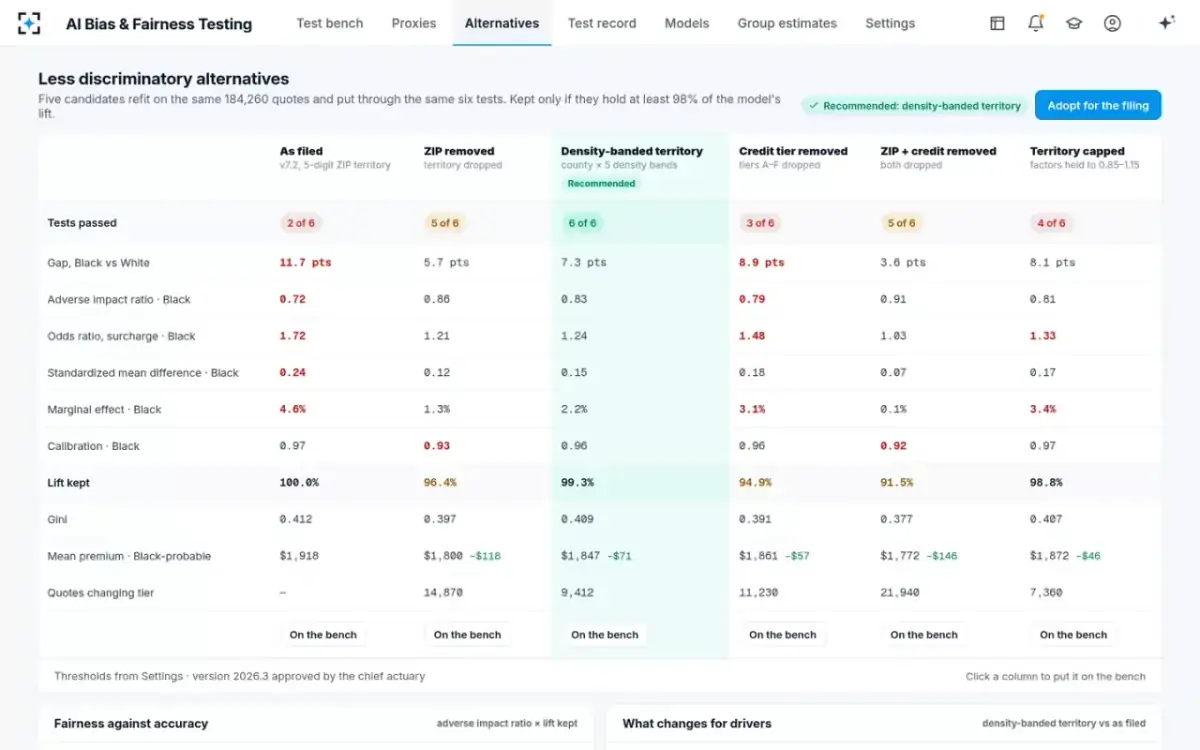
Step 3 is "conducting and appropriately documenting a search and analysis for a less discriminatory alternative variable(s) or methodology that would reasonably meet the insurer's legitimate business needs." If one exists, the insurer "should modify its use" and re-test from Step 1; if none does, it should "repeat Step 3 at least annually" (NY DFS, 2024). The letter does not define "legitimate business needs"; the fictional insurer's standard makes it operational as keeping at least 98% of the model's predictive lift.
Five alternatives on the same quotes, under the same six tests
| Alternative | Tests passed | Gap (points) | Lift kept | Quotes changing tier |
|---|---|---|---|---|
| As filed: five-digit ZIP territory | 2 of 6 | 11.7 | 100.0% | — |
| ZIP territory removed | 5 of 6 | 5.7 | 96.4% | 14,870 |
| Density-banded territory (county × 5 bands) | 6 of 6 | 7.3 | 99.3% | 9,412 |
| Credit tier removed | 3 of 6 | 8.9 | 94.9% | 11,230 |
| ZIP territory and credit tier removed | 5 of 6 | 3.6 | 91.5% | 21,940 |
| Territory factors capped at 0.85–1.15 | 4 of 6 | 8.1 | 98.8% | 7,360 |
The table shows why a search is more than a single refit. The alternative that closes most of the gap (removing territory and credit together) is also the least accurate, and fails calibration for Black-probable drivers. The one that meets every test keeps territory's risk signal at a coarser grain. In AI Bias & Fairness Testing an agent proposes the alternatives; the pricing actuary who owns the model decides whether to adopt one.
The alternatives as the model owner sees them
Which result governs? Writing the explanation examiners read
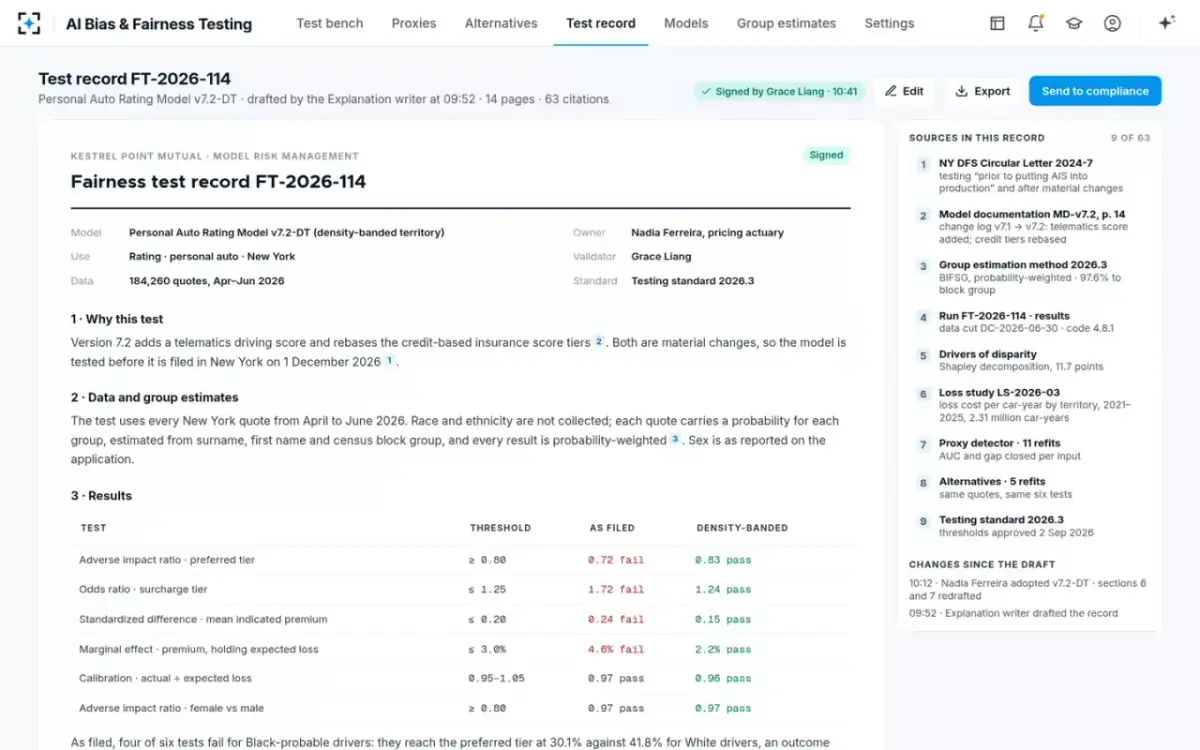
The letter asks insurers to document "the processes and reasoning behind" their testing. When metrics disagree, the reasoning is the deliverable. A good explanation names the governing metric for each outcome before the results are seen, says why, and then deals honestly with every metric that points the other way.
For the fictional Hispanic result, that might read: the preferred-tier difference is statistically significant, but every effect-size threshold in the standard passes, including the marginal effect holding expected loss constant (2.4% against 3.0%); the odds ratio of 1.24 is within 0.01 of its limit and will be watched at the next test; no input was found to carry a disproportionate share. For the Black-probable result: four thresholds fail, the marginal effect confirms the gap is not explained by expected loss, ZIP territory carries half of it, and the density-banded alternative was adopted.
What the written explanation should say when the metrics disagree
- The governing metric for each outcome, fixed in advance
For example the marginal effect for premium, the adverse impact ratio for tier placement.
- Why that metric
Which question it answers, and why that question matters for this model and line.
- Every metric that disagrees, and why it does
Sample size, outcome definition, threshold choice or a real effect.
- The driver behind any failure
The input, its share of the gap and how that was estimated.
- The relation of that input to risk
The loss evidence, and whether the factor charged matches it.
- The alternatives and the decision
What was tried, what was adopted, who decided and when Step 3 will be repeated.
A signed report, sealed with its data cut and code version
What Circular Letter 7 does not cover
Claims models, for one: the letter covers underwriting and pricing only, though Colorado's statute and the NAIC bulletin reach claims. Thresholds, for another: it leaves pass marks and standards of proof to each insurer. And it does not let the responsibility move to a vendor: a third party's assurance is not enough on its own.
The letter's disclosure rules sit beside the testing rules rather than inside them, including notice within 15 days when an applicant cannot be underwritten through an AI-based process and must use a traditional one. And it does not require insurers to collect race: "There is no expectation that insurers collect additional data from, or about, individuals to perform exemplary analysis." With estimated groups, the results speak about groups, not about any single quote, a point the Academy of Actuaries makes about Census-based estimates (Academy, 2024). How to compute the weighted ratios behind the matrix is in the adverse impact ratio with probability weights; the full test is on the AI Bias & Fairness Testing page.
Questions people ask
How do you interpret a standardized mean difference?
As a gap in standard deviations: by Cohen's convention 0.2 is small, 0.5 medium and 0.8 or more large. Because it does not depend on sample size, it is a better guide to practical importance than a significance test on a large book.
What is a marginal effect fairness test?
It estimates how much belonging to a group changes an outcome when other factors are held constant, often with a regression. For pricing, the useful version holds expected loss constant, so any remaining effect is a difference between people of similar risk.
Which fairness metrics fit life insurance?
For underwriting decisions, rates of approval and odds of decline; for pricing, premium per $1,000 of face amount compared with controls. Colorado's unadopted draft used exactly those: logistic regression on approval and linear regression on premium rate, with policy type, face amount, age, gender and tobacco use as permitted controls.
What are examples of fairness metrics?
The adverse impact ratio (ratio of favourable-outcome rates), the odds ratio of adverse decisions, the standardized mean difference, marginal effects, significance tests, and calibration of predicted to actual outcomes by group. New York lists the first five plus drivers of disparity.
What is a less discriminatory alternative?
A different variable or method that reduces the disparate effect while still meeting the insurer's legitimate business needs. Under New York's Step 3, the insurer documents the search, adopts an alternative if one exists, and repeats the search at least annually if none does.
When did NY DFS issue Circular Letter 7, and what does it cover?
The final letter was issued on 11 July 2024, after a proposed version on 17 January 2024. It covers the use of AI systems and external consumer data in insurance underwriting and pricing, by all insurers authorized in New York and several other kinds of carrier.