To estimate race from surname and ethnicity for a bias test, you look up how people with that surname identified in the Census Bureau's surname list, update that with the racial and ethnic make-up of the person's block group, and, in the newer variant, with a first-name list too. The result is not a label but a probability for each group, and the test counts every person fractionally in every group. The method is Bayesian Improved Surname Geocoding (BISG), or BIFSG when the first name is added. Insurers rarely hold self-reported race, so every unfair discrimination test of a pricing, underwriting or claims model begins here. Botminds' AI Bias & Fairness Testing runs this step as its own agent, reports how well it worked on your data, and walls the estimates off from every quote, policy and claim.
It is also the step nobody presents. Results get the slides; the estimate that produced them sits in a notebook. Yet a regulator who reads a disparity finding asks first how protected-class status was inferred, and the honest answer decides how much the finding can be trusted. This guide covers the method, its accuracy by group, the choice between probabilities and labels, and the people who should and should not touch the estimate.
"This proxy assessment provision does not prevent insurers from using data to infer or impute protected class status for the limited purpose of the quantitative assessments (Section 17) discussed in this Circular Letter."
New York DFS, Insurance Circular Letter No. 7 (2024)
How do you estimate race from surname and ethnicity? Three lookups and Bayes' rule
You combine two independent clues about the same person. The first is the surname: the Census Bureau publishes, for every surname held by at least 100 people, the share who identified with each of six race and ethnicity categories. The CFPB's worked example is Smith: "73% of individuals with the surname Smith report being non-Hispanic White," so a Smith starts at 0.73 White (CFPB, 2014). The second clue is geography: the adult population of the person's block group, broken down by the same six categories.
Bayes' rule joins them. The surname gives a prior; the block group's composition, divided by each group's share of the national population, says how much more or less likely each group is to live there. A simplified two-group illustration (our arithmetic, not a published case) shows how fast the estimate moves. Suppose a surname implies 0.20 Black, the block group's adults are 60% Black, and about 12% of US adults are non-Hispanic Black (the 2010 share the CFPB reports). The surname odds of 0.25 are multiplied by the block group's odds relative to the nation, 1.5 ÷ 0.136, or about 11. The posterior odds are about 2.75, a probability of roughly 0.73. Neither clue alone said "likely Black"; together they do.
BIFSG adds a third lookup, the first name, multiplied in the same way. Real implementations carry all six categories at once and normalise them to sum to one, which is why a single person ends up with, say, 0.71 Black, 0.22 White, 0.05 Hispanic and 0.02 Asian rather than a yes or no.
From a name and an address to six probabilities: the estimation step by step
Agent
Standardise the namesStrips titles and suffixes, splits compound surnames and tries the first part, then the second, against the list.
Agent
Surname and first-name lookupReads each group’s share for the surname from the Census Bureau list and for the first name from the published first-name list, and counts how many names each list found.
Agent
Geocode the addressPlaces the garaging or residence address in a block group; an address that only reaches ZIP level uses the ZIP area, the way the CFPB method does.
Agent
Combine by Bayes’ ruleMultiplies the clues, normalises across the groups and stores a probability for each.
Never: Assigns a person to a single group, or joins an estimate to a quote, policy, claim or rate.
A person decides
Validator reviews the methodReads match rates, geocoding precision and how certain the estimates are before any test result is opened.
Why do insurers have to estimate race at all?
Because the rules ask for tests by protected class while neither New York nor Colorado asks insurers to collect the data. New York's Circular Letter No. 7 says its quantitative assessments apply only to protected classes "for which data are available, or may be reasonably imputed using statistical methodologies," and that insurers "are not expected to collect additional data from or about individuals" (NY DFS, 2024). Its footnote points to the CFPB's BISG paper as an example and adds: "The Department is not endorsing any particular statistical methodology."
Colorado goes further in one direction and less far in another. Its 2021 statute expressly does not require an insurer to collect race, color, national or ethnic origin or the other listed traits (SB21-169, § 10-3-1104.9(7)(a)). Its draft life insurance testing rule, exposed for comment in 2023 and still a draft, would name the method outright: BIFSG, "the statistical methodology developed by the RAND corporation for estimating race and ethnicity," applied to the name and geolocation in the application, with four groups: Hispanic, Black, Asian Pacific Islander and White (Colorado DOI draft, 2023). Colorado's testing requirements as they stand in 2026 explains what is in force and what is not.
Insurers already do this. In the NAIC's 2025 survey of health insurers, "14% of companies use AI to infer sensitive data, such as race or other data values" (NAIC, 2025). The question for a regulator is rarely whether an insurer inferred race; it is how, how well, and who could see the result.
What is Bayesian Improved Surname Geocoding (BISG)? The method behind the CFPB's proxy
BISG is the method RAND researchers published in 2009 and the CFPB adopted for its fair lending work on loans where race is not collected. The CFPB's 2014 paper sets out the data and the steps in enough detail to reproduce them. Its surname file then held 151,671 surnames "covering approximately 90% of the U.S. population"; the 2010 list holds 162,253 (Tzioumis, 2018). Addresses geocoded to a rooftop use the block group; addresses that only reach a street, a nine-digit or a five-digit ZIP use the ZIP area; anything vaguer is dropped (CFPB, 2014).
Those rules cost data. In the CFPB's mortgage validation sample, 26,363 of 216,798 applications, about 12%, were dropped because the surname did not match or the address could not be placed, leaving 190,435. RAND reports the payoff of combining the two clues: its method "was found to be 41 percent more efficient than using surnames only, and 108 percent more efficient than using geocoding only," with concordance statistics of 0.93 to 0.94 for the four largest groups (RAND). The CFPB publishes its own code, so a validator can reproduce the method rather than take it on trust.
BIFSG methodology: what the first name adds, and where it does not help
BIFSG multiplies in a first-name clue. The Census Bureau publishes race shares for surnames but not for first names, so practitioners use one built by an OCC economist from mortgage applications, where applicants report their own race and ethnicity: 4,250 first names drawn from 2,663,364 observations, a list that "would reflect 85.6 percent of the U.S. population" (Tzioumis, 2018).
Two arguments favour it. A surname "may actually belong to the spouse," which weakens the estimate for women who took a husband's name; the first name is the person's own. And the first name can fill in where the surname is not on the list at all. One limit is stated plainly in the same paper: "first names do not seem to distinguish NH Black applicants well." The first name helps most where the surname is ambiguous, and least for the group whose estimate is already the weakest of the four large ones.
How AI Bias & Fairness Testing shows the estimate before any result
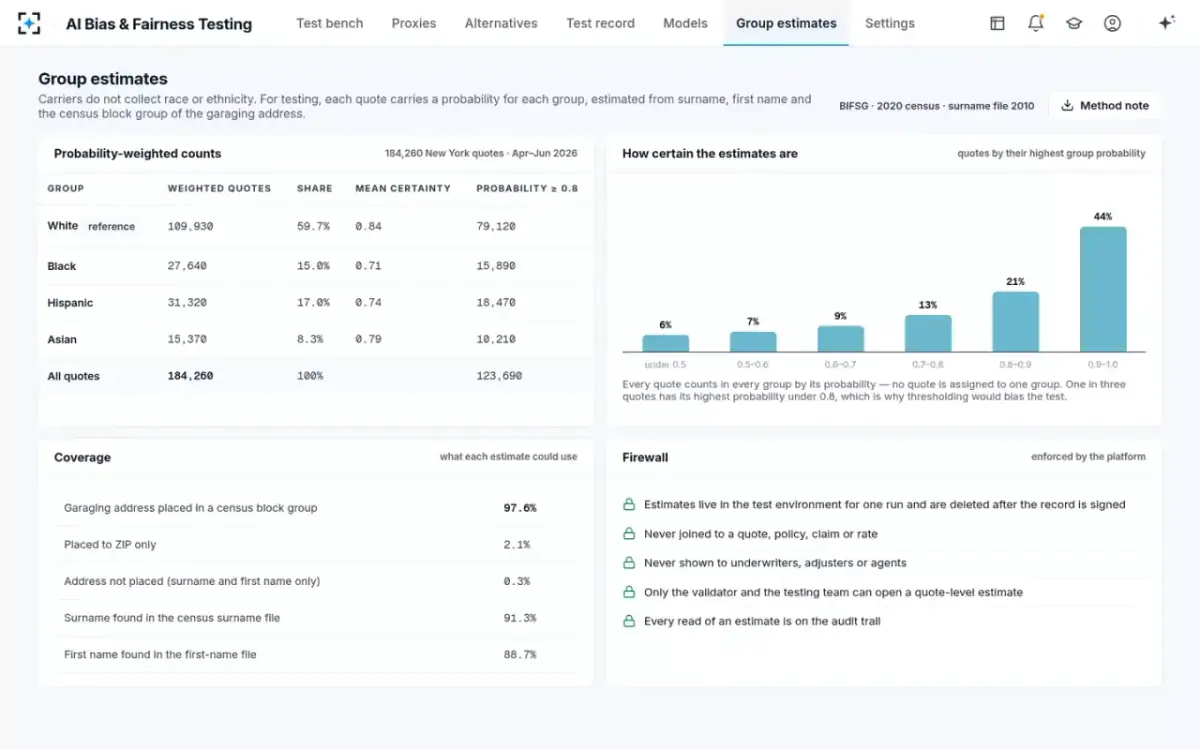
One in three quotes has its highest probability under 0.8. A rule that assigned each quote to its likeliest group would treat those as certain.
How accurate is a race inference model? Strong for four groups, weak for two
Accurate enough to measure gaps for the four largest groups, and not for the two smallest. The CFPB tested BISG on mortgage applicants who reported their race, and measured the correlation between each group's probability and the reported answer. The figure below shows the result. For American Indian or Alaska Native and multiracial applicants the correlations were near zero, which the CFPB summarised as "only an 18% improvement in sorting over a random guess" (CFPB, 2014).
BISG tracks four groups well and two barely at all
Two lessons follow for an insurer. Test groups the method can see: the Colorado draft's four groups are the ones where BISG works. And treat the Black estimate with the most care, because it gains the most from combining clues and still trails the other three. A validator should ask for the same check on the insurer's own data wherever self-reported race exists, for example a block of business where it was collected for another purpose.
Probabilities, not labels: the choice that decides the test
The biggest error in practice is not the estimate but what is done with it. Many analysts set a threshold, say 0.80, call everyone above it a member of the group and everyone else a non-member, and run the test on those labels. The CFPB measured what that does: on its mortgage sample an 80% rule counted 8,314 Hispanic applicants against 11,073 who reported being Hispanic, an undercount of 25%, and 13% of those it did count had reported that they were not Hispanic. Its conclusion: thresholds "can artificially bias, usually downward, estimates of the number of individuals belonging to particular racial and ethnic groups and potentially attenuate estimates of differences in outcomes between groups" (CFPB, 2014).
Later research shows the bias can run either way, which is worse. A 2018 study decomposed the bias of threshold-based disparity estimates, found it "generally upward," and showed that a weighted estimator, which counts each person fractionally, has a negative bias that is "much simpler to analyze and reason about" (Chen et al., 2018). A 2023 study using IRS tax data and the North Carolina voter file found that BISG errors are "often correlated with the outcomes of interest, generally attenuating estimates of racial disparities" (McCartan et al., 2023). And a 2026 study on auto insurance premiums found that regressions run on estimated race blend the true effects of different groups, pulling measured disparities toward the majority group "even when overall classification accuracy is high" (Xin, Hooker and Huang, 2026).
How certain the estimates are on one fictional sample portfolio
Quotes by highest group probability
- Under 0.6 · 13%
- 0.6–0.8 · 22%
- 0.8–0.9 · 21%
- 0.9–1.0 · 44%
The practical rule is short: keep the probabilities, weight every count by them, and report how sensitive the result is to the method. How to calculate an adverse impact ratio when race is a probability works the arithmetic through, quote by quote. Where a finding matters, a validator can go further and compare the weighted result with a bound or a correction from the research above; the point is to know the direction the estimate leans.
The unseen analyst: who touches the estimate, and who never should
The estimate is built by one person, challenged by another, explained by a third and kept from everyone else. In most insurers today those lines are informal. The figure below sets out each seat as it usually works by hand and as it works when AI Bias & Fairness Testing builds the estimate as a separate, logged step.
Four seats around one estimate, before and with AI Bias & Fairness Testing
Today
Builds the estimate in a notebook: cleans names, geocodes addresses, joins the surname and first-name lists, and decides quietly whether to keep probabilities or round them to a label.
With agents
Submits a scored portfolio and reads the coverage report; the estimate is built the same way on every run, with its method and data vintage written down.
Still theirs: The choice of portfolio and the explanation of any input the estimate exposes
Today
Receives a result with the estimate already baked in, and has to rebuild the notebook to know whether a 0.72 ratio came from the model or from the method.
With agents
Sees match rates, geocoding precision and the spread of probabilities before reading a single test result.
Still theirs: The challenge: is this estimate fit for the groups being tested?
Today
Learns at filing time that a spreadsheet of race guesses has been emailed between teams.
With agents
Knows where the estimates live, who opened them and when they are deleted.
Still theirs: The answer when a regulator asks how protected-class status was inferred
Today
Should never see an estimate, and usually has no idea one exists.
With agents
Still never sees one: estimates are not joined to a quote, policy, claim or rate.
Still theirs: Decisions made without any inferred group
The separation is more than tidiness. An estimate joined to a policy file becomes a race field in all but name, and anyone who can query it can use it. The American Academy of Actuaries' 2024 paper on discrimination is blunt about the right use: with estimates from Census data, "it is not appropriate to measure discrimination on a person-by-person basis" (American Academy of Actuaries, 2024). In the solution, estimates live in the test environment for one run, are never joined to a quote, policy, claim or rate, and are deleted once the validator signs; every read of a quote-level estimate is logged.
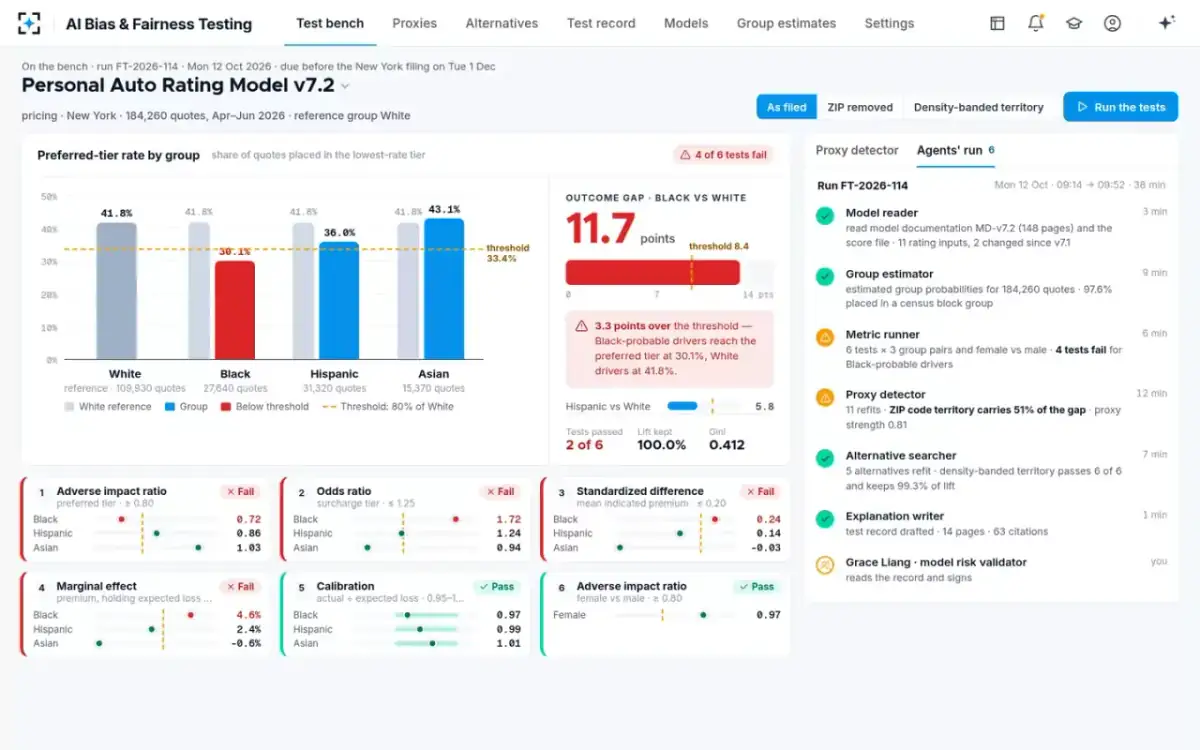
The estimate as one timed step in the agents' run
Where the estimate goes wrong on insurance data
Insurance files break the method in ways mortgage files do not. Five are worth checking before any result is read.
Which address. Auto policies carry a garaging address and a mailing address; homeowners carry a risk address. The test should use the address the model rates, and say so. P.O. boxes and incomplete addresses may only reach ZIP level, which pushes the estimate toward the area average; in the fictional sample above, 2.1% of quotes fell back to ZIP. Missing first names on commercial-style or initial-only entries drop BIFSG back to BISG for those people. Vintage mismatch: a surname list from 2010 and block groups from a later decennial census describe slightly different populations; note the vintage of each.Population mismatch: the lists describe the US population, not your applicants. The CFPB found its proxy overstated minority shares among mortgage applicants for that reason, so a portfolio that skews toward one group will be estimated with a lean.
None of these is a reason not to estimate. Each is a line in the method note that a validator, and later an examiner, will want to see. How banks validate a BISG proxy covers the validation side for lenders, where self-reported data is more often available to check against.
What a regulator asks about your race estimate
Expect the questions to come before the questions about results. New York may examine an insurer's use of external data and AI systems in its regular or targeted examinations, and expects testing documentation to be "available to the Department upon request" (NY DFS, 2024). The checklist below turns that into the items a method note should already answer.
Eight questions a regulator or validator asks about a race estimate
- Which method, and which data vintages?
BISG or BIFSG; the surname list year; the first-name list; the block-group vintage.
- How many people could be estimated?
Surname match rate, first-name match rate, share geocoded to block group, ZIP only, and not placed.
- Probabilities or labels?
If labels, the threshold and how many people it dropped or forced into a group.
- Which groups, and why those?
Groups the method sees well; a stated reason for leaving out groups it cannot estimate.
- How accurate is it on your data?
A check against any block of self-reported race, by group, with the result kept.
- Which address was used?
Garaging, mailing or risk address, matched to what the model actually rates.
- Who could see the estimates?
Named roles, logged access, and proof the estimate was never joined to a decision.
- How sensitive are the findings?
The same tests with a different method or threshold, and whether the conclusion changes.
Once the estimate is sound, the next question is what the test does with it. Planting a proxy and checking that the test finds it is the way to learn whether your estimate and your metrics, together, can see the bias you are looking for. The full test, from estimate to signed report, is on the AI Bias & Fairness Testing page.
Questions people ask
How do you estimate race from surnames alone?
Look up the surname in the Census Bureau's list, which gives the share of people with that name in each of six groups, and use those shares as probabilities. It works poorly on its own for some groups: in the CFPB's test the surname-only correlation for Black applicants was 0.40, against 0.70 once geography was added.
What is the CFPB BISG proxy methodology?
It is the CFPB's 2014 specification of BISG for fair lending analysis of loans where race is not collected: the Census Bureau's surname list, adult population by block group, tract or ZIP depending on how precisely the address geocodes, and Bayes' rule to combine them. The CFPB said the paper "does not set forth a requirement" for how institutions build proxies, and published its code.
Is BIFSG better than BISG?
Usually a little, because the first name adds a clue that belongs to the person rather than a spouse, and fills gaps where the surname is not listed. The first-name list's own author found first names "do not seem to distinguish NH Black applicants well," so the gain is uneven across groups; test both on your data where you can.
What is RAND's Bayesian Improved Surname Geocoding?
It is the original method, published by RAND researchers in 2009 for health care data and later adopted by the CFPB. RAND reports it as 41% more efficient than surnames alone and 108% more efficient than geography alone, with concordance statistics of 0.93 to 0.94 for the four largest groups.
Is it legal for an insurer to infer race?
For testing, regulators expect it. New York's Circular Letter No. 7 says its proxy rules do not stop insurers inferring protected class status "for the limited purpose of the quantitative assessments," and Colorado's draft rule would require BIFSG for life insurers. Using an inferred race in a decision would be another matter entirely.
Should we keep the estimates after the test?
Keep the method, the coverage figures and the aggregate results; think hard before keeping person-level estimates. New York's letter warns it "does not promise the confidentiality" of what insurers submit, given New York's Freedom of Information Law, and a stored estimate can drift into uses no one approved.