To test for AI bias, measure how a model's outcomes differ across protected groups, whether the differences are statistically and practically significant, which inputs produce them, and whether a fairer version of the model keeps its accuracy. For an insurance pricing, underwriting or claims model the groups are almost always estimated from names and addresses, so the test inherits the estimate's errors. The only direct way to know whether your test can see a bias is to plant one: add a synthetic input that tracks a protected group and has nothing to do with risk, give it a known effect, and check that the test finds it at the strength you planted. Botminds' AI Bias & Fairness Testing runs the full test on every model version, which makes that kind of check cheap to repeat; this guide shows how to design it and what one run of it revealed.
Why a bias test built on race estimates needs checking
0.70
correlation between the BISG estimate and self-reported race for Black mortgage applicants, the weakest of the four large groups
CFPB, 2014
25%
undercount of Hispanic applicants when estimates were turned into labels at an 80% threshold
CFPB, 2014
84%
the largest error reduction a correction method achieved, in a study that found standard BISG estimates tend to understate disparities
McCartan et al., 2023
What is AI model bias testing? Measuring gaps the model was never told about
It is a set of measurements of a model's outputs by group: how often each group gets the favourable outcome, how the average premium or score differs, whether the difference survives holding risk constant, and which inputs produce it. New York's Circular Letter No. 7 lists six kinds of metric an insurer may use and encourages insurers to use several of them together (NY DFS, 2024). The model under test usually has no race field at all. The question is whether its other inputs reproduce race's effect anyway.
That is why bias testing differs from ordinary model validation. Accuracy can be checked against what happened: claims arrive, and the model was right or wrong. A disparity estimate has no such ground truth, because the groups themselves are estimated. A test can report a 0.72 adverse impact ratio with three decimal places of confidence and still be wrong about the size of the gap, or about which input causes it.
Why does a bias test need a test of its own?
Because its errors are invisible from the inside, and research shows they are large. The CFPB found that turning race probabilities into labels shrank group counts and could shrink measured disparities (CFPB, 2014). A 2018 study found the opposite direction for disparities estimated from thresholds, with the size of the error depending on the threshold chosen (Chen et al., 2018). A 2023 study found that because BISG's errors move with the outcomes being studied, standard estimates tend to understate racial disparities (McCartan et al., 2023). A 2026 study using auto insurance premiums warned against "treating proxy race as a plug-in substitute in regulatory testing" (Xin, Hooker and Huang, 2026).
The standards bodies say the same thing in general terms. NIST's AI Risk Management Framework asks not only that "fairness and bias ... are evaluated and results are documented" (MEASURE 2.11) but that the "effectiveness of the employed TEVV metrics and processes" (test, evaluation, verification and validation) is itself "evaluated and documented" (MEASURE 2.13) (NIST AI RMF 1.0). NIST's work on bias adds that "it is not possible to achieve zero risk of bias in an AI system" (NIST SP 1270, 2022). A test whose sensitivity has never been measured cannot say how much risk it leaves.
How to plant a proxy: the seeded test in six steps
A seeded test copies the real portfolio, adds a bias of known size and direction, and runs the unchanged test pipeline over it. The planted input should look like the inputs that cause trouble in practice: a geographic score that rises with a group's share of the local population and carries no information about losses. Run it at more than one strength, and once at zero, so you can see both whether the test finds the bias and whether it invents one.
Six steps to plant a proxy and read what the test reports
- Copy the test portfolio, never the live one
Same quotes, same estimates, same data cut; the seeded copy stays in the test environment.
- Build a synthetic input with no risk content
For example an area score equal to the block group’s estimated share of one group plus noise. Confirm it does not predict losses.
- Inject it at a known strength
Shift the model score by a fixed amount per unit of the planted input, and compute the true gap it adds using a group definition you control.
- Re-score and run the full test, unchanged
Same estimator, same metrics, same thresholds and the same driver decomposition as a real run.
- Compare reported with planted
Did the gap grow by the planted amount? Did the decomposition name the planted input, and with what share?
- Repeat at zero and at two more strengths
At zero nothing should change; at higher strengths the error should stay proportionate. Keep the results with the test method.
What one seeded test shows: the estimate moves the gap, in both directions
We ran the design above as a simulation on 200,000 synthetic drivers in 500 areas, two groups, with true group known to us and hidden from the test. The test saw only a BISG-style probability built from a surname clue and each area's composition; across the population it correlated 0.83 with the true group, in the range the CFPB reports for the groups BISG estimates well. The preferred tier depended on a legitimate individual factor that differs by group, a legitimate area loss factor, and the planted area score. The planted score added 5.6 points to the true gap. The figure shows what each way of using the estimate reported.
A planted proxy added 5.6 points to the gap; each estimate reported something else
Two things stand out. Every method found the planted proxy, so the test can see an area-based bias of this size. But the probability-weighted method, which is the right default, overstated the planted part by about an eighth, because the estimate draws on the same area composition that the planted input tracks. Labelling drivers at an 80% threshold overstated it by three quarters.
The same runs showed the opposite error for the legitimate individual factor. Its true gap of 9.4 points was measured at 7.9 by the weighted estimate, about 16% low, and at 11.9 by the 80% labels. The shrinkage matches the research on weighted estimates; the inflation of the area-based effect is what the planted design adds. In practice, a decomposition built on estimates will lean toward blaming geographic inputs. A seeded test tells you by how much, on your data, so the explanation can say so.
Reading a seeded test honestly
What a passing seeded test lets you say: The test detects an area-based proxy of this size on this portfolio, and reports its share within a stated margin.
What it does not let you say: That it would detect every kind of bias, including ones that live inside a neighbourhood.
What a passing seeded test lets you say: Which way the estimator leans for area-based and individual-level effects.
What it does not let you say: The exact true gap for any real input.
What a passing seeded test lets you say: Why the test keeps probabilities rather than labels, with the numbers to show it.
What it does not let you say: That probabilities are unbiased; they are less biased, in a predictable direction.
What a passing seeded test lets you say: The groups and outcome definitions you planted against.
What it does not let you say: Groups the estimate cannot see well, such as American Indian or Alaska Native.
How to measure model bias: six numbers on one model
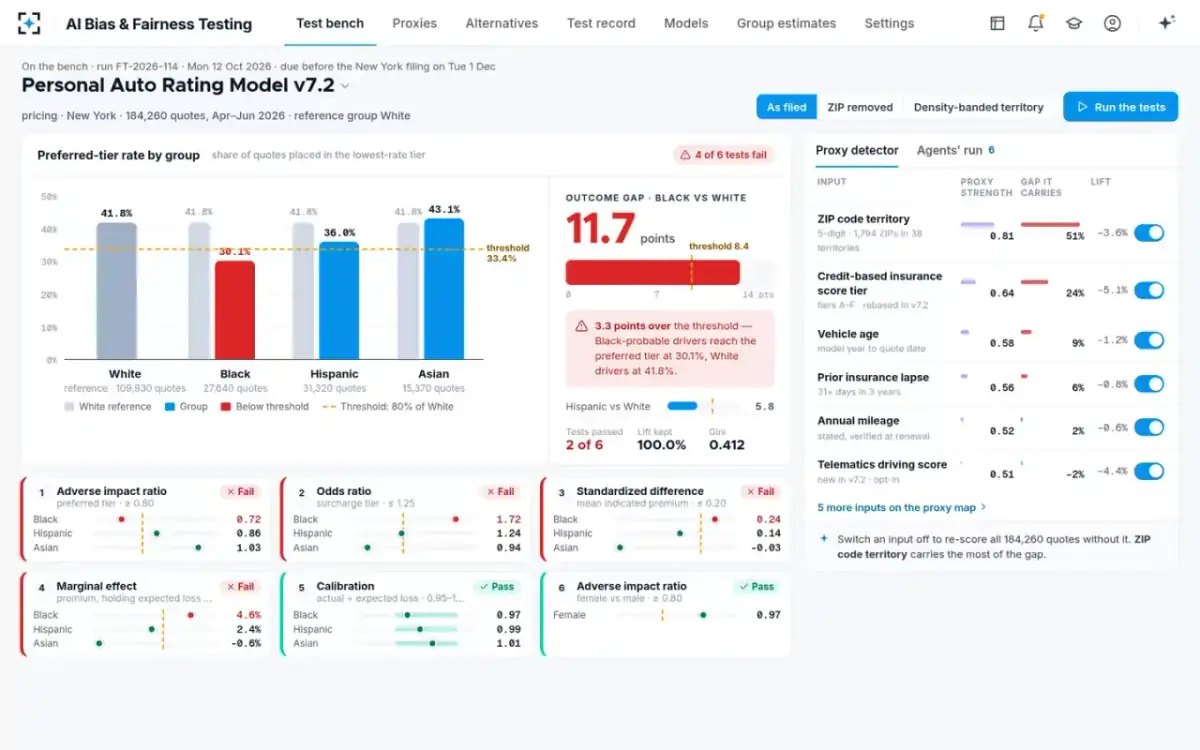
Measure several things at once, because each answers a different question. On a fictional insurer's personal auto rating model, tested on 184,260 New York quotes, the six tests in its standard read as follows for Black-probable drivers against White drivers. The adverse impact ratio on the preferred tier is 0.72 (30.1% against 41.8%). The odds ratio of landing in the surcharge tier is 1.72. The standardized difference in indicated premium is 0.24. The marginal effect of group on premium, holding expected loss constant, is 4.6% of premium. Calibration, actual over expected loss, is 0.97. And the female-to-male adverse impact ratio is 0.97.
Four of the six fail the insurer's thresholds. Calibration passes, which says the model's prices track losses for both groups; the others say the outcomes still differ. That combination is the classic signature of a predictive input that also tracks group membership. When the six metrics disagree works through why they diverge and how to write down which result governs.
The six tests on one bench in AI Bias & Fairness Testing
How to test a model for bias in Python, and what the code leaves out
The arithmetic is short. With a probability for each group, every rate is a weighted average, and an adverse impact ratio is a ratio of two of them. The few lines below are the core of it; everything else in a production test is data handling, significance and decomposition.
A probability-weighted adverse impact ratio, in five lines
rate_b = (p_black * preferred).sum() / p_black.sum()
rate_w = (p_white * preferred).sum() / p_white.sum()
air    = rate_b / rate_w          # adverse impact ratio
gap    = rate_w - rate_b          # in rate points
# repeat per group pair, per outcome, per model versionFree libraries cover more. Aequitas, an open-source bias and fairness audit toolkit, computes common bias metrics across subgroups (Saleiro et al., 2018); fairmodels does the same in R, with mitigation methods (Wiśniewski and Biecek, 2021); the CFPB publishes the code for its race estimate. Their authors are candid that the field has not settled which metric to use, and the Academy of Actuaries warns that prebuilt tools can miss discrimination and do not replace expert judgment (Academy, 2024).
What the code leaves out is everything around the arithmetic: which thresholds apply and who approved them, how to handle groups the estimate cannot see, which input drives a failure, whether a fairer model exists, and the written reasoning New York expects insurers to keep. Cost per model-year compares what a notebook, a consultant and a tool each leave to your team.
What is model bias? Statistical bias versus unfair discrimination
The word covers two different things, and a test must say which it measures. Statistical bias is a model's average miss: the Casualty Actuarial Society's example is a model that predicts $1,500 of severity where the truth is $1,000, a bias of $500, or 50% (Mosley and Wenman, CAS, 2022). Unfair discrimination is about who the model's errors and outcomes fall on. A model can be statistically unbiased overall and still produce outcomes that differ by group beyond what risk explains.
The two pull against each other. The same CAS paper warns that with statistical and demographic bias, "minimizing one will often increase the other." NIST's bias work sorts the sources into three categories, "systemic, statistical, and human" (NIST SP 1270). A seeded test belongs to the statistical category: it checks the instrument, not the systemic and human sources behind the data.
How to test AI for bias and accuracy at the same time
Test them together, because a fix for one can break the other. Two accuracy measures belong in every bias test: calibration by group, which checks that prices track losses for each group, and the share of the model's predictive lift that a fairer version keeps. New York expects each variable to have "a clear, empirical, statistically significant, rational, and not unfairly discriminatory relationship" to risk (NY DFS, 2024), which is an accuracy test and a fairness test in one sentence.
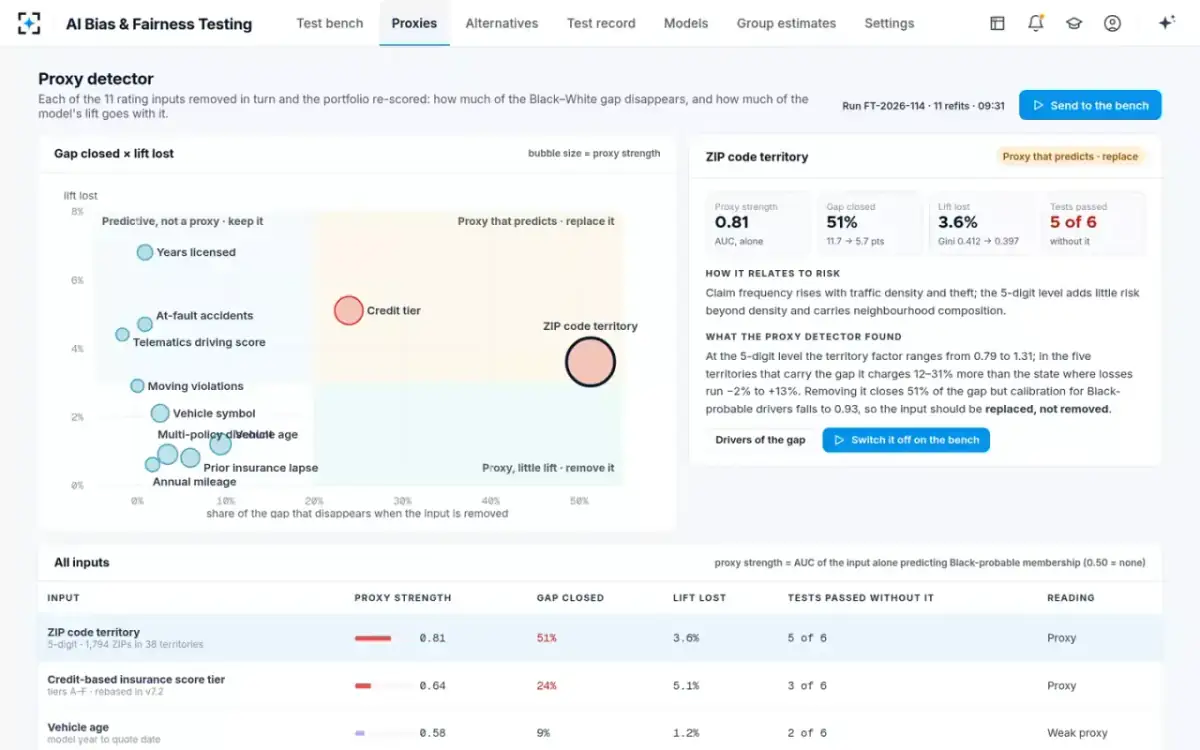
The fictional rating model shows why. Switching its ZIP code territory off closes 51% of the gap and passes five of six tests, but calibration for Black-probable drivers falls to 0.93 and the model keeps only 96.4% of its lift, below the insurer's 98% floor. Removing the input made the model less accurate for the very group the change was meant to help. A density-banded version of the same input kept 99.3% of the lift and passed all six tests.
What the proxy detector measures for each input
How often to test for bias, and when to test the test
Test the model before production, after every material change and on a regular cadence; New York asks for exactly that, and for testing of model outputs "at least annually" (NY DFS, 2024). The Academy of Actuaries recommends scanning algorithms, data and results on a schedule, at least once a year (Academy, 2024).
Test the test less often but deliberately: when the estimation method, its data vintage or the metric definitions change, when a new kind of input enters the models, and once a year alongside the annual review. Keep the results with the method note, so a validator reading a real finding can see how far the instrument is known to lean. Before any of this, the estimate itself needs to be sound: how to estimate race from surname and ethnicity covers the method. The test each model receives is on the AI Bias & Fairness Testing page.
Questions people ask
Is there free software for bias testing AI models?
Yes. Open-source libraries such as Aequitas (Python) and fairmodels (R) compute standard bias metrics, and the CFPB publishes code for its race estimate. They do the arithmetic; they do not choose thresholds, find a less discriminatory alternative or produce the documentation regulators ask for.
What is bias testing in AI?
It is measuring whether an AI system's outputs differ across protected groups more than the relevant risk explains, and finding why. For insurance models that means metrics such as the adverse impact ratio, odds ratios, standardized mean differences and marginal effects, plus an analysis of which inputs drive any gap.
How do you measure model bias when race is not collected?
Estimate each person's probability of belonging to each group from surname, first name and address, then weight every count by those probabilities. Keep the probabilities rather than labels: the CFPB found an 80% labelling rule undercounted one group by 25%, and our simulation found labels overstated a planted bias by about three quarters.
How big does a bias have to be for a test to find it?
It depends on the portfolio size, how well the groups are estimated and where the bias lives. That is the point of a seeded test: in our simulation a planted area-based input adding 5.6 points to a gap was found by every method, but its size was overstated. Plant at several strengths on your own data to find the floor.
Does removing race from a model remove bias?
No. In the Casualty Actuarial Society's worked example on French auto data, bias remained in some areas after the protected attribute was dropped from the model, because other inputs carried the same signal. That is why tests look at outcomes, not at the input list.
Can a bias test be wrong?
Yes, in both directions, because the groups are estimated. Research finds threshold-based estimates generally overstate disparities and weighted estimates tend to understate differences inside areas. A seeded test measures the lean on your data so a finding can be reported with it.