To calculate an adverse impact ratio, divide the rate at which a protected group receives the favourable outcome by the rate for the comparison group: if 30.1% of one group reaches a preferred pricing tier and 41.8% of the other does, the ratio is 30.1 ÷ 41.8 = 0.72. When race is not collected, as in almost all insurance data, each quote carries an estimated probability of belonging to each group, so each rate is a weighted average: the sum of probability × outcome, divided by the sum of probabilities. Botminds' AI Bias & Fairness Testing computes every rate this way, for every group pair, and never assigns a quote to a single group. The rest of this guide works an example by hand, shows the Excel formulas, and explains three choices that change the answer: the denominator, the outcome and the treatment of probabilities.
"A selection rate for any race, sex, or ethnic group which is less than four-fifths ( 4 ⁄ 5 ) (or eighty percent) of the rate for the group with the highest rate will generally be regarded by the Federal enforcement agencies as evidence of adverse impact"
Uniform Guidelines on Employee Selection Procedures, 29 CFR 1607.4(D) (1978)
How do you calculate adverse impact ratio? The formula
The ratio is the protected group's rate of favourable outcomes divided by the reference group's rate. New York's Circular Letter No. 7 describes the measure as "analyzing the rates of favorable outcomes between protected classes and control groups to identify any disparities" (NY DFS, 2024). A ratio of 1.00 means equal rates; below 1.00, the protected group fares worse.
Three definitions have to be fixed before the arithmetic. The favourable outcome: for a rating model, landing in the preferred tier; for underwriting, approval; for a claims model, not being referred for investigation. The comparison group: a fixed reference group such as White applicants, or, under the employment rule, whichever group has the highest rate. And who counts: with reported race, each person counts once in one group; with estimated race, each person counts in every group by their probability.
With probabilities, the rate for group g is Σ(probability of g × outcome) ÷ Σ(probability of g), summed over every quote. Two drivers each 0.5 likely to be Black and 0.5 likely to be White add one person to each group's count, the convention the CFPB uses when it totals its estimates (CFPB, 2014).
Adverse impact ratio calculation example, with probability weights
Six fictional quotes show the mechanics. Each has an estimated probability of the driver being Black and of being White (the rest belongs to other groups), and whether the quote reached the preferred tier.
Six quotes, worked by hand: a weighted ratio of 0.60
Black, weighted count 0.90 + 0.70 + 0.40 + 0.10 + 0.05 + 0.20 = 2.35
Black, weighted preferred 0.70 + 0.10 + 0.05 = 0.85, so the rate is 0.85 ÷ 2.35 = 36.2%
White, weighted count 0.08 + 0.25 + 0.55 + 0.85 + 0.92 + 0.70 = 3.35
White, weighted preferred 0.25 + 0.85 + 0.92 = 2.02, so the rate is 2.02 ÷ 3.35 = 60.3%
Adverse impact ratio = 36.2 ÷ 60.3 = 0.60
Now treat the same six quotes the way many analysts do. Label each driver with their likeliest group: A and B become Black, C, D, E and F become White. Black drivers reach the preferred tier at 1 in 2, White drivers at 2 in 4: a ratio of 1.00, no disparity at all. Label only drivers above 80% probability: A is the only Black driver and was not preferred; D and E are the only White drivers and both were: a ratio of 0. One portfolio, three methods, three answers. Six quotes exaggerate the swing, but the direction of the problem is real.
Four fifths rule: where the 0.80 comes from, and why it is not an insurance rule
The 0.80 line comes from the federal Uniform Guidelines on Employee Selection Procedures, adopted in 1978 for hiring and promotion (29 CFR 1607.4(D)). It is a rule of thumb for enforcement agencies, hedged in the same paragraph: "Smaller differences in selection rate may nevertheless constitute adverse impact, where they are significant in both statistical and practical terms," and "Greater differences in selection rate may not constitute adverse impact where the differences are based on small numbers and are not statistically significant."
Insurance analysts borrowed it. The Casualty Actuarial Society's 2022 research paper tests a pricing model "using the 80% rule, which requires that the value of the metric for the unprivileged group be at least 80% of that for the privileged group," and reads the inverse as "no greater than 1.25" (Mosley and Wenman, CAS, 2022). The American Academy of Actuaries calls it "a common measure of disparate impact" and works a hiring example: 1 of 6 women interviewed against 3 of 10 men gives 16.7% ÷ 30.0% = 55.6%, a flag (Academy, 2024).
No insurance statute or adopted regulation sets 0.80. New York leaves pass marks and standards of proof to insurers (NY DFS, 2024), and Colorado's draft life rule, still unadopted, would use a different test altogether: a regression marginal effect of five percentage points. An insurer that uses 0.80 should say it chose the line, and why.
Which group goes in the denominator?
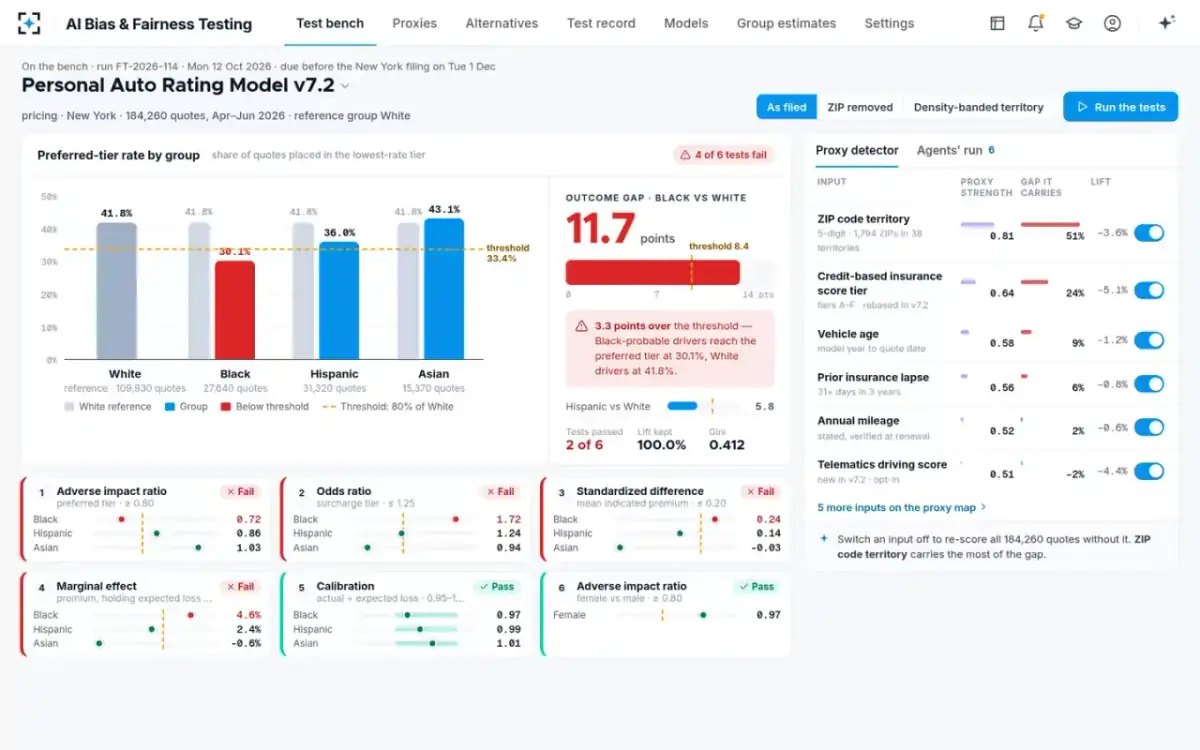
The employment rule uses "the group with the highest rate"; most insurance tests use a fixed reference group, usually White applicants. The choice matters whenever another group outperforms the reference. On a fictional personal auto rating model tested on 184,260 New York quotes, Asian drivers reach the preferred tier at 43.1%, above White drivers at 41.8%, so the two conventions give different ratios for every group.
The same preferred-tier rates give lower ratios against the highest-rate group
Fix the convention in the testing standard before any test runs, and apply it to every model. Switching between them after seeing the results is the kind of choice a validator should be able to find in the change history.
Every rate on the bench is probability-weighted
Favourable or adverse outcome: the same gap, two verdicts
The ratio is not symmetric, so the outcome you measure can change the verdict. On the same fictional model, 69.9% of Black-probable drivers and 58.2% of White drivers do not reach the preferred tier. The ratio of those adverse rates is 69.9 ÷ 58.2 = 1.20, which passes the CAS paper's 1.25 ceiling, while the favourable-outcome ratio of 0.72 fails the 0.80 floor.
One gap of 11.7 points, measured two ways
Ratio of favourable outcomes: Preferred tier: Black-probable 30.1%, White 41.8%.
Ratio of adverse outcomes: Not preferred: Black-probable 69.9%, White 58.2%.
Ratio of favourable outcomes: 30.1 ÷ 41.8 = 0.72
Ratio of adverse outcomes: 69.9 ÷ 58.2 = 1.20
Ratio of favourable outcomes: Below 0.80: fails.
Ratio of adverse outcomes: Below 1.25: passes.
Ratio of favourable outcomes: Selection-style outcomes: approval, preferred tier.
Ratio of adverse outcomes: Adverse decisions: declines, surcharges, referrals.
The fix is to fix the outcome in advance and report both ratios where the outcome is not naturally one-sided. New York lists "Denials Odds Ratios" alongside the adverse impact ratio, and odds have a useful property here: the odds ratio of the adverse outcome is the exact inverse of the odds ratio of the favourable one, so the verdict does not depend on which you pick. What to do when the metrics disagree follows this through all six of the letter's measures.
Adverse impact ratio formula in Excel
With one row per quote, the weighted rates are two SUMPRODUCTs. Put the probability of the protected group in column B, the probability of the reference group in column C and the outcome (1 for preferred, 0 otherwise) in column D.
Adverse impact ratio with probability weights, cell by cell
| Cell | What it holds | Formula |
|---|---|---|
| F2 | Protected group’s weighted rate | =SUMPRODUCT(B2:B7, D2:D7) / SUM(B2:B7) |
| F3 | Reference group’s weighted rate | =SUMPRODUCT(C2:C7, D2:D7) / SUM(C2:C7) |
| F4 | Adverse impact ratio | =F2/F3 |
| F5 | Gap in rate points | =(F3-F2)*100 |
| F6 | Four-fifths flag | =IF(F4<0.8, "Below 0.80", "0.80 or above") |
| F7 | Effective count for the protected group | =SUM(B2:B7)^2 / SUMSQ(B2:B7) |
A spreadsheet works for one pair of groups on one outcome. It becomes fragile when the portfolio has hundreds of thousands of rows, several groups, several outcomes and a new model version every quarter, and it says nothing about why a ratio fails.
Is the gap statistically significant?
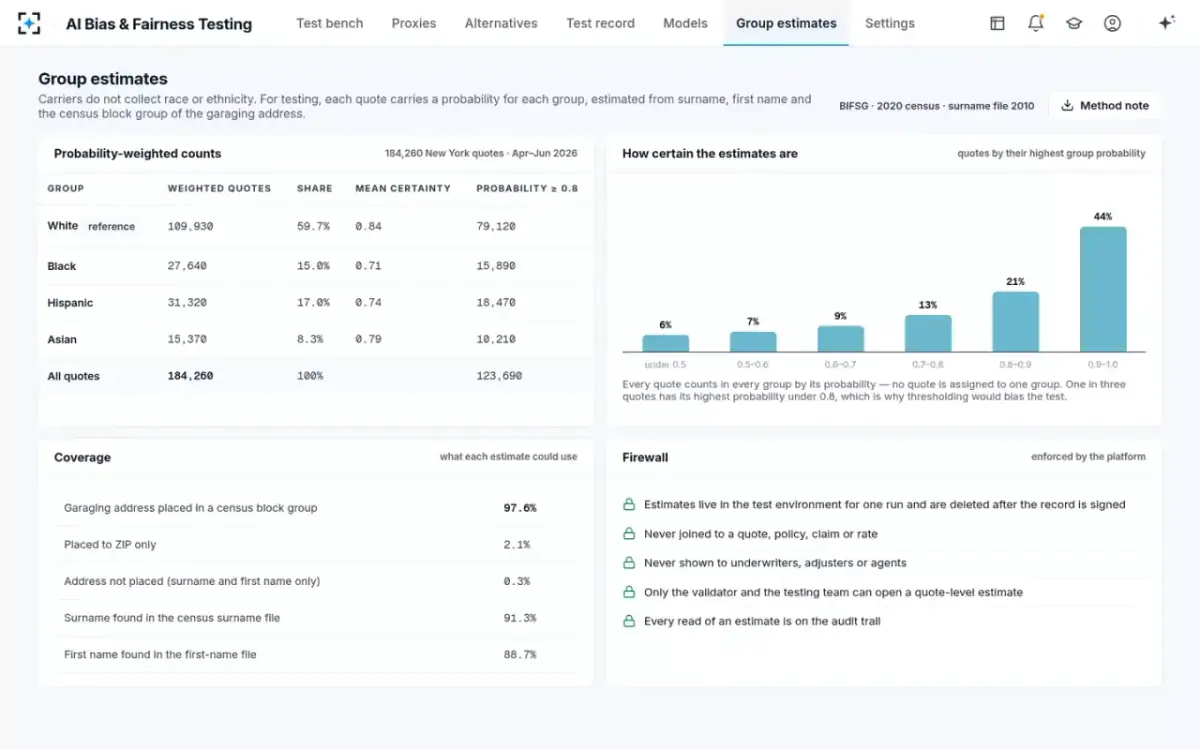
On an insurance portfolio, almost certainly, which is why significance alone settles little. The Academy notes that the Department of Labor treats an absolute z-score of 2 or more as significant in its disparity checks (Academy, 2024). A two-proportion z-test on the fictional model's weighted counts (27,640 Black-probable and 109,930 White quotes, rates of 30.1% and 41.8%) gives a z of about 36, our arithmetic, before any allowance for the weights. An allowance that halved the effective sample would still leave about 25.
So the useful questions are practical. Is the gap large in rate points or premium? Does it survive holding expected loss constant? And which input causes it? NIST notes that courts have used significance testing "to assess whether the challenged practice likely caused the disparity and was not the result of chance" (NIST SP 1270); on large books, chance is rarely the explanation, and the work moves to the cause.
The weighted counts behind every ratio
A raw ratio or a controlled one?
The adverse impact ratio is a raw comparison: it does not hold anything constant. Two groups can differ in the preferred-tier rate because they differ in driving records, vehicles or claims history, and the ratio will show the gap either way. That is not a flaw, it is the definition; but it means a failing ratio is the start of an inquiry.
Controlled measures answer the next question. New York's list includes marginal effects, which measure how a small change in one variable moves the chance of an unfavourable outcome, and Colorado's draft life rule is built entirely on them: a logistic regression of approval on estimated race with "policy type, face amount, age, gender, and tobacco use" as permitted controls, flagging a statistically significant difference of five percentage points or more. In the fictional auto model, the marginal effect of being Black-probable on premium, holding expected loss constant, is 4.6% of premium, above the insurer's 3.0% threshold. A raw ratio and a controlled effect that both fail make a stronger finding than either alone.
Why labels distort the ratio, and probabilities distort it less
Turning probabilities into labels throws information away and moves people between groups. The CFPB found that an 80% labelling rule undercounted Hispanic applicants by a quarter and warned that it could shrink measured differences (CFPB, 2014). A 2018 study of disparity estimation found threshold methods usually overstated disparities, by an amount that depended on the threshold, while a weighted estimator erred in the other direction, and more predictably (Chen et al., 2018).
Weighted ratios are the better default, not a perfect one. Their error has a known direction for many designs, which means a validator can describe it. How the probabilities are estimated and how to measure the remaining lean by planting a proxy cover the two steps on either side of the ratio.
Adverse impact ratio in fair lending and in insurance
The ratio is the same; the data around it differs. Mortgage lenders collect applicants' race and ethnicity under the Home Mortgage Disclosure Act, so their ratios often start from reported data. For other credit, where lenders are generally barred from asking, the CFPB uses the same surname-and-geography estimate described here (CFPB, 2014). Insurers are usually in the second position.
Insurance tests also ask more of the ratio. A failing ratio leads, in New York's sequence, to a search for "a legitimate, lawful, and fair explanation" and then for "a less discriminatory alternative" (NY DFS, 2024). The ratio opens the inquiry; it does not close it. AI Bias & Fairness Testing reports the ratio for every group pair beside the five other tests in the insurer's standard, then traces any failure to its inputs; the full sequence is on the AI Bias & Fairness Testing page.
Questions people ask
What is the adverse impact ratio formula?
The protected group's favourable-outcome rate divided by the comparison group's rate. With estimated race, each rate is Σ(probability × outcome) ÷ Σ(probability) over all quotes, so every quote contributes to every group in proportion to its probability.
How do you use the four fifths rule as a calculator?
Compute each group's rate, divide by the highest group's rate, and flag any result below 0.80. That is the employment rule in 29 CFR 1607.4(D); for insurance, use the comparison group and threshold your own testing standard sets, and check statistical and practical significance before drawing a conclusion.
What is the disparate impact ratio formula?
It is the same calculation under another name: the unprivileged group's rate of the favourable outcome divided by the privileged group's. Some toolkits report its inverse, in which case the usual line is 1.25 rather than 0.80, as in the Casualty Actuarial Society's 2022 paper.
What is adverse impact ratio (AIR)?
AIR is a measure of how much less often one group receives a favourable outcome than another, expressed as a ratio of rates. It is the first of the six metrics New York's Circular Letter No. 7 lists for testing underwriting and pricing models.
Can the adverse impact ratio be above 1?
Yes: a ratio above 1.00 means the protected group receives the favourable outcome more often than the comparison group. In the fictional model above, Asian drivers' ratio against White drivers is 1.03.
How many quotes do you need for a reliable ratio?
Enough that the group's effective count, not its raw count, supports a significance test. With probability weights, the effective count is (Σp)² ÷ Σp², which is lower than the number of quotes; the employment guidelines warn that large differences based on "small numbers" may not show adverse impact at all.