Default rates by credit rating are the long-run averages the rating agencies publish for each of their own grades — in the table the Federal Reserve Bulletin reprinted, 0.25% a year for Standard & Poor's BBB, 1.17% for BB, 5.39% for B and 19.96% for CCC. They are the right yardstick for a bond, and the wrong one for your grade 4, because the agencies rate through the cycle and almost every commercial bank rates the borrower's condition today. Back-testing a bank's own scale is a different and harder exercise: it asks whether your grades rank-ordered your defaults, and whether the ranking holds inside each region and each industry rather than only across the book. Botminds' Risk Rating Validation does the part of that work that defeats a two-person credit risk team — re-scoring every rated loan nightly on the bank's own scorecard, pairing each borrower with look-alikes graded by other lenders, and keeping the default experience of each grade in front of the people who set the grades.
The bank figures on this page come from a working demonstration on sample data: Kestrel Valley Bank, a fictional commercial lender with 2,305 rated loans and $13.67B of commitments. The default-rate tables are external, carry their own dates, and are nobody's forecast.
Three published default rates, and one bank's own
0.25%
a year, Standard & Poor's BBB, 1981–94, as reprinted by the Federal Reserve Bulletin
1.17%
a year, Standard & Poor's BB — more than four times BBB, one category down
5.39%
a year, Standard & Poor's B — over twenty times BBB, two categories down
1.9%
over three years, the sample bank's own grade 4 loans, against 0.8% expected
What published default rates by credit rating actually measure
An agency default table counts, for a pool of bonds carrying a grade at the start of a year, how many issuers defaulted within that year, averaged over decades. Three properties follow from that construction, and all three matter when the table is borrowed.
It is an average over cycles, not a forecast for next year. The Moody's and Standard & Poor's columns in the Bulletin's table span 1970–95 and 1981–94 respectively; each contains recessions and expansions, and a single year inside the sample can be several times the average. It is an issuer-level rate, not a loss rate: default is not loss, and the recovery on a secured middle-market term loan has nothing to do with the recovery on an unsecured bond. And it is a rate for the agencies' own population — large, public, mostly rated because they issue in the public markets — which has almost no overlap with the borrowers on a commercial bank's rated book.
Default rate by agency grade: the rise is not a straight line
The shape is the transferable lesson. "Risk tends to increase nonlinearly on both bank and agency scales," Treacy and Carey wrote after interviews at more than fifteen major US banking groups; default rates "are low for the least risky grades but rise rapidly as the" scale worsens (Federal Reserve Bulletin, November 1998). A one-notch error among the safest grades costs little in expected loss. The same one-notch error at the bottom of the scale can be the difference between a loan nobody looks at twice and a loan on a watch list.
Why is your grade 4 not a BBB?
Because the two grades answer different questions over different horizons. The agencies rate through the cycle: an issuer whose earnings dip in a recession is not automatically downgraded, because the grade is meant to express a view that survives the dip. Banks, almost without exception, do not. "Every bank we interviewed bases risk ratings on the borrower's current condition," the Bulletin's authors reported, and they found the time horizon in raters' minds split three ways — "about 25 percent rating the borrower's risk over a one-year period, 25 percent rating over a longer period such as the life of the loan, and the remaining 50 percent having no" settled horizon at all.
A point-in-time scale and a through-the-cycle scale produce different numbers for the same borrower at the same moment, and the difference is systematic rather than random: in a downturn the bank downgrades and the agency does not, so a bank grade mapped to an agency grade in a good year will be mapped to a different one in a bad year. The Bulletin works the arithmetic through a hypothetical bank and concludes that the common mapping approach "can produce materially biased estimates of PD for internal grades", bias that "can seriously distort internal analysis of business line profitability, loan loss reserves, and capital allocation". Borrow the table for a sense of scale; do not borrow it as your own expected loss. What a grade on your scale means is a question your own definitions answer, and the words behind each grade are where that answer has to be written down.
How do you back-test a 1–9 scale?
Take every loan that carried a grade on a chosen date, follow each one forward for a fixed window, and count defaults by the grade held at the start. That is the whole method; everything difficult is in the definitions. The regulator's expectation is plainer than most banks assume. For systems not tied to statistical probabilities — which is nearly every commercial bank scorecard — the OCC's expectation is that "banks should be able to show that credits with more severe ratings exhibit higher defaults and losses" (Comptroller's Handbook, Rating Credit Risk). Not that grade 5 defaults at 3.0%. That worse grades default more.
Four definitions decide whether the answer means anything, and each should be written down before the first query runs. What counts as a default: non-accrual, 90 days past due, charge-off, a troubled restructuring, or bankruptcy — pick one and apply it to every year. Which grade is tested: the grade at the start of the window, not the grade the loan ended with, or the test will prove only that your bank downgrades loans before they default. What happens to loans that leave: a borrower that repays in month 14 was never at risk for the full window and should be weighted by the time it was actually exposed. And which population: new originations graded at closing behave differently from a seasoned book, so report them apart.
One loan, three years, and the grade the back-test is actually testing
- Grade 5, unchanged14 months
- Regraded 5 → 6 at the March 2024 annual review9 months
- Regraded 6 → 8 after the covenant breach7 months
- On non-accrual from July 2025; default counted in December 20256 months
- The grade at the start of the window owns the default for all 36 months36 months against grade 5
- Against 514 mo
- Against 69 mo
- Against 813 mo
The two lanes at the foot of that figure are not a technicality. A bank whose credit officers move grades quickly will, on the cohort test, look as though its early grades were wrong; on the exposure test it will look as though its late grades were right. Both are true. Report both, and the pair tells you something neither tells you alone — whether the scale separates risk, and whether the people using it act on what it says.
Rank-ordering first, calibration second
Validation of a rating scale splits into two questions that are usually confused, and the Basel Committee's own study of the problem separates them in its first paragraph: "For the validation of PDs, we differentiate between two stages: validation of the discriminatory power of a rating system and validation of the accuracy of the PD quantification (calibration)" (Basel Committee, Working Paper No. 14). The order matters for a bank with a judgemental scale, because only the first question is answerable with the data most banks have.
The two questions a back-test answers, and the way each one fails
Discriminatory power: Do worse grades default more often than better grades?
Calibration: Does grade 5 default at the rate the bank says grade 5 defaults at?
Discriminatory power: Enough defaults to rank the grades — tens, not thousands. Ties and small inversions at the top of the scale are expected.
Calibration: Enough defaults per grade to estimate a rate with a usable confidence interval, which on a mid-size commercial book almost never exists above grade 6.
Discriminatory power: A grade that defaults more than the grade below it, repeatedly and in more than one segment. That is a definition problem or a people problem, not noise.
Calibration: Observed rates systematically above the expected ones. The study warns this "can happen easily for otherwise well-calibrated rating systems" because defaults in a portfolio are correlated.
Discriminatory power: That the scale rank-orders risk, with the inversions named and explained.
Calibration: A range, a direction of travel, and the years it rests on — not a point estimate presented as a measurement.
The correlation point deserves a sentence of its own, because it is the most common way a well-meaning back-test produces a false alarm. Defaults are not independent events: borrowers in one industry and one region fail together. A test built on the assumption of independence will reject a perfectly sound grade in any year when the local economy turns, and the paper says so directly — observed default rates "can systematically exceed the critical PD values if these are determined under the assumption of independence of the default events". A validator who fails a scale on one bad year has measured the year, not the scale.
The migration matrix, and what a double downgrade tells you
A migration matrix is the same cohort, read sideways: grade at the start of the year down the side, grade at the end across the top, each row summing to 100%. The diagonal is stability. Everything to the right of it is deterioration, and the cells two or more columns to the right are the ones to read first.
A one-year migration matrix, with the double downgrades marked
| Grade at 1 January | Better | 4 | 5 | 6 | 7 | 8 | Default |
|---|---|---|---|---|---|---|---|
| 4 | 4.0% | 85.0% | 8.0% | 2.0% † | 0.6% † | 0.3% † | 0.1% † |
| 5 | 1.0% | 7.0% | 81.0% | 8.0% | 2.0% † | 0.7% † | 0.3% † |
| 6 | 0.4% | 2.0% | 9.0% | 78.0% | 7.0% | 2.6% † | 1.0% † |
| 7 | 0.2% | 1.0% | 4.0% | 11.0% | 68.0% | 12.8% | 3.0% † |
| 8 | 0.1% | 0.4% | 2.0% | 6.0% | 9.0% | 71.5% | 11.0% |
The OCC asks for exactly this reading. Among the things a rating system's reporting should produce, the handbook lists "the volume of credits whose ratings changed more than one grade (i.e., 'double downgrades')" and, in the next line, "seasoning of ratings (the length of time credits stay in one grade)". The two belong together. A double downgrade is usually not a borrower falling two grades in a week; it is a grade that stopped being refreshed, discovered late. Seasoning tells you where the next one is hiding: a cohort of grade 4 loans whose average time-in-grade is four years, in a book whose annual reviews are nominally annual, is a double downgrade waiting for someone to open the file.
Rating changes, upgrades per downgrade and the back-test, on one screen in Risk Rating Validation
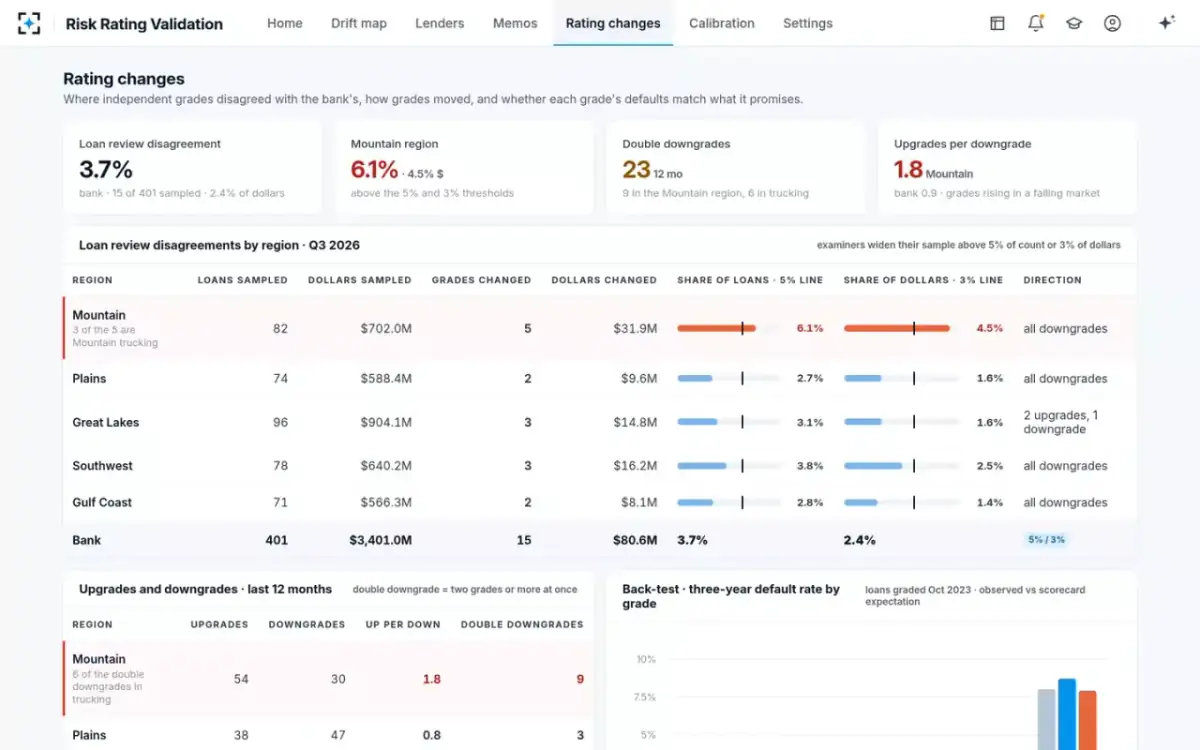
Three numbers on that screen do different jobs. The disagreement rate is a quality measure of the grades themselves. The upgrade-to-downgrade ratio is a measure of direction, and a region running at twice the bank's rate in a flat quarter is making a statement about its lenders, not about its borrowers. The default back-test is the slow, honest one: it cannot be argued with, and it arrives three years late. A credit risk function that waits only for the third has given up the first two years.
How many years and how many defaults you need before the test means anything
Enough defaults to see a pattern, which for most commercial books means pooling. The Basel framework sets the floor for banks on the internal ratings approach — data on realised defaults and migrations must be kept so that the predictive power of the rating system can be tracked — and expects the resulting reporting to include "risk profile by grade, migration across grades, estimation of the relevant parameters per grade, and comparison of realised default rates … against expectations" (Basel Framework, CRE36). Few mid-size US banks are on that approach, but the shape of the reporting is the right shape regardless of who is obliged to produce it.
The practical arithmetic is unforgiving. A bank with 2,305 rated loans and a through-the-book default rate near 1% produces on the order of twenty defaults a year. Spread those over seven pass grades and four regions and most cells contain zero. The Basel Committee's validation study states the limit without hedging: "for all three risk components, the use of statistical tests for backtesting is severely limited by data constraints". The answer is not a better test. It is a bigger unit of analysis: pool grades into three or four bands, pool years into a window of at least three and preferably five, and report the bands rather than the grades until the grades have earned their own line.
Before you believe your own back-test
- One default definition, applied to every year
A definition that widened in 2024 will show a rise in defaults that is an accounting change, not a credit event.
- The grade at the start of the window, named on the report
Readers assume the current grade unless told otherwise, and the current grade makes every scale look prescient.
- Loans that left, weighted by the time they were exposed
Dropping early payoffs overstates the default rate; counting them as full years understates it.
- At least three years, and the years listed
A window that happens to contain one bad year for one industry is a story about that industry.
- Grades pooled into bands where the counts are thin
A grade with two defaults has no rate. A band of three grades with eleven defaults has a usable one.
- The same test run inside each region and each industry
A scale that rank-orders bank-wide can fail completely inside one cell, and the cell is where the money is.
Why a back-test that passes bank-wide can fail by region
Because a bank-wide back-test averages away the thing it is meant to find. Suppose one region grades a type of borrower a notch better than the rest of the bank. Its grade 4 cohort is really a mixture of grade 4 and grade 5 credits, and it will default at something between the two rates. Pooled into a book of five regions, that excess is a rounding difference on the bank's grade 4 line. Read inside the region, it is the whole finding.
This is exactly the pattern the sample bank's demonstration turns up. Freight trucking in the Mountain region is graded 1.2 notches better than like borrowers elsewhere in the bank — 38 loans and $286.4M across one cell of a map of nine industries by five regions — and the region's grade 4 loans defaulted at 1.9% over three years against 0.8% expected. The bank-wide default back-test, run on 2,305 loans, shows nothing remarkable. The segmented one shows a cell that has been quietly optimistic for a year.
Nine industries by five regions: where Risk Rating Validation says the grades lean
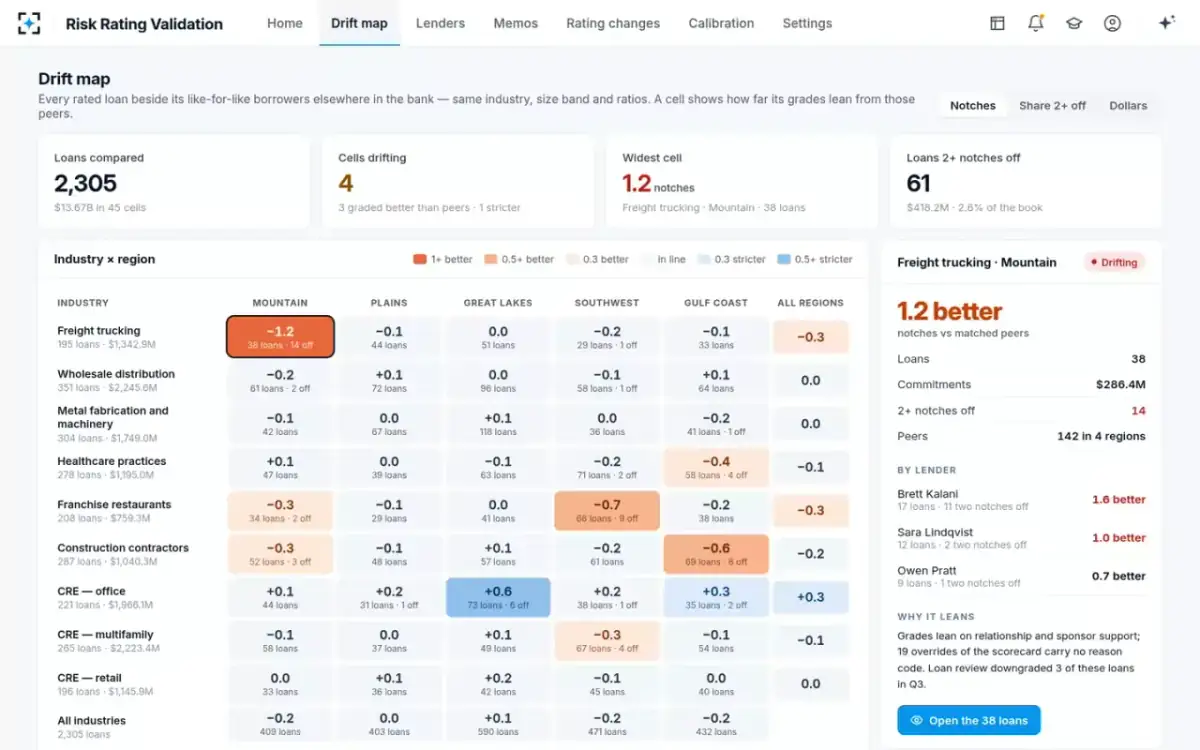
The map is a consistency test, not a default test: it compares grades with grades. The default back-test confirms it three years later.
Consistency and default are two different instruments pointed at the same question, and the useful property of the first is that it answers now. Comparing a borrower with look-alike borrowers graded by other lenders needs no defaults at all — only enough matched pairs. The sample bank's peer matching holds each borrower to the same industry at the three-digit level, revenue within 25%, coverage within 0.10x and leverage within 0.5x, and will not use another loan of the same lender as a peer. Where a cell leans and the back-test later agrees with it, the bank has two independent findings and a date on which the first one could have been acted on.
Benchmarking: what to do when the data runs out
Compare your grades with something other than your own defaults. The Basel Committee's study treats this as the ordinary companion to a weak statistical test rather than as a second-best: "recourse to benchmarking is often viewed as a complement to formal statistical backtesting of internal rating systems". Four benchmarks are available to a commercial bank, and they fail in different ways, which is why more than one is worth running.
The first is the bank's own independent reviewers: the rate at which credit risk review changes a grade, by region and by lender, is a benchmark produced every quarter at no extra cost. The second is matched peers inside the book, as above. The third is an external scale — a public rating or a vendor model on the subset of borrowers that carry one — useful mainly as a check that the ordering is not reversed. The fourth is the examiners, who are a benchmark whether or not you treat them as one, and whose sample is the one that becomes a finding.
What benchmarking cannot do is substitute for the slow test. The Basel study is blunt about the limit of the whole exercise: "at the current stage of knowledge, unambiguous and complete statistical tests enabling a formal acceptance or rejection of an IRB system do not appear to be available". A rating system is never proved. It is kept under measurement, and the measurement is reported with its uncertainty attached — which is the argument a model validator makes about the rating system itself, in nearly the same words.
What a board should be shown every quarter
Six numbers, each with its denominator, each split at least by region. The OCC's handbook sets out the reporting a rating system should produce, and the list below follows it: default and loss history by rating category; the ratio of rating upgrades to rating downgrades; the volume of double downgrades; seasoning; the velocity of rating changes; and rating changes by line of business, loan officer and location. The handbook adds a formatting rule worth repeating to anyone who builds the report: show every measure in dollars and in loan counts, because one large account can swing a report on its own.
The quarterly rating-performance page, and the question each line answers
| What is shown | The question it answers | What a bad answer looks like |
|---|---|---|
| Default and loss by grade, three-year window, count and dollars | Does the scale rank-order risk? | A grade defaulting more than the grade below it, in two consecutive windows. |
| Upgrades per downgrade, by region and by lender | Is anyone grading in one direction only? | A region at twice the bank's ratio in a flat quarter, with no portfolio change behind it. |
| Double downgrades, count and dollars | Are grades being refreshed, or discovered? | A rising count while the diagonal of the migration matrix holds steady. |
| Seasoning: average time in grade, by grade | How stale is the scale? | Pass grades averaging over three years in a book with annual reviews. |
| Independent reviewers' disagreement rate, by region | Would the examiners' sample pass? | A region above 5% of loans or 3% of dollars while the bank sits below both. |
| Overrides of the scorecard, and how many carry a reason | Is the written scale the one in use? | Overrides concentrated on one lender, most of them unexplained. |
The reason to put all six on one page is that they disagree with each other, and the disagreements are the content. A region with a clean default back-test and a 6.1% disagreement rate is a region whose grades are wrong in a way that has not yet cost anything. A region with the reverse is one whose reviewers are behind its borrowers. Neither is visible on a page that reports only the bank.
Back-testing is, in the end, the cheapest honest thing a credit risk function can do with data it already has — and the OCC's instruction is to do it and then act on the answer: banks "should determine through back-testing whether the assumptions implicit in the rating definitions are valid—that is, whether they accurately anticipate outcomes. If assumptions are not valid, rating definitions should be modified." To see the back-test beside the consistency map and the memo scores on one book, start from Risk Rating Validation, or read the four ways a bank can keep its grades right and what each one costs.
Questions people ask
What are default rates by credit rating?
They are the long-run average share of issuers carrying a given agency grade that default within a year. In the table the Federal Reserve Bulletin reprinted, Standard & Poor's rates per year for 1981–94 run 0.00% for AAA, 0.25% for BBB, 1.17% for BB, 5.39% for B and 19.96% for CCC and below. They describe rated corporate bonds over whole cycles, not a bank's own graded loans.
How do you back-test a bank's internal risk ratings?
Fix a start date, take the grade each loan carried on it, follow every loan forward for three years or more, and count defaults by the starting grade. Then check the one thing the regulator asks of a judgemental scale: that credits with more severe ratings show higher defaults and losses. Run the same test inside each region and industry, because a scale can rank-order bank-wide and fail inside a single cell.
How many years of data do you need to back-test a rating scale?
Three at an absolute minimum and five if you can reach them, and the binding constraint is defaults rather than years. A book of 2,000 rated loans at a 1% default rate yields roughly twenty defaults a year, so most individual grades will have none. The usual remedy is to pool grades into three or four bands and pool years into one window, and to say in the report which grades were pooled.
What is a rating migration matrix?
A square table with the grade at the start of a period down the side and the grade at the end across the top, each row summing to 100%, so the diagonal shows stability and the cells to the right show deterioration. The cells two or more columns right of the diagonal are the double downgrades, and the OCC expects a bank to be able to count them — they usually mean a grade was refreshed late rather than a borrower that fell two grades at once.
What is the difference between calibration and discrimination?
Discrimination asks whether worse grades default more often than better ones; calibration asks whether a grade's default rate matches the rate the bank attaches to it. The Basel Committee's validation study treats them as two separate stages, and for a judgemental commercial scale only the first is usually answerable: calibration needs enough defaults per grade to estimate a rate, which a mid-size book rarely has above its middle grades.
How do you tell an optimistic grade from an unlucky one?
By whether the pattern repeats and whether anything else agrees with it. One bad cohort in one year, in an industry that had a bad year, is luck — the Basel study warns that correlated defaults make observed rates exceed expectations even for well-calibrated systems. Optimism shows up as the same cell leaning in consecutive periods, confirmed by an independent reviewer's disagreement rate, by the share of overrides without a reason, and by the grades of matched borrowers elsewhere in the book.