An investment guideline monitoring tool is software that tests funds and mandates against the limits in their prospectuses, client agreements and regulations, and helps the compliance team work the resulting alerts through to cure and notice. Before buying one, a manager should measure four numbers on its current process: how long it takes to confirm a breach, what share of alerts are closed as data issues, how many alerts repeat one already open, and how many days pass between confirming a breach and notifying the client. Those four decide whether a tool is worth its price, because they are where the analyst hours, the client risk and the regulatory exposure sit. Botminds' Investment Guideline Monitoring, which works the post-trade alert queue with agents that recompute each alert and check its inputs against a second source, reports all four every day, so the baseline and the result are measured the same way.
Figures marked sample come from the solution's sample data on a fictional manager; targets are the solution's design goals. Breach counts, costs and practices come from France's AMF, which inspected five managers' monitoring of fund limits, and from SEC enforcement releases.
Four numbers an investment guideline monitoring tool should move
1
Time to confirm
Hours from the alert to a confirmed, classified breach.
Measure
Alert timestamp to approval timestamp, for every confirmed breach in four weeks.
Why it pays
The cure, the compensation and every notice clock start here.
Sample: 14 of 14 October breaches confirmed the day they were found; target: same day.
2
Share closed as data issues
Alerts closed because a price, rating, sector code or booking was wrong or late.
Measure
Closed alerts by reason code; data-issue reasons ÷ all closes.
Why it pays
Each one is analyst time spent proving an input, and a feed to fix.
Sample Monday: 141 of 412 alerts, 34%, were bad or late inputs.
3
Repeat-alert rate
Alerts that repeat one already open: same rule, same holding.
Measure
Repeats ÷ all alerts, and the rules that cause them, ranked.
Why it pays
A high rate means rules coded differently from the agreements behind them.
Sample Monday: 97 of 412 alerts, 24%, repeated an open alert.
4
Days to client notice
Business days from confirmation to the notice the agreement requires.
Measure
Confirmation date to send date, against each agreement's deadline.
Why it pays
The one number the client sees, and the one the agreement measures.
Sample: 12 of 12 notices on time in 2026 to date.
Investment guideline monitoring tool: the four numbers that decide the case
Most business cases for an investment guideline monitoring tool count hours. Hours matter, but they are the easiest number to promise and the hardest to hold a vendor to. The four numbers above are better because each one is visible in the firm's own records, each one changes for a reason the tool either causes or does not, and each one ties to a cost someone outside compliance cares about: the portfolio manager's cure, the data team's feeds, the rule-coding backlog and the client's letter.
The four also check each other. A tool that confirms breaches faster by closing more alerts as data issues, without fixing the data, will show the first number improving and the second getting worse. A tool that links repeats without fixing the rules behind them will cut the third number without changing tomorrow's queue. Read together, they show whether the work was removed or moved.
How many breaches does an asset manager have a year?
Between 20 and 800 a year at the five French managers the AMF inspected, against 100 to 10,000 transactions a year, and the AMF found that consistent with each firm's strategy (AMF, 19 February 2025). The more useful comparison is per transaction, because it separates trading volume from the quality of the controls. On the AMF's three-year figures it ranges from about one breach per hundred transactions to eighteen.
Breaches per 100 transactions at four French managers, 2021–2023
The highest rate belongs to the firm with the fewest trades and a long holding period, which shows why a rate needs reading, not ranking: a low-turnover fund near its limits breaches passively as markets move, whatever its controls. That firm also showed what trend analysis finds. The AMF noted that a review of its breaches would have revealed that 5% of its funds caused 60% of its breaches, including a third of the active ones.
What does a guideline breach cost a manager?
Usually little in compensation, occasionally a great deal in enforcement. At the French managers the AMF inspected, compensation for active breaches was paid on only 4% of them on average, and the amounts paid ranged from about €10 to €48,000 a payment. In the solution's sample data, the estimated make-whole for one active breach in a $1.17 billion credit mandate is $59,050, including an estimated $2,100 of trading cost.
What breaches cost when they are not found or not cured
$2.7M
joint and several penalty where one issuer was 30% to 89% of trusts against a 10% target, 2019
$1.6M
losses alleged in 2025 after a fund held more than 25% in one company for years
2.5+years
the SEC alleged the adviser waited before selling the position
The enforcement cases share a feature the four numbers would have shown: time. In both, the concentration was known to the adviser, and the reduction did not come when it should have. A manager that measures time to confirm and time to cure, and reports breaches that outlast their cure period, cannot drift into either case without its own reports saying so.
What does an investment guideline monitoring tool cost?
Vendors do not publish prices, but the AMF published what five managers spent. The annual cost of the tools used to configure and monitor limits ranged from €30,900 to €363,000 in 2023, between 0.1% and 2.3% of each firm's operating costs, excluding the cost of the data feeds. One manager had built its own tool for €400,000 before 2023 and spent €130,000 a year running it (AMF summary, §4.1.2).
Where two managers' monitoring tool budgets went in 2023
Manager with 100–200 funds, €312k
- Vendor licences and configuration, 57% · 57%
- In-house alert repository, 43% · 43%
Manager with under 10 funds, €84k
- Vendor licences and configuration, 96% · 96%
- Own post-trade tool, 4% · 4%
Two lessons follow for a buyer. The tool is a small share of operating costs, so the case turns on the people and the risk around it rather than the licence. And the larger manager spent two-fifths of its budget on something its vendor did not supply: one place to work the alerts from every source. That is the gap a queue-working tool fills. A cost model per restriction question for the pre-trade side is set out in the guide to investment management compliance software.
What KPIs matter for investment compliance beyond the four?
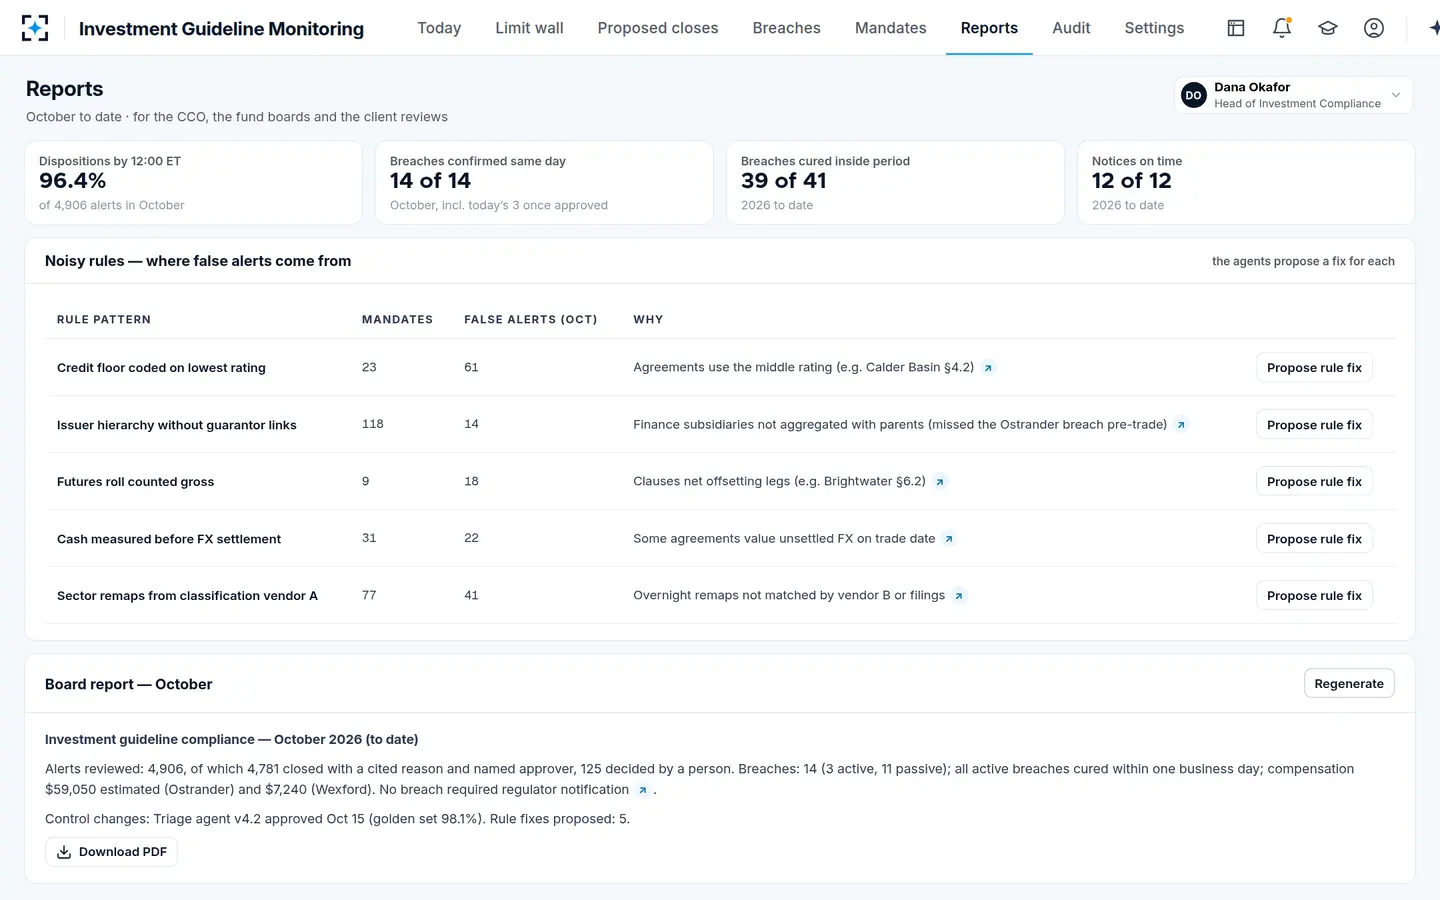
Four more belong on the monthly page, each already in the regulators' sights. The active share of confirmed breaches, because a share far below peers' invites the question of whether some passive labels were convenient. Breaches cured inside their period, because the enforcement cases are about breaches that were not. Dispositions by a set time each day, because an alert left open is a breach possibly running. And agreement between the firm's count and its reports, because the AMF found one manager's annual report showing 15 breaches where its four quarterly reports showed 19.
The KPIs reported every day, with the rules that cause the noise
Data quality is a KPI the regulators already measure
The share of alerts closed as data issues is the KPI most often left off the page, and the one regulators have started to look at directly. The AMF found anomalies in the breach reports managers sent it, in completeness and consistency, and said it plans over time to publish data quality checks for the quarterly breach and compensation reports, with automated consistency checks built into the forms (AMF summary, §4.4). Inside the firms, it called it good practice to focus internal control of the monitoring process on the quality of the external data the pre-trade tool relies on; at one manager the last open audit recommendation was a quality control system for the non-financial data behind its ESG limits.
A data-issue rate measured by feed turns that into something a data team can act on. If most data-issue closes come from one classification vendor's overnight remaps, or from one pricing source's late file, the fix is a contract conversation or a second source, and the rate should fall the month after. If it does not fall, the closes are being worked but the cause is not, and the register will show the same pattern next quarter.
Investment guideline monitoring report: what the committee should see
An investment guideline monitoring report should show the breaches, their causes and their resolution, not just a count. At the French managers the AMF inspected, the material presented to risk committees covered the number of breaches and its change, the average time to correct, the split between active and passive, the corrective measures taken, escalations triggered, the management team involved, recurring breaches and the reasons some lasted several NAVs. One manager added a statistical analysis of trends: the management units with the most breaches and the five breaches, by fund and limit, that took longest to resolve.
That last section is the one the AMF singled out, calling it a good practice to analyse trends in breaches periodically and share the results with senior management. It is also the section that turns the four KPIs into decisions: which rule to recode, which feed to replace, which team needs a conversation. The structure of the breach register that makes it possible is set out in the guide to the compliance breach register.
How to baseline the four numbers in four weeks
Take four ordinary weeks, avoiding quarter-ends, and record for every alert the time it was raised, the time it was closed or confirmed, the reason, and whether it repeated one already open; for every confirmed breach, the classification, the cure date and the notice date against the agreement's deadline. Most firms can rebuild this from the engine's alert log, the breach spreadsheet and sent mail, though the reasons for closing will be the weakest part, because they are rarely recorded consistently.
Then run the same four weeks through the candidate tool, as a replay on the same positions or in parallel with the analysts. The comparison is fair only if both runs use the same definitions, which is the reason to fix them first. The guide to testing post-trade compliance checks adds the measure a baseline cannot give: what both processes would have missed.
Where Investment Guideline Monitoring moves the numbers, and where it does not
The solution is designed to move all four. It targets same-day confirmation of breaches and a close for every alert that carries its clause, its evidence and a named approver. It cuts the share of analyst time spent on data issues by checking each input against a second source before a person reads the alert, but it does not fix the feed: the count of data-issue closes falls only when the data team acts on the pattern. It links repeats at once, but the repeat rate falls only when the rule-coding team accepts the drafted fixes. And it drafts notices from the breach the day it is confirmed, but the send stays with client service.
Investment Guideline Monitoring's morning view: the four numbers in the making
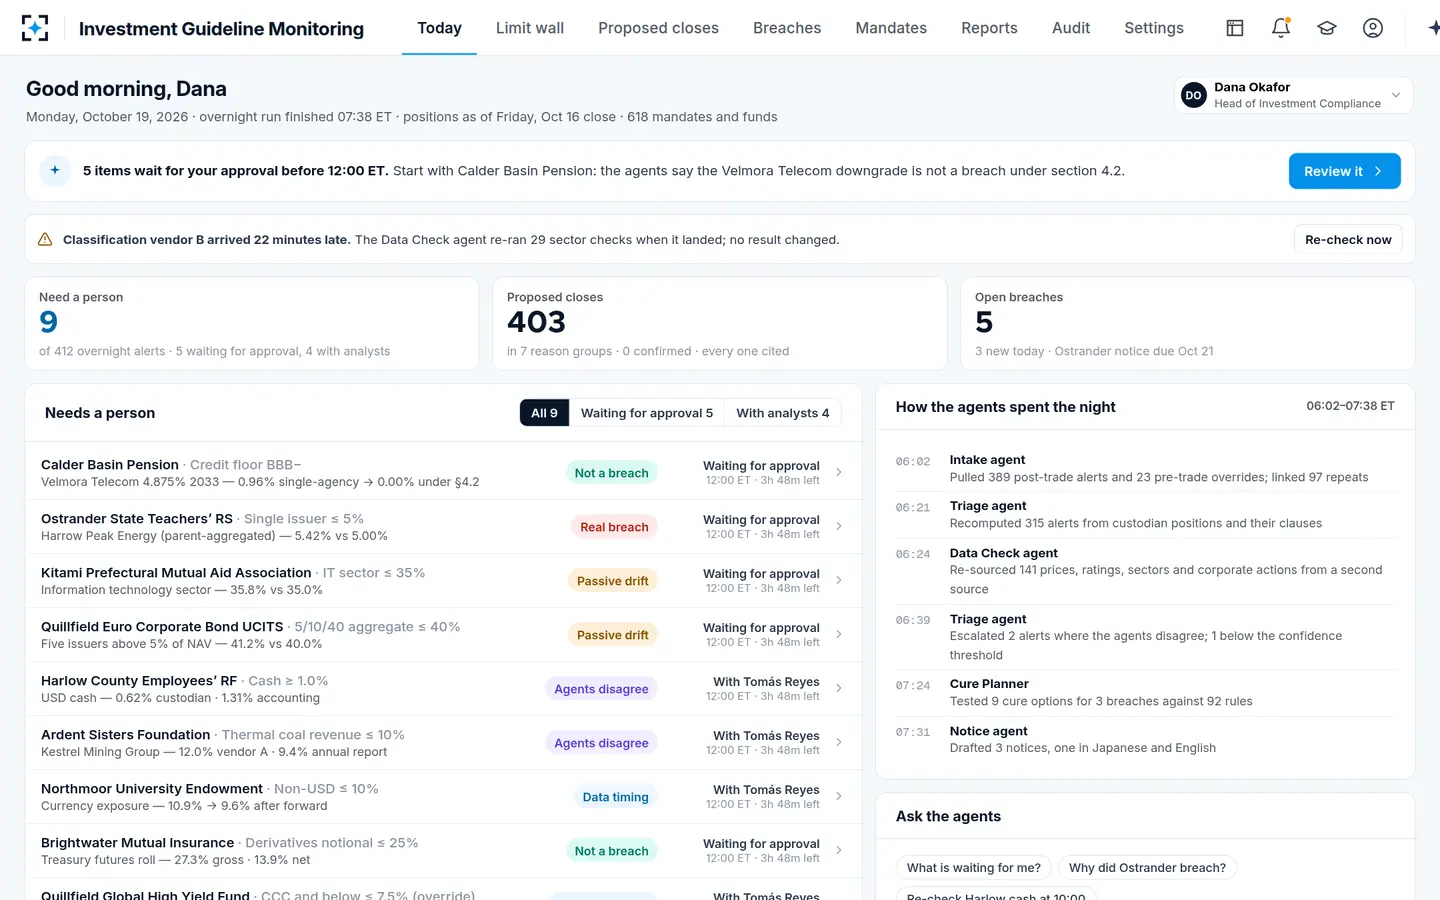
That division is deliberate, and a buyer should hold any vendor to it. A tool that claims to reduce repeat alerts without anyone changing a rule is hiding them, and one that claims faster notices without a person approving them is sending letters nobody has read.
Questions people ask
What is an investment guideline monitoring system?
The rules engine that tests portfolios against their limits, the queue of alerts it raises and the process that confirms, classifies, cures and reports breaches. At the managers the AMF inspected it included the firm's own pre-trade and post-trade checks, the valuer's checks at each NAV and the depositary's checks, reconciled against each other.
How do you measure investment compliance effectiveness?
By outcomes and by tests. Outcomes are the KPIs on this page: time to confirm, data-issue and repeat rates, cure and notice timeliness. Tests are seeded runs and samples of real breaches followed end to end, the method the AMF used when it drew 15 to 20 breaches per manager.
What is a good repeat-alert rate?
No regulator or independent study publishes a benchmark. The right target is falling: each repeat traces to a rule or a feed, and the rate should drop as fixes are made. In the solution's sample Monday, 97 of 412 alerts repeated one already open.
Is an investment compliance monitoring report required by regulators?
In different forms. French managers report active breaches to the AMF quarterly and summarise them annually; a US fund's chief compliance officer reports material compliance matters to the board at least annually; Luxembourg funds notify active breaches to the CSSF. The internal monthly report is what makes those accurate.
How long does it take to see the KPIs move?
The first number moves as soon as alerts arrive recomputed; the repeat and data-issue rates move only as the rule and data fixes are made, which depends on the teams that own them. Measuring the same four weeks before and after keeps the comparison honest.