A link analysis chart is a diagram of entities, such as people, phones, addresses, businesses, vehicles and accounts, drawn as nodes, with lines between the ones that appear together in some record. Investigators use it to see a network that no single file shows, and to explain it to a manager, a prosecutor or a jury. Reading one well means treating every line as a claim that two things were connected, asking where that claim came from, and discounting the nodes that connect everything. In insurance fraud the charts usually show claims linked through shared callers, clinics, attorneys, tow yards and cards. Botminds' Fraud Network Analysis draws such charts from an SIU's claim files, with every line tied to the document and line it was read from; this guide uses its charts as the worked example of how to read any link chart, whoever made it.
The charts shown come from a fictional sample carrier, Keywater Insurance Company, and its South Florida SIU; every name, phone and claim is invented. The evidence rules and analytic standards are linked where they appear.
Anatomy of a link analysis chart: six things to read before the picture
- 1A node is one thing
A person, phone, address, provider, firm, vehicle, card or account, after the different spellings of it have been merged. Ask how they were merged.
- 2A line is a claim
That two things appeared together somewhere. It is only as good as the document it was read from.
- 3A badge counts what is off the chart
Other claims the node touches beyond those drawn. A large number may mean a hub, not a ring.
- 4A hub links everyone
A hospital, a dispatch line, the carrier's own number. Good charts show hubs greyed out or set aside, and say so.
- 5A boundary is a hypothesis
The outline around a group was drawn by an analyst or a program. It is a reason to look, not a finding.
- 6A source sits behind every line
The page and line the link was read from, so anyone can check it. No source, no line.
What is a link analysis chart?
A link analysis chart is the visual product of an association or network analysis: a picture of who and what is connected to whom. The law-enforcement analytic standards define that analysis as the "Collection and analysis of information that indicates relationships among varied individuals suspected of involvement in criminal activity and providing insight into the criminal operation and which investigative strategies might be the most effective" (Law Enforcement Analytic Standards, 2nd edition, glossary). The chart is how that analysis is shown.
Two things follow from the definition. A link chart is about relationships, not events, so it says little about order or timing; that is what a timeline is for. And it serves a decision, which investigative steps to take, so it should be read for what it lets you do next, not for how complete it looks. A chart that shows everything is usually a chart that has not been edited.
How do you read a link analysis chart?
Read a link analysis chart from the parts to the picture: first what each node stands for, then what each line claims and where it came from, then which nodes are hubs, and only then the groups. The six parts in the anatomy above are the order to read them in. Most misreadings come from doing it the other way, seeing a dense cluster and assuming it is a ring before asking what holds it together.
The nodes come first because they hide the most work. A node labelled with one name may stand for three spellings, a nickname and an initial that someone, or some program, decided were the same person. That decision is the single biggest source of error in a chart: merge two people wrongly and every claim either touched now looks connected. A good chart says how its nodes were merged and how confident the merge was; how that matching works, and where it fails, is covered in entity resolution software for fraud.
What do the lines on a link chart mean?
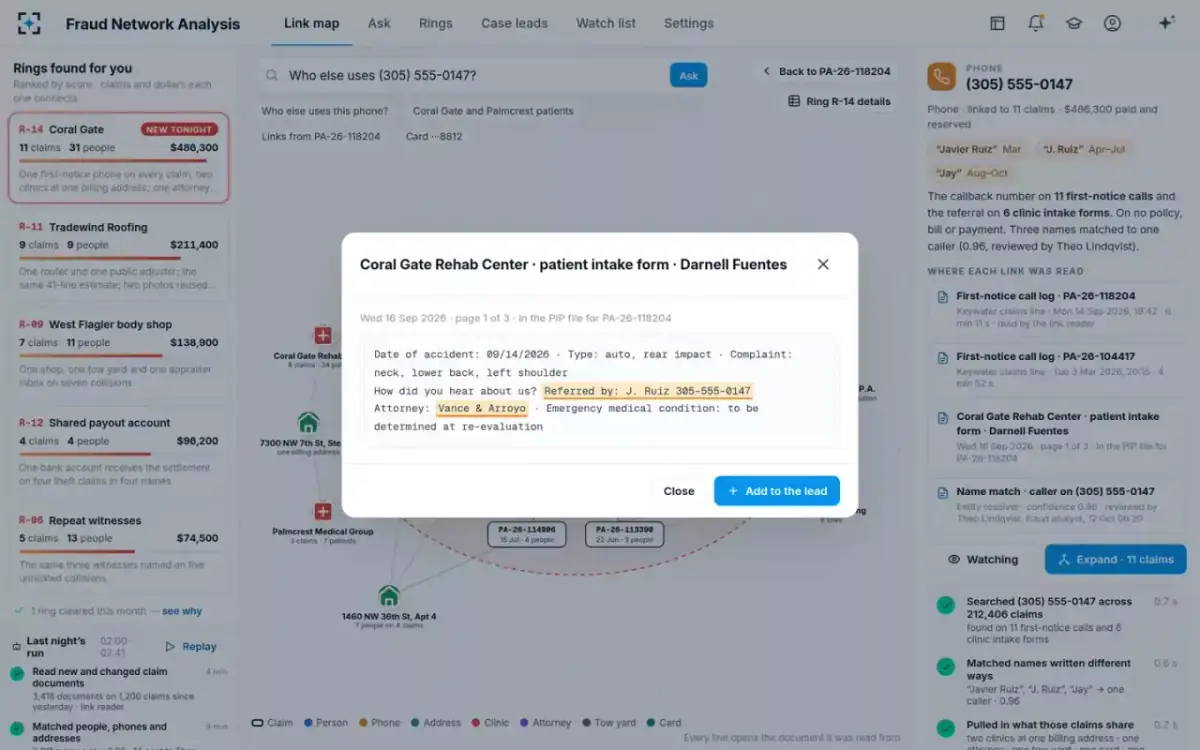
Each line on a link chart means that two entities were recorded together somewhere: a phone given on a claim, a patient on a clinic's intake form, a client on a lawyer's letter. It does not mean the two know each other, acted together or did anything wrong. A line is a statement about a record, and it should be read with the record.
Good charts carry three things on or behind every line: the type of link, so a shared bank account is not drawn the same as a shared tow yard; the date, so a link from five years ago is not read as current; and the source, so anyone can open the page. The analytic standards add a fourth, the reliability of the source, graded on a scale that runs from "reliable" through "usually reliable", "sometimes reliable" and "unreliable" to "reliability unknown", and warn that "Data in the last two categories would be considered questionable and should not be shared with others" (Law Enforcement Analytic Standards). In claim files, a phone typed by an adjuster from a call is less reliable than one printed on a provider's bill, and a chart that treats them alike overstates its certainty.
One line in Fraud Network Analysis, opened to the page it was read from
Hubs and clusters: where link charts mislead
Link charts mislead in two predictable places: hubs, which make unrelated things look connected, and cluster outlines, which make a hypothesis look like a finding. Both can be checked.
A hub is a node with so many links that it joins strangers. In Italy's national antifraud archive, researchers counted roughly 4,000 subjects involved in more than 100 accidents each, mostly professionals who handle claims rather than cause them (Tumminello et al., Journal of Risk and Insurance, 2023). Drawn on a chart, any one of them sits in the middle of everything. The fix is to show hubs differently, or set them aside before drawing, and to say on the chart which were set aside. The sample unit in Fraud Network Analysis sets aside 37, including the carrier's own numbers and national tow and glass dispatch lines; tow truck insurance fraud: innocent hub or the ring itself? works through the test on one yard.
The cluster outline is the other trap. A dashed line around a group of claims was drawn by someone, using some rule. The research is clear that such structures are suspicions: the Italian authors stress that a statistical anomaly is not proof of guilt, and one of the first network systems for auto fraud was built on the premise that the final assessment belongs to an expert or investigator, not the software (Šubelj, Furlan and Bajec, 2011). Read the outline as the drawer's claim, and ask what rule drew it.
Is a link chart evidence in court?
A link chart can be admitted as evidence in a U.S. federal court when it accurately summarizes voluminous admissible records the other side can examine; otherwise it is at most an illustrative aid that helps a jury follow testimony and is not evidence. The Federal Rules of Evidence drew that line more sharply in amendments that took effect on 1 December 2024.
A chart as evidence, or a chart as an illustration: the 2024 federal rules
Summary chart (Rule 1006): "The court may admit as evidence a summary, chart, or calculation offered to prove the content of voluminous admissible writings, recordings, or photographs that cannot be conveniently examined in court."
Illustrative aid (Rule 107): A presentation "offered not as evidence but rather to assist the trier of fact in understanding evidence or argument", such as drawings, diagrams, charts and graphs.
Summary chart (Rule 1006): Yes. The 2024 note says such summaries "must be admitted as substantive evidence".
Illustrative aid (Rule 107): No. "An illustrative aid is not evidence and must not be provided to the jury during deliberations" unless all parties consent or the court orders otherwise.
Summary chart (Rule 1006): The underlying records must be made available to the other parties, and the summary must reflect them accurately.
Illustrative aid (Rule 107): Its usefulness must not be substantially outweighed by the danger of unfair prejudice, confusion or misleading the jury.
Summary chart (Rule 1006): If the summary "does not accurately reflect the underlying voluminous evidence, or if it is argumentative", it may be excluded.
Illustrative aid (Rule 107): An aid "may be prepared to distort or oversimplify the evidence presented".
For an SIU the practical consequence is about sourcing. A chart whose every line traces to a document that can be produced is the kind of summary Rule 1006 contemplates. A chart drawn from memory, or from an export whose sources are lost, can still help explain a case, but it will not carry the weight of evidence and is easier to attack as distorting. The committee notes add that a summary must also pass the general balancing test, and that one which is "argumentative" may be kept out. "Linked to" wording on the chart, not "involved in", is part of keeping it a summary rather than an argument.
What is the difference between a link chart and a timeline?
A link chart shows who is connected; a timeline shows what happened when. The analytic standards treat them as different products: a network analysis combines tools such as an association matrix and a link chart with conclusions, while flow analysis covers the sequence of events and, in the glossary's words, "can include timelines" (Law Enforcement Analytic Standards). A ring case usually needs both.
Four ways to show a ring, and the question each answers
| Product | Answers | Misses | In a sample ring |
|---|---|---|---|
| Link chart | Who and what is connected, and through what | Order, timing, money | One phone joining eleven claims, with the clinics, firm, tow yard and card around them |
| Association matrix | Exactly which claim shares which link | The overall shape | Each claim against the phone, two clinics, the firm, the tow yard, recent policies, the card and an address |
| Timeline | What happened when, in order | Who is connected to whom | A loss about every three weeks from March to October, then a new call |
| Summary with exhibits | What the analyst concludes, and on what evidence | Nothing, if every claim in it is sourced | A lead in "linked to" wording with 14 numbered exhibits |
How do you make a link analysis chart?
To make a link analysis chart, collect the records, extract the entities and their co-occurrences with their sources, merge the duplicates, set aside the hubs, draw, and then edit the drawing down to what supports the question. The drawing is the last and smallest step.
In order: decide the question, such as "who else is connected to this phone?", because it decides which records to pull. Pull the claim files, call logs, forms, bills, letters and payment records for the claims in scope. Extract every identifier with the page it came from. Merge the spellings and record why. Mark the hubs and decide, in writing, which to leave out. Draw nodes and lines, with line types distinguished. Then remove what does not bear on the question, add the dates and the sources, and write the two or three sentences that say what the chart shows and what it does not. The analytic standards ask exactly that of any report: "A concise, coherent organization of facts shall indicate how the analyst arrived at conclusions" (Law Enforcement Analytic Standards).
Can you make a link chart in Excel?
Yes, for a small case: a spreadsheet can hold an association matrix, and many diagramming tools can draw a chart from a list of pairs. What a spreadsheet will not do is the reading, the merging or the sourcing. Each identifier still has to be typed from a document, each spelling matched by eye, and each source noted by hand, and the chart is out of date the day a new claim arrives.
That is the trade-off behind every link analysis purchase. The time on a hand-built chart is spent finding and typing, not judging; Botminds' own estimate for one ring of about ten claims is around 18 working days by hand, of which searching identifiers and drawing take seven. Which documents a tool has to read to do that work is set out in link analysis tools need these eight documents.
What should a link chart include? Eight questions before you believe a ring
A link chart should include its question, its sources, its hubs and its limits, and a reader should be able to answer eight questions from it before believing the group it outlines.
Eight questions to ask of any link chart before believing the ring on it
- What question was the chart drawn to answer?
A chart drawn outward from one phone shows that phone's world, not the whole network.
- How were the nodes merged?
Which spellings became one person, at what confidence, and who reviewed the uncertain ones.
- Where does each line come from?
The document and line. A line with no source is an assertion.
- What kind of link is each line, and when?
A shared account and a shared tow yard are not the same strength; a five-year-old address is not current.
- Which hubs were set aside, and which were kept?
And whether any group would dissolve if one busy node were removed.
- Who drew the boundary, and by what rule?
A threshold, a score, an analyst's judgement. The rule should be written on the chart or beside it.
- What is not on the chart?
Claims outside the look-back, other carriers' data, public records. Absence on the chart is not absence in the world.
- What would clear this group?
A household, a shared employer, a single busy clinic. If nothing could, the chart is an argument.
What a chart from Fraud Network Analysis shows
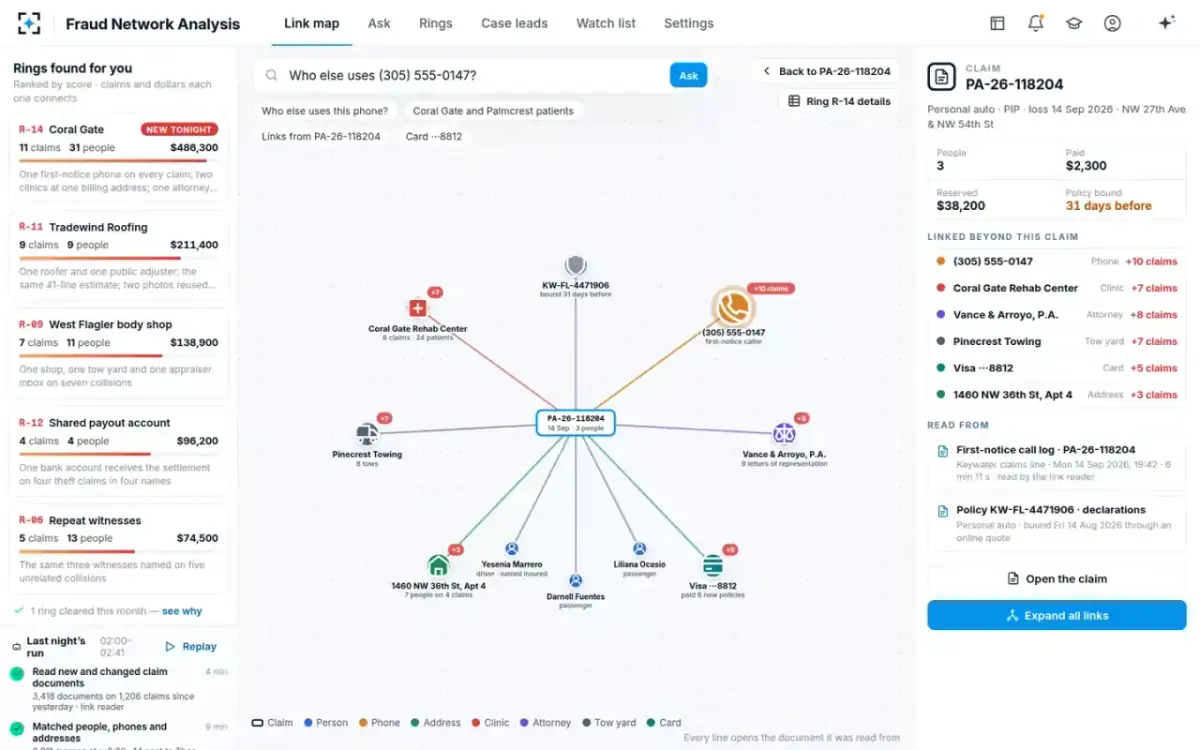
A chart in Fraud Network Analysis starts from a claim and shows everything it touches, each with a badge counting the other claims behind it. Every line carries the claim, the document and the line it was read from, and the agent that read it. Hubs such as regional hospitals, the carrier's own numbers and national dispatch lines are set aside before anything is drawn. When a ring is drawn, its outline is labelled with the claims, people and dollars it connects and the reason, in plain words, that it was grouped.
A claim and everything it touches in Fraud Network Analysis
The same ring is then shown in the other forms a case needs: an association grid of each claim against each shared link, a timeline of losses, and a drafted lead in "linked to" wording with numbered exhibits, each opening its documents. The agents never call the group fraud or name a suspect; the investigator decides what is a lead and the SIU manager approves the referral. How to measure whether the rings such charts show are real is the subject of five tests a detected ring must pass; to see the charts on a sample of claims, start from Fraud Network Analysis.
Questions people ask
What is the difference between a link chart and an association matrix?
An association matrix is a table with entities on both axes, or claims against shared links, marking which pairs are connected; a link chart draws the same information as nodes and lines. The matrix is exact and easy to check; the chart shows the shape. The analytic standards list both as parts of a network analysis.
Are link charts admissible in court?
In federal court, a chart that summarizes voluminous admissible records can be admitted as evidence under Rule 1006, provided the underlying records are made available and the summary is accurate and not argumentative. A chart used only to help explain testimony is an illustrative aid under Rule 107, effective 1 December 2024, and is not evidence. State rules differ.
What software is used to make link analysis charts?
Analysts use dedicated link charting tools, graph databases with visualization, diagramming software and spreadsheets. The analytic standards group the software into databases, spreadsheets, visualization, mapping and text or data mining. For insurance fraud the deciding feature is not the drawing but whether the tool reads claim documents and keeps the source of every line.
How many nodes should a link chart show?
As few as answer the question. A chart for a referral should show the claims, people and shared links that support it, with hubs left off or marked, and the full network available behind it. A chart with hundreds of nodes is a map for an analyst, not an exhibit for a reader.
What does a dashed line or a grey node mean on a link chart?
There is no universal convention, which is why a chart needs a legend. Commonly, dashed or grey marks something weaker, uncertain or set aside: an unconfirmed link, a low-confidence match or a hub left out of the analysis. On the anatomy chart above, the grey dashed hospital is a hub that was set aside.