Fraud ring detection is the work of finding groups of insurance claims that are linked through the same people, phones, addresses, clinics, attorneys, tow yards, cards or bank accounts more often than chance would explain, and ranking those groups so investigators look at the most suspicious first. Insurers do it with link analysis and network models because organized rings are designed to look ordinary one claim at a time. The hard part is not drawing rings, which any graph tool will do, but knowing which drawn rings are real. Botminds' Fraud Network Analysis rebuilds a link map of an SIU's claims every night and draws the groups that score above the unit's threshold; this guide sets out five measures any SIU can use to test that output, or any other ring detection, before it trusts it.
Examples come from a fictional sample carrier, Keywater Insurance Company, as it runs in the solution: 212,406 claims in a 24-month look-back. The research is peer-reviewed or preprint work on insurance fraud networks, linked where it appears.
Five tests a detected fraud ring must pass, and how to measure each
1
Sourced
Does every link open the document it was read from?
Measure
Share of links with a source; error rate on a hand-checked sample of links
Hold it to
100% sourced; errors found and fixed
2
Hubs handled
Is the ring held together by a busy provider everyone uses?
Measure
Share of each ring's score that comes from its busiest node; hubs set aside, reviewed
Hold it to
No ring rests on one hub
3
Beyond chance
Do the claims share more than their sizes would predict?
Measure
Observed shared links against the number expected by chance
Hold it to
Expected count shown beside the observed
4
Precise at the top
Of the rings investigators opened, how many held up?
Measure
Confirmed ÷ investigated, for the top-ranked rings; lift over random
Hold it to
Tracked per quarter, by line
5
Verdicts kept
Is every cleared ring on record with its reason, and fed back?
Measure
Share of rings with a recorded outcome; repeat false rings
Hold it to
Every ring closed with a reason
What is fraud ring detection, and how do insurers detect fraud rings?
Insurers detect fraud rings by building a network of claims and the parties on them, then looking for groups of claims that are unusually tightly connected. The network can be as simple as claims linked to the people, brokers, experts and garages on them, which is how researchers at KU Leuven built theirs from a couple of million claims at one insurer. Their finding is the case for the whole approach: "models with features derived from the network perform well when detecting fraud and even outperform the models using only the classical claim-specific features" (Óskarsdóttir et al., 2020).
Other teams have used different network shapes to the same end. One of the first systems for auto fraud argued that "Networks are the most natural representation of such a relational domain" (Šubelj, Furlan and Bajec, 2011). A team working with Iran Insurance data searched for cycles, closed loops of claims and parties, and reported that "Suspicious groups have been detected by applying cycle detection algorithms" (Bodaghi and Teimourpour, 2018, preprint). Researchers working with Italy's insurance supervisor, IVASS, built a system on the national antifraud archive, which held more than 15 million accidents, that keeps only links statistically unlikely to be random (Tumminello et al., Journal of Risk and Insurance, 2023).
Fraud Network Analysis takes the plainest of these shapes and puts the effort into the inputs. Its agents read the identifiers out of first-notice call logs, PIP applications, clinic intake forms, bills, letters of representation, tow invoices and payment records; join the same person written different ways; rebuild the map over the look-back each night; set aside hubs; and score groups of at least four claims by the weights the fraud analyst has set for each kind of shared link.
Why "it found rings" is not a measure
Any network of hundreds of thousands of claims contains thousands of tightly linked groups, most of them innocent: families, apartment buildings, fleets, the busiest clinic in town. A tool that reports how many rings it found is reporting how dense your data is. The questions that matter are whether the links are real, whether they are more than coincidence, and whether investigators confirm what the tool ranks highest.
Those questions are hard to answer because the ground truth is thin. In the KU Leuven data, "less than a percent of all claims go through a formal fraud investigation with less than half resulting in a known fraud label" (Óskarsdóttir et al., 2020). Recall, the share of all real rings a tool finds, cannot be measured directly when almost nothing has been investigated. Precision, the share of flagged rings that hold up, can. That is why four of the five tests below are about the rings a tool shows you, and the fifth is about writing down what happened to them.
California's regulation makes the point sharper for anyone writing there: an SIU must investigate credible referrals it receives from claims staff, and the rule expressly includes automated or system-generated ones (10 CCR § 2698.36). A ring detector that floods the unit with weak groups is not free to ignore. Every one it sends as a referral is work the regulation expects to be done.
Test 1: every link opens its source
The first test is whether each line in a ring can be traced to the page it came from, and whether those pages say what the line claims. It is the cheapest test to run and the one most tools fail, because many draw links from structured fields that were themselves keyed by hand from the documents.
Run it as a sample. Take fifty links from this month's top rings, open the source of each, and count the ones where the document does not support the link: a misread digit in a phone, an attorney who withdrew before the letter date, a clinic address that is the billing service, not the clinic. In Fraud Network Analysis every link carries the claim, the document, the line and the agent that read it, and the link reader is built never to write down an identifier that is not in a document, so the test is a matter of clicking. With a tool that cannot show a source, the test cannot be run at all, which is itself the answer.
Test 2: hubs are set aside, and the cost is known
A hub is a node linked to so many claims that it joins strangers: a regional hospital, a national tow dispatch line, the carrier's own claims number, a large law firm. Hubs are the main source of false rings, and how a tool handles them decides whether investigators trust its output.
The scale is large. In the KU Leuven network the most connected expert appeared on 125,951 claims and the most connected garage on 10,436. In Italy's archive, roughly 4,000 subjects were involved in more than 100 accidents each, "and a few handfuls register the impressive number of more than 50,000 accidents" (Tumminello et al., 2023). Leave those nodes in and every ring touches them. Take them all out and you may remove the professional at the centre of the scheme, which the same authors warn against, because some lawyers and doctors are the link between seemingly unrelated accidents.
So the test has two parts. First, does any ring depend on a single node, so that removing it dissolves the ring? If so, it is a hub artefact until shown otherwise. Second, is the list of hubs set aside short, named and reviewed? The fictional sample unit sets aside 37: anything linked to more than 400 claims, the carrier's own numbers and addresses, and twelve national tow and glass dispatch lines, with the analyst able to add more. When a tow yard is an innocent hub and when it is the ring works this test through on one yard.
Test 3: the ring shares more than chance would give it
A false ring is a group of claims whose shared links are no more than you would expect from the sizes of the things they share. The test is to compare what the group shares with what chance would give it. The Italian study formalizes this with a hypergeometric model: a link between two subjects is kept only if they appear together far more often than their separate activity would produce at random (Tumminello et al., 2023).
The arithmetic is accessible. Suppose a regional hospital appears on 2,000 of 212,406 claims. In any group of eleven claims you would expect about 0.1 of them to involve it. One shared hospital claim turns up by chance in roughly one group in ten, two in about one in 220, three in about one in 7,700. Now take a clinic that appears on eight claims in the whole book, all eight inside the same eleven-claim group. The chance of that by accident is effectively zero. Both are "shared clinics" on a chart; only one is evidence.
How the sample's top ring earned its score of 94
Ask any vendor which of the two its score is. A weighted sum of shared links, which is how Fraud Network Analysis scores, is transparent and easy to tune: every point traces to a named link. A chance test is better at separating the busy from the unusual. The two answer different questions, and a unit that reports both, the score and the expected count beside the observed one, gives its investigators the strongest footing.
Test 4: precision at the top of the list
Precision at the top is the share of the highest-ranked rings that investigators confirm. It is the measure that matches how an SIU works, since nobody investigates the bottom of a ranked list. The fraud research uses a close cousin, top-decile lift, which the KU Leuven team defines as the proportion of fraud among the top 10% of scored claims divided by the fraud rate in the whole data; "A random model has TDL equal to one" (Óskarsdóttir et al., 2020).
What a validated ring detector looked like on Italy's national archive
0.83–0.84
out-of-sample AUC of the best model separating known frauds from random accidents
4,566
accidents recognised as frauds by the authorities, used to calibrate the indicator
~90%
overlap of detected communities from one month to the next
60.2%
of detected communities were the smallest possible: two subjects, two accidents
Run the test on your own rings each quarter: of the rings investigators opened, how many led to a referral or a confirmed scheme, and how many were cleared? Break it out by line and by the kind of link that drove the score. If rings driven mainly by shared addresses are cleared far more often than rings driven by shared phones or accounts, the weights are telling you something. A recall check is possible too, with care: replay last year's claims and see whether the rings your unit already proved would have crossed the threshold, and at which claim.
Test 5: investigators' verdicts, kept and fed back
The fifth test is whether every ring ends with a recorded outcome and a reason, and whether those outcomes change the rules. A ring that was investigated and cleared is the most valuable data an SIU has, because it is the only labelled example of what a false ring looks like in its own claims.
Closing the loop in Fraud Network Analysis: from a drawn ring to better weights
Agent
Draw and rankThe ring finder rebuilds the map overnight, sets aside hubs and scores groups of four or more claims.
Never: call a ring fraud, hold a payment or contact anyone
A person decides
InvestigateThe investigator works the ring and decides what becomes a lead. The SIU manager approves any referral.
A person decides
Record the verdictConfirmed, referred, or cleared with a reason, such as a household rather than a ring. The clearance stays on record.
A person decides
Adjust the rulesThe fraud analyst proposes new weights or hubs from the pattern of verdicts; the SIU manager approves; the change applies at the next nightly run.
The Italian study adds a stability check worth copying: detected communities overlapped by roughly 90% from month to month, measured with the Jaccard and Szymkiewicz-Simpson coefficients. Real schemes persist; artefacts of a data load come and go. If your rings reshuffle completely every night, something other than fraud is driving them.
Rings ranked by score in Fraud Network Analysis, each with what links it
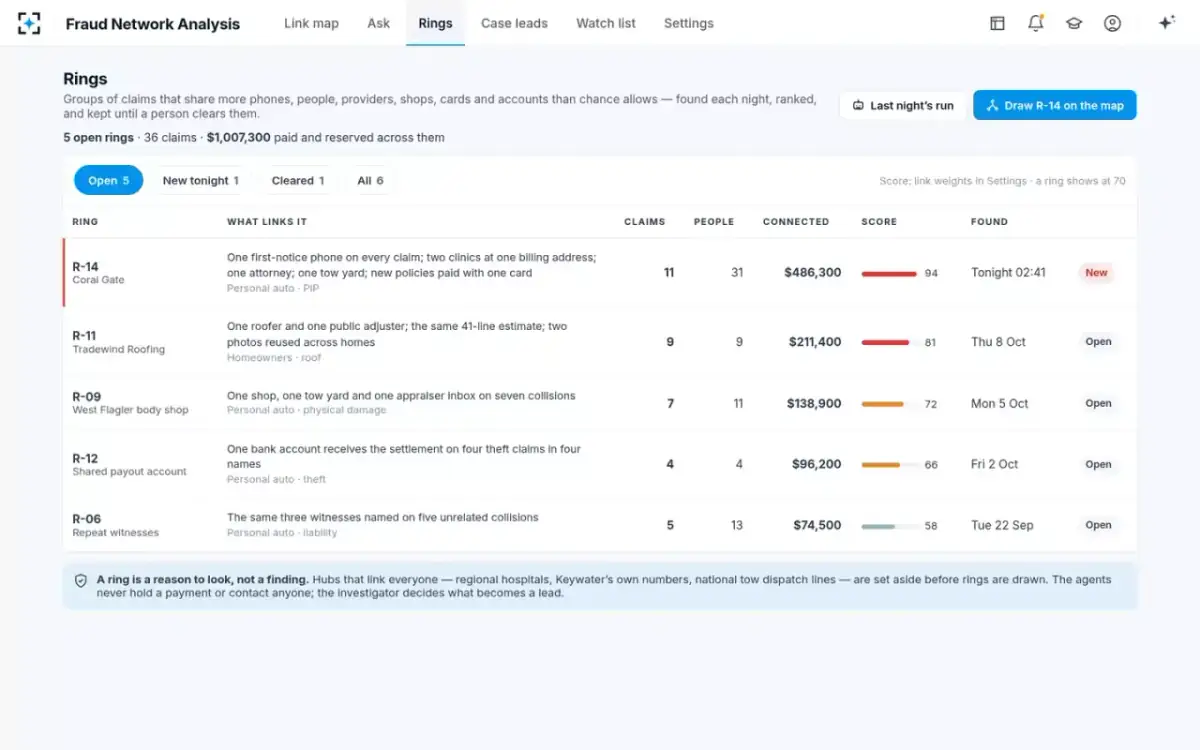
How many claims make a fraud ring?
There is no legal or industry number; it is a setting, and it should be. The fictional sample unit draws nothing smaller than four claims, and only groups that score at least 70. In the Italian archive, 60.2% of the validated communities were the smallest possible, two subjects and two accidents, while the largest 2%, about 9,767 communities, ran from 26 to 13,778 nodes (Tumminello et al., 2023).
The trade-off is between noise and time. A minimum of two claims floods investigators with pairs of relatives. A minimum of ten finds rings only after they have been paid for months. The sample ring was drawn at its eleventh claim, and a call that would have made a twelfth came in six hours later; a lower minimum would have drawn it months earlier, with fewer links to show. Whatever number a unit chooses, Test 4 should be run separately for small and large rings, because their precision differs.
Can fraud ring detection be biased?
Yes, and the usual route is through the links themselves rather than through anything as obvious as a protected attribute. Weighting shared addresses heavily will draw more rings in dense housing, where strangers share buildings, than in suburbs. Weighting clinics heavily will draw more rings around the providers that serve uninsured or low-income neighbourhoods. Neither is fraud. Both will show up in Test 4 as rings that investigators clear more often in some areas than others.
Insurers told the NAIC they draw a line at some inputs; one company's comment in the private passenger auto survey reads: "Gender, marital status, race, etc., are never used in fraud detection" (NAIC private passenger auto AI/ML survey, 2022). That is necessary but not enough. The NAIC's model bulletin on insurers' use of AI names fraud detection among the uses it covers (NAIC Model Bulletin, December 2023), and NIST's AI Risk Management Framework, which is voluntary, gives a structure for testing outcomes rather than inputs (NIST AI RMF). In practice that means running Test 4 by geography and by provider type, and reading the cleared rings for patterns. Validation for banks is governed by separate supervisory guidance, which since April 2026 is SR 26-2; how that guidance defines a model is covered in a banking guide.
A quarterly ring detection review an SIU manager can sign
- Sample fifty links and open their sources
Count the links the documents do not support. Fix the reading, not just the link.
- List the hubs set aside and the ones added
Each with a reason and who approved it. Check no ring this quarter rested on one node.
- Show the expected count beside the observed
For the top rings, how many shared links chance alone would give a group of that size.
- Report precision at the top, by line and by link type
Confirmed or referred, divided by investigated, for the highest-ranked rings.
- Count rings with no recorded outcome
A ring without a verdict teaches nothing and cannot be defended later.
- Compare clearance rates by area and provider type
A ring type that is cleared far more often in some neighbourhoods is a weighting problem.
- Record every weight and threshold change
Who proposed it, who approved it, and which rings it would have changed.
Run quarterly, those seven checks turn ring detection from a black box into a measured process. They also make it easier to defend a referral, a subject taken further in how to read a link analysis chart, link by link. To see the rings, the scores and the sources together, start from Fraud Network Analysis.
Questions people ask
How accurate is fraud ring detection?
It depends on the data and the definition of accurate, and published figures are for specific systems. The statistically validated network system tested on Italy's national archive reached an out-of-sample AUC of about 0.83 to 0.84 at separating known frauds from random accidents. For your own unit, the useful figure is precision at the top: the share of the highest-ranked rings your investigators confirm.
What is a false ring?
A group of claims that looks connected but whose shared links are explained by chance or by a hub, such as a hospital, a dispatch line or a family at one address. False rings are the main reason investigators stop trusting link charts. The defence is to set aside hubs, compare shared links with what chance would give a group of that size, and record every cleared ring with its reason.
What is a hub in link analysis?
A node connected to so many claims that it links unrelated people: in the KU Leuven study the busiest expert appeared on 125,951 claims. Hubs are usually innocent, so ring detection sets most of them aside before scoring. Some professionals at the centre of real schemes are also busy, so the list of hubs set aside should be short, named and reviewed.
How do you validate network fraud detection?
Validate it on outcomes, not on the count of rings found. Check that links are sourced, that rings do not rest on a single hub, that shared links exceed chance, that the highest-ranked rings are confirmed at a known rate, and that cleared rings are recorded and fed back into the weights. Replaying past claims to see whether proven rings would have been drawn gives a partial recall check.
Does fraud ring detection replace the SIU's red flags?
No. Red flags describe one claim; ring detection describes how claims relate. The research cited here found network features worked best when combined with claim-level features, not instead of them. A claim with ordinary red flags inside a high-scoring ring deserves more attention than either signal alone.
Should a ring detection tool hold payments?
Fraud Network Analysis never holds a payment or contacts anyone because of a link; a hit alerts the investigator and the adjuster, and the adjuster keeps every claim decision. Holding a claim is a decision with statutory clocks attached, and it should rest on an investigation, not on a score.