A value at risk model is a method for estimating the loss a portfolio should not exceed, at a stated confidence, over a stated horizon: at 99% and 20 days, the loss that the model expects to be exceeded in only one 20-day period in a hundred. Funds that rely on SEC Rule 18f-4 must run one every business day, at 99% confidence over 20 trading days, with at least three years of data and every significant market risk factor, and compare the result with a reference portfolio's VaR. The model is only the middle of the story. Before it come positions, net assets, prices and index weights; after it come a ratio, a limit check, a board report and confidential lines on Form N-PORT, and an error at any step reaches the board looking exactly like a correct number. This guide traces one day's ratio through that whole path, using a fictional fund in Botminds' Derivatives Risk Management Program, where an independent agent recomputes the number before anyone relies on it.
The rule is 17 CFR 270.18f-4, and the SEC discussed VaR at length in its adopting release. The fund, firm and people are fictional sample data.
One VaR ratio's path through seven hands in Derivatives Risk Management Program
Agent
Data agent: the inputsFreezes 18,412 positions at the 4:00 pm close, reads each fund’s net assets, prices 31,904 instruments and loads 756 business days of history.
Never: fills a missing price; the fund’s test is held instead
Agent
Test agent: the model runRuns the fund’s relative VaR test on the firm’s risk engine: fund VaR 7.92% of net assets, reference VaR 3.70%, ratio 214%.
Never: changes a parameter, a limit or the reference portfolio
Agent
Verifier agent: the second calculationRecomputes the ratio from the engine’s component VaRs and the index provider’s weights: 214.1%, agreeing to 0.1 point.
Never: releases a ratio it disagrees with
Agent
Explainer agent: the causeAttributes the rise to euro rate futures, now 3.41% of the fund’s 7.92% VaR, citing the trades and the engine’s attribution.
Never: states a cause without a cited source
A person decides
Market risk analystChecks the explanation against its sources and prepares the remediation plan.
Agent
Reporting agent: the documentsCarries the same figures into the quarterly board report, the N-PORT VaR items and, if needed, Form N-RN, each sentence cited to the run.
Never: submits a filing
A person decides
Derivatives risk managerApproves the plan, releases the board report and approves any filing for the chief compliance officer to submit.
What is a value at risk model?
Rule 18f-4 defines VaR as "an estimate of potential losses on an instrument or portfolio, expressed as a percentage of the value of the portfolio's assets (or net assets when computing a fund's VaR), over a specified time horizon and at a given confidence level." A VaR model is whatever produces that estimate: a set of risk factors, a history or a distribution for them, a way of revaluing the portfolio under each, and a percentile.
The SEC was explicit about what the number is not. "VaR will not provide, and is not intended to provide, an estimate of an instrument's or portfolio's maximum loss amount." It is a threshold, not a worst case: it says how often losses should exceed it, and nothing about how far. That is why Rule 18f-4 pairs the daily VaR limit with weekly stress tests, and why VaR backtesting counts how often the threshold is crossed.
Historical simulation vs Monte Carlo VaR, and the parametric model
Rule 18f-4 lets the fund choose. The SEC noted that VaR models "are often categorized according to three modeling methods--historical simulation, Monte Carlo simulation, or parametric models", and declined to prescribe one, to "allow each fund to use a VaR model that is appropriate for the fund's investments." The choice turns mostly on options.
Three VaR models, and how each handles the risks Rule 18f-4 names
| Model | How it works | Options and nonlinearity | Main weakness |
|---|---|---|---|
| Historical simulation | Revalues today’s portfolio under the risk factor changes actually observed over a past window; VaR is the loss at the 1st percentile. | Handles them if positions are fully revalued in each scenario. | Only knows the past window; a calm three years understates risk. |
| Monte Carlo simulation | Draws a large number of hypothetical factor changes from a fitted distribution and revalues the portfolio under each. | Handles them, at a higher computing cost. | Depends on the distribution and correlations assumed. |
| Parametric (delta-normal) | Estimates means, volatilities and correlations and computes VaR from a normal distribution. | Works poorly when options are significant. | Assumes normal returns; misses fat tails. |
What Rule 18f-4 requires of a fund's VaR model
Whatever the method, the rule fixes the inputs it must reflect. The model must "take into account and incorporate all significant, identifiable market risk factors", listing equity, interest rate, credit spread, currency and commodity risk, "material risks arising from the nonlinear price characteristics" of options and embedded optionality, and "the sensitivity of the market value of the fund's investments to changes in volatility". A model that prices options on delta alone, or omits a basis between two markets the fund trades, is out of line with the rule before its first backtest.
The fund and its reference portfolio need not share a model. The SEC rejected a consistency requirement because it "could prevent funds from using less-costly approaches", such as computing an index's VaR from its levels over time or taking it from a vendor. Both sides must still meet the rule's parameters, and the derivatives risk manager reviews the model, its backtesting and the reference at least annually.
Why the three-year window can move the ratio when nothing else does
A historical VaR changes every day even if the portfolio does not, because one day enters the window and one leaves. The SEC described the trade-off when it set three years as the minimum: with a shorter window "each observation will have a greater influence on the result", so that "periods of unusually high or low volatility could result in unusually high or low VaR estimates", while a longer one can run into missing data for newer instruments.
The effect is sharpest when a crisis leaves the window. Three years after a market shock, its worst days drop out of a 756-day history in a single week, and a fund's VaR can fall by a step with no change in positions. Because the reference portfolio's VaR falls too, the ratio may hardly move; when the fund and the reference are exposed to that shock differently, it can move a lot. A derivatives risk manager who sees a ratio jump or drop without a trade behind it should ask first which days entered and left the window. The SEC's footnote makes the opposite point as well, citing the warning that if recent history "were a period of low volatility in market rates and prices, the VaR computed through historical simulation would understate the risk in the portfolio".
Where can a fund's VaR number go wrong?
At every hand-off, and usually without an error message. The table follows the sample fund's ratio stage by stage and pairs each silent failure with the check that catches it. Most of the risks sit outside the model, in inputs and transcription, which is why a model validation alone does not make the number reliable.
Seven stages of one VaR ratio: what can change silently, and the check at each
1Positions
What can change silentlyA late trade or an unsettled allocation is missing from the 4:00 pm snapshot.
The checkPositions frozen at a stated time and reconciled with the custodian; the snapshot time printed beside the result.
2Net assets
What can change silentlyA sub-advised fund’s net assets arrive late from the administrator, and yesterday’s figure is used.
The checkThe test waits for, or is held without, the day’s net assets; the source is named.
3Prices and history
What can change silentlyA missing price is filled from the day before; a bad tick enters the three-year window.
The checkMissing prices hold the fund’s test; history changes are versioned.
4The model run
What can change silentlyA parameter, factor mapping or engine version changes between days.
The checkLocked rule parameters; firm settings versioned with an approver; engine version recorded with each run.
5The reference VaR
What can change silentlyIndex weights from the wrong date, or a blend that no longer matches its approval.
The checkThe reference recomputed from the index provider’s weights for the test date.
6The ratio
What can change silentlyCopied into a limit workbook, rounded differently, or pasted into the wrong row.
The checkAn independent recomputation, and the ratio carried from the run into every report, never retyped.
7Board report and filings
What can change silentlyA figure in the quarterly report or Form N-PORT no longer matches the run log.
The checkEvery figure in a report cited to the run that produced it, and checked by a person before release.
Two of these fired on the sample firm's night of October 15, 2026. An options-income ETF was missing 14 option prices, so its test was held until the vendor re-delivered. And the engine had used September 30 index weights for an inflation-linked bond fund's reference portfolio; the Verifier caught it, and the re-run on October 1 weights gave 121%. In a workbook, both would have produced a number.
VaR model limitations the SEC acknowledged
The SEC adopted a VaR limit with its eyes open. It recognised "risk literature critiques of VaR (especially since the 2007-2009 financial crisis)": that VaR "does not reflect the size of losses that may occur on the trading days during which the greatest losses occur", and that "VaR calculations may underestimate the risk of loss under stressed market conditions." It quoted research that "for especially fat-tailed return distributions the VaR threshold value might appear to be low, but the actual amount of value at risk is high".
It also conceded that "VaR is not itself a leverage measure", while arguing that comparing a fund's VaR with an unleveraged reference's shows whether derivatives are being used to lever the portfolio. Its answer to the critiques was the rest of the program: weekly stress tests for the tail, weekly backtests for the model, and a derivatives risk manager to judge both. A VaR ratio is one input to that judgement, which is why its path has to be traceable.
What stood behind one night's ratios in Derivatives Risk Management Program
18,412
positions frozen at the 4:00 pm close for 45 funds
31,904
instruments priced, with 756 business days of history
2
funds held and re-run: a missing price, then stale index weights
0.1pt
gap between the engine’s ratio and the second calculation for the fund over its limit
How is the VaR ratio reported on Form N-PORT and to the board?
In three places, from the same daily figures. On Form N-PORT each full-program fund reports, for the period, its "Median daily VaR ... reported as a percentage of the Fund's net asset value", its "Median VaR Ratio ... reported as a percentage of the VaR of the Fund's Designated Reference Portfolio", the name and identifier of its designated index, and its number of backtesting exceptions. Only the index is public; the SEC keeps the VaR figures and the exception count confidential.
To the board, the derivatives risk manager reports at a frequency the board sets on guideline exceedances, stress tests and backtests, and once a year on the program and the reference portfolio. If a fund stays over its limit for five business days, the ratio goes into a written report to the board and, through Part E of Form N-RN, to the SEC, with the fund's VaR and the reference VaR for every day over the limit. Each of those numbers must match the five years of daily records the rule requires.
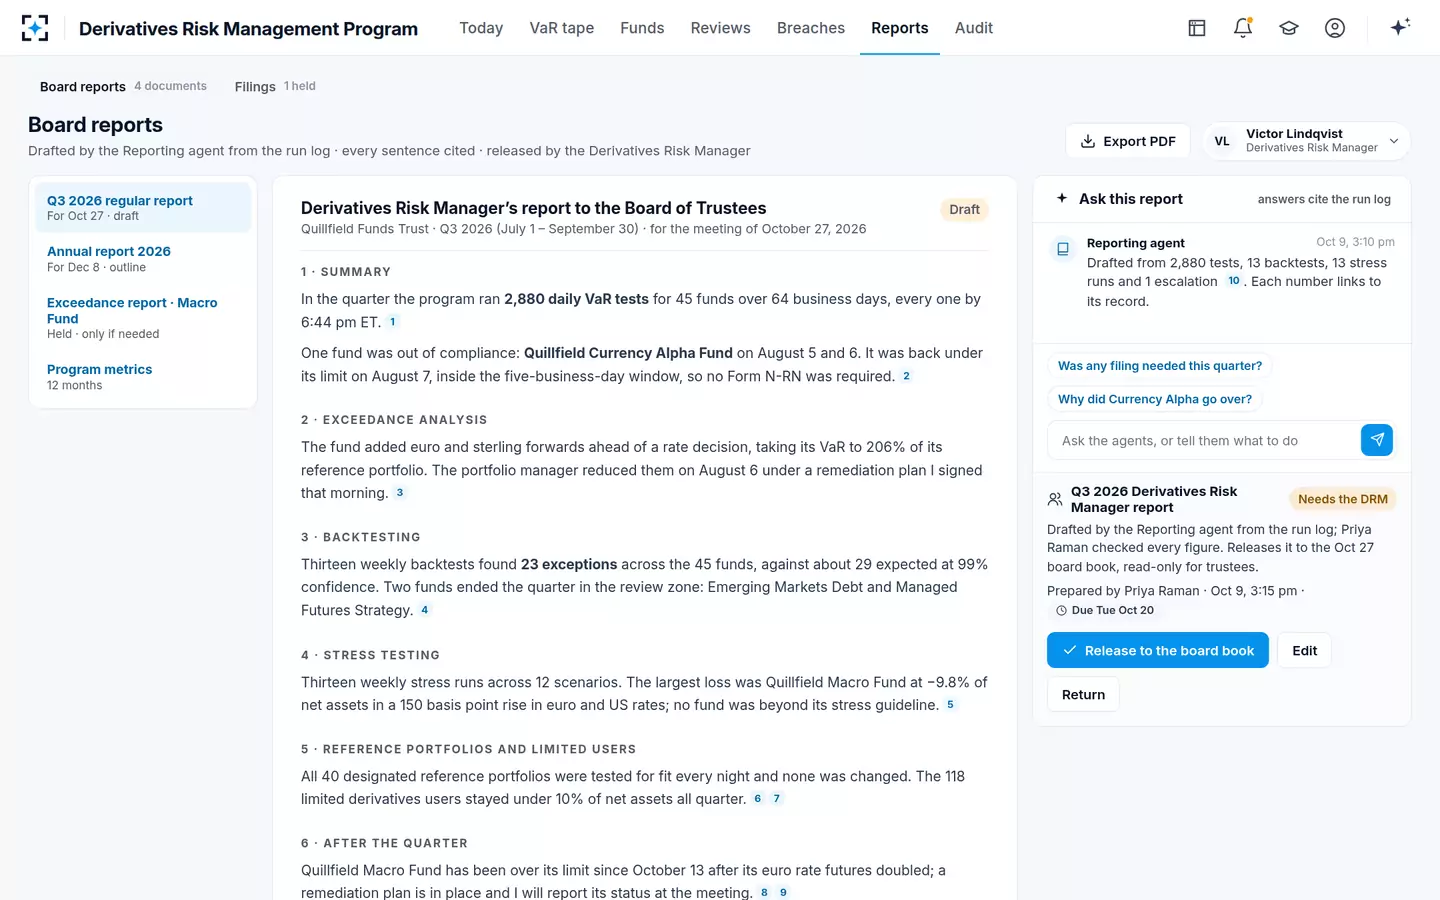
The quarter's board report, written from the run log, every figure cited
Testing the path, not just the model
Model validation asks whether the method is sound. A path test asks whether today's number is the number the method produced from today's inputs, and whether the board saw that number. It can be run on any past date: take the fund's positions and net assets for that day, recompute the fund and reference VaR independently, and compare the ratio with what the limit report, the board report and the N-PORT median say. Any gap is a finding, whatever its size.
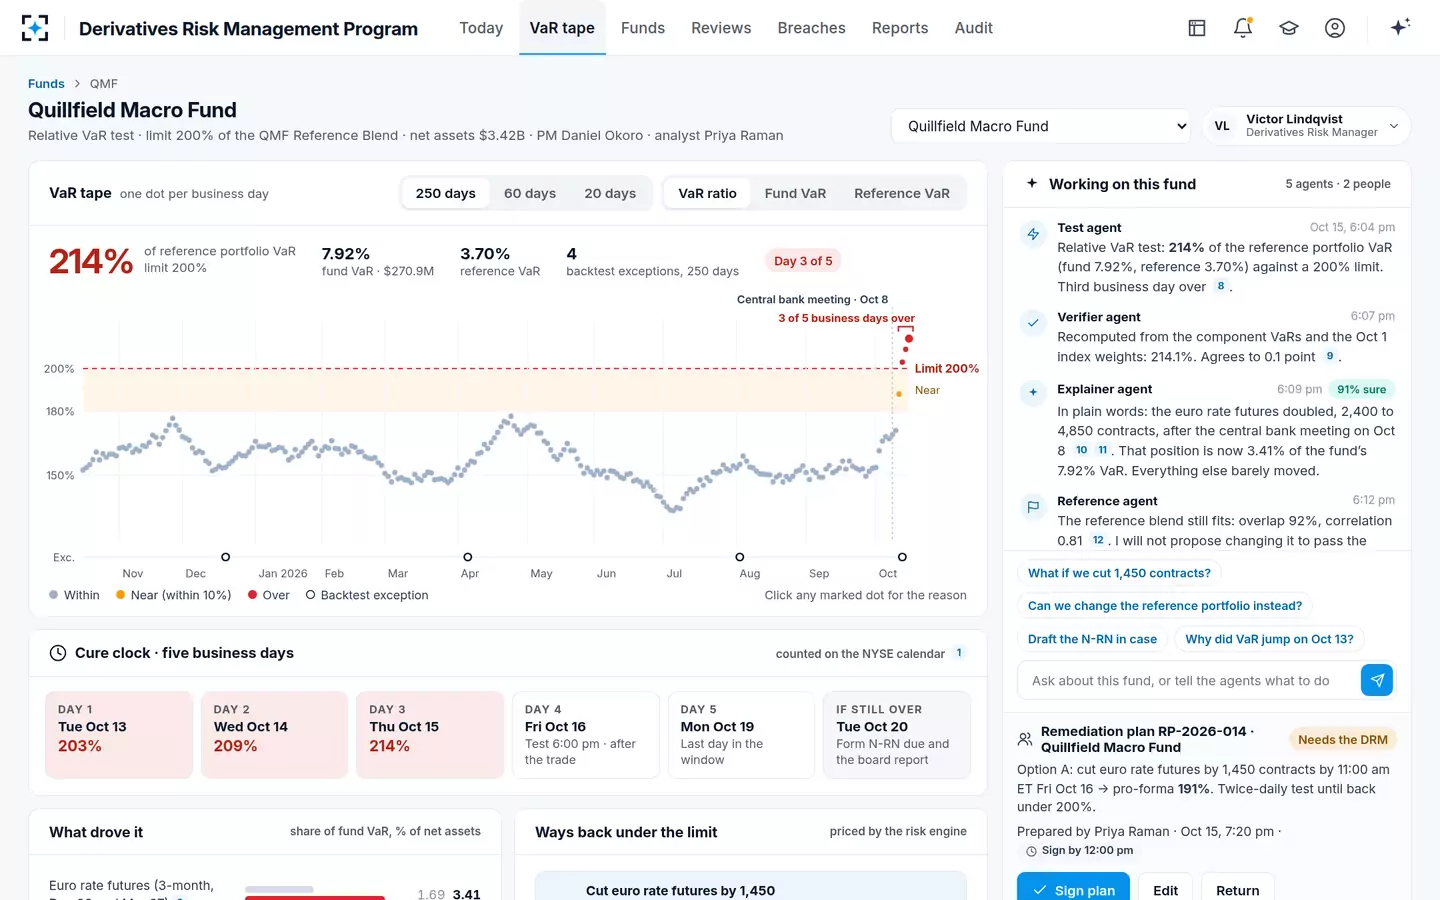
Three measurements make the test concrete: the share of daily ratios that a second calculation reproduces within a stated tolerance; the share of report figures that trace to a run; and the number of days a fund was tested on incomplete inputs. In Derivatives Risk Management Program the first is the Verifier's job every night, the second is built into the Reporting agent's citations, and the third is zero by design because a fund with missing inputs is held rather than tested. What a ratio looked like on the tape, and how the cause was found, is shown below; how the reference side of the ratio is chosen is covered in what relative VaR measures, and how the same checks work outside an engine in value at risk in Excel.
The ratio on the tape: 250 business days, one dot each
The whole path, from the 4:00 pm snapshot to the released board report, is the subject of Derivatives Risk Management Program.
Questions people ask
What is value at risk, in one sentence?
The loss a portfolio is not expected to exceed, at a given confidence, over a given horizon; at 99% over 20 days, a loss that should be exceeded in one 20-day period in a hundred. It is not the maximum loss, and says nothing about how large the losses beyond it can be.
How do you calculate value at risk?
Choose the horizon and confidence (Rule 18f-4: 20 trading days, 99%), model how the portfolio's risk factors can move (from history, simulation or a fitted distribution), revalue the portfolio under each move, and read off the loss at the 1st percentile. For a fund the result is expressed as a percentage of net assets.
Which VaR model does Rule 18f-4 require?
None in particular. The rule fixes the confidence level, the horizon, the minimum three years of data and the risk factors the model must capture, including options' nonlinearity and volatility, and leaves the method to the fund. The SEC noted that parametric models can mislead for portfolios with significant options.
Is a fund's VaR public?
No. The median daily VaR and median VaR ratio a fund reports on Form N-PORT are confidential, as is its backtesting count. The public N-PORT shows only the fund's designated index or that it uses its securities portfolio.
Can a fund change its VaR model?
Yes, but the change is recorded. Rule 18f-4 requires a fund to keep a record of every update to its VaR models, with the basis for any material change, for five years, and the derivatives risk manager's annual review covers the model and its backtesting.