To calculate value at risk in Excel by historical simulation, put each day's change in every risk factor in its own column, multiply today's positions by each historical change to get a column of hypothetical profit and loss, and take the 1st percentile of that column with PERCENTILE.INC(range, 0.01): its absolute value is the one-day VaR at 99%. The parametric shortcut is one formula, NORM.S.INV(0.99) * STDEV.S(returns) * SQRT(horizon), about 2.33 standard deviations scaled by the square root of the horizon. Both are fine for learning and for a single portfolio. A fund that relies on SEC Rule 18f-4 needs more than a formula, though: the same test on every fund every business day, at 99% over 20 trading days on at least three years of data, compared with a reference portfolio, kept for five years, and right on the days it matters. A workbook can compute that number; it cannot tell you when its own inputs, ranges or copied ratios are wrong. Botminds' Derivatives Risk Management Program is built around that gap: one agent runs the test on the firm's risk engine and a different agent recomputes it before anyone sees it.
Excel formulas below use standard worksheet functions; the regulatory parameters are those of 17 CFR 270.18f-4. The worked numbers are illustrative, and the screens show a fictional sample firm.
Historical simulation VaR in five spreadsheet columns, to the Rule 18f-4 standard
| Column | What it holds | Example formula or rule | Rule 18f-4 check |
|---|---|---|---|
| A · Date | One row per business day of history | 756 rows for three years of 252 days | At least three years of historical market data |
| B–D · Risk factor changes | Daily or 20-day returns for each price, rate, spread, currency and volatility the fund is exposed to | =Price_t / Price_t-20 − 1 for overlapping 20-day changes | All significant, identifiable risk factors, including volatility and option nonlinearity |
| E · Scenario P&L | Today’s positions revalued under each historical change | =SUMPRODUCT(exposures, B:D on that row), or a full revaluation for options | Nonlinear instruments revalued, not just multiplied by a delta |
| F · VaR | The loss at the 1st percentile of column E, as a share of net assets | =−PERCENTILE.INC(ScenarioPL, 0.01) / NetAssets | 99% confidence, 20 trading days |
| G · Ratio | Fund VaR divided by the reference portfolio’s VaR from the same steps | =F_fund / F_reference | Relative test: at most 200% (250% for some closed-end funds) |
How to calculate value at risk in Excel: historical simulation, step by step
Historical simulation applies the past to today's portfolio. The SEC's definition in its adopting release is a good specification for a workbook: it "involves taking a fund's current portfolio, subjecting it to changes in the relevant market risk factors observed over a prior historical period, and constructing a distribution of hypothetical profits and losses", and VaR is found "by looking at the largest (100 minus the confidence level) percent of losses in the resulting distribution" (85 FR 83162, n.425).
For a fund on Rule 18f-4, two choices in the workbook matter most. The horizon is 20 trading days, so column B to D should hold 20-day changes; the SEC's staff used overlapping 20-day windows, which turns 756 days of prices into 736 scenarios. And the percentile rests on very few points. With 736 scenarios, PERCENTILE.INC at 1% interpolates between the 8th and 9th worst losses, so moving one bad week in or out of the window can move VaR visibly.
The SEC knew this when it chose three years as a minimum. It cited a 1996 Federal Reserve Bank of New York study finding that "[e]xtreme [confidence level] percentiles such as the 95th and particularly the 99th are very difficult to estimate accurately with small samples", and added that "Derivatives risk managers can base their VaR calculations on additional historical data if they choose." A workbook that silently drops the oldest day each morning is doing what the rule allows; it should also show what changed when that day was a crisis day.
The value at risk Excel formula, parametric version
The parametric formula assumes returns are normal: VaR = z × σ × √h × value, where z is NORM.S.INV(0.99), about 2.326, σ is the standard deviation of daily returns, and h is the horizon in days. With a daily σ of 1.0%, one-day VaR at 99% is about 2.33% of value; scaled by √20, about 4.47, the 20-day VaR is about 10.4%.
One parametric VaR, worked to the Rule 18f-4 horizon
2.326
standard deviations at 99% confidence, the z-score
2.33%
one-day VaR with a daily standard deviation of 1.0%
4.47
the square root of 20 trading days, the multiplier to the rule’s horizon
10.4%
20-day VaR on the same assumptions
It is the quickest number and the most fragile one. The SEC warned that "some parametric methodologies may be more likely to yield misleading VaR estimates for assets or portfolios that exhibit non-linear returns, due, for example, to the presence of options", and the rule requires a fund's model to capture the nonlinear behaviour of options and the fund's sensitivity to changes in volatility. A delta-normal spreadsheet does neither for an options-heavy fund. Choosing between historical, Monte Carlo and parametric models is covered with the rest of the model's path.
How do you scale one-day VaR to the 20 days Rule 18f-4 requires?
Two ways, and they can give different answers. The shortcut multiplies a one-day VaR by the square root of 20, about 4.47, which is exact only if daily returns are independent and identically distributed. The direct route computes 20-day changes from the history itself, as the SEC's staff did with overlapping windows, so that runs of bad days and changes in volatility stay in the data rather than being averaged away.
A fund needs the one-day number anyway. Rule 18f-4's backtest compares each business day's actual gain or loss with that day's VaR estimated over a one-day horizon, so the same model has to produce a one-day VaR for the backtest and a 20-day VaR for the limit. A workbook that scales the first into the second ties them together; one that computes both directly can let them drift apart, and should show both side by side so the drift is visible.
Where a VaR spreadsheet breaks
A VaR workbook usually fails quietly, through its inputs and its plumbing rather than its formula. None of the failures below produces an error message; each produces a plausible number.
Six quiet failures of a VaR workbook, and the check that catches each
What happens in the workbook: A blank cell is filled with yesterday’s price so the sheet calculates.
The independent check: A completeness check that holds the fund’s test until the price arrives, and says so.
What happens in the workbook: A new day is appended but the percentile still reads rows 2 to 757.
The independent check: A second calculation from the raw history that must agree before the result is used.
What happens in the workbook: Index weights from the previous month-end feed the reference VaR.
The independent check: Recomputing the reference from the index provider’s weights for the test date.
What happens in the workbook: The ratio is pasted into a limit workbook, with one row out of line.
The independent check: Ratios that reach people only from the run that produced them, never retyped.
What happens in the workbook: Day five of a breach is counted on the wrong side of a holiday.
The independent check: A cure clock on the exchange’s business-day calendar, written into the program.
What happens in the workbook: A parameter or formula is changed with no record of who or why.
The independent check: Versioned settings: proposed by one person, approved by another, with a reason.
The recordkeeping line is the one a workbook most often misses. An edited formula is an update to the VaR calculation model, and the rule requires the fund to record it and the basis for any material change. A spreadsheet's version history records that a cell changed, not who approved it or why.
Who should check a VaR calculation? The maker-checker control
Someone, or something, that did not make it. A maker-checker control assigns preparing a result and verifying it to different people, so that one person's error or bias has to pass a second, independent view before it counts. Rule 18f-4 already applies the principle between functions: the program's functions must be reasonably separated from portfolio management. The same logic applies inside the program, between the run and its check.
A workbook makes this hard because the checker usually opens the maker's file. Re-reading someone's formulas finds typos; it does not find a wrong input, a wrong date or a wrong assumption, because the checker inherits them. An independent check recomputes from the source: the raw positions, the provider's prices and index weights, and the engine's component VaRs, arriving at the ratio by a different route.
Supervisors frame the same idea for automated tools. The Financial Stability Board lists "model risk, data quality and governance" among the AI-related vulnerabilities that "stand out for their potential to increase systemic risk" (FSB, November 2024). ESMA, writing about investment services in May 2024, held that using AI moves no responsibility away from a firm's management body (ESMA public statement).
Maker and checker in Derivatives Risk Management Program: a daily VaR test with agents
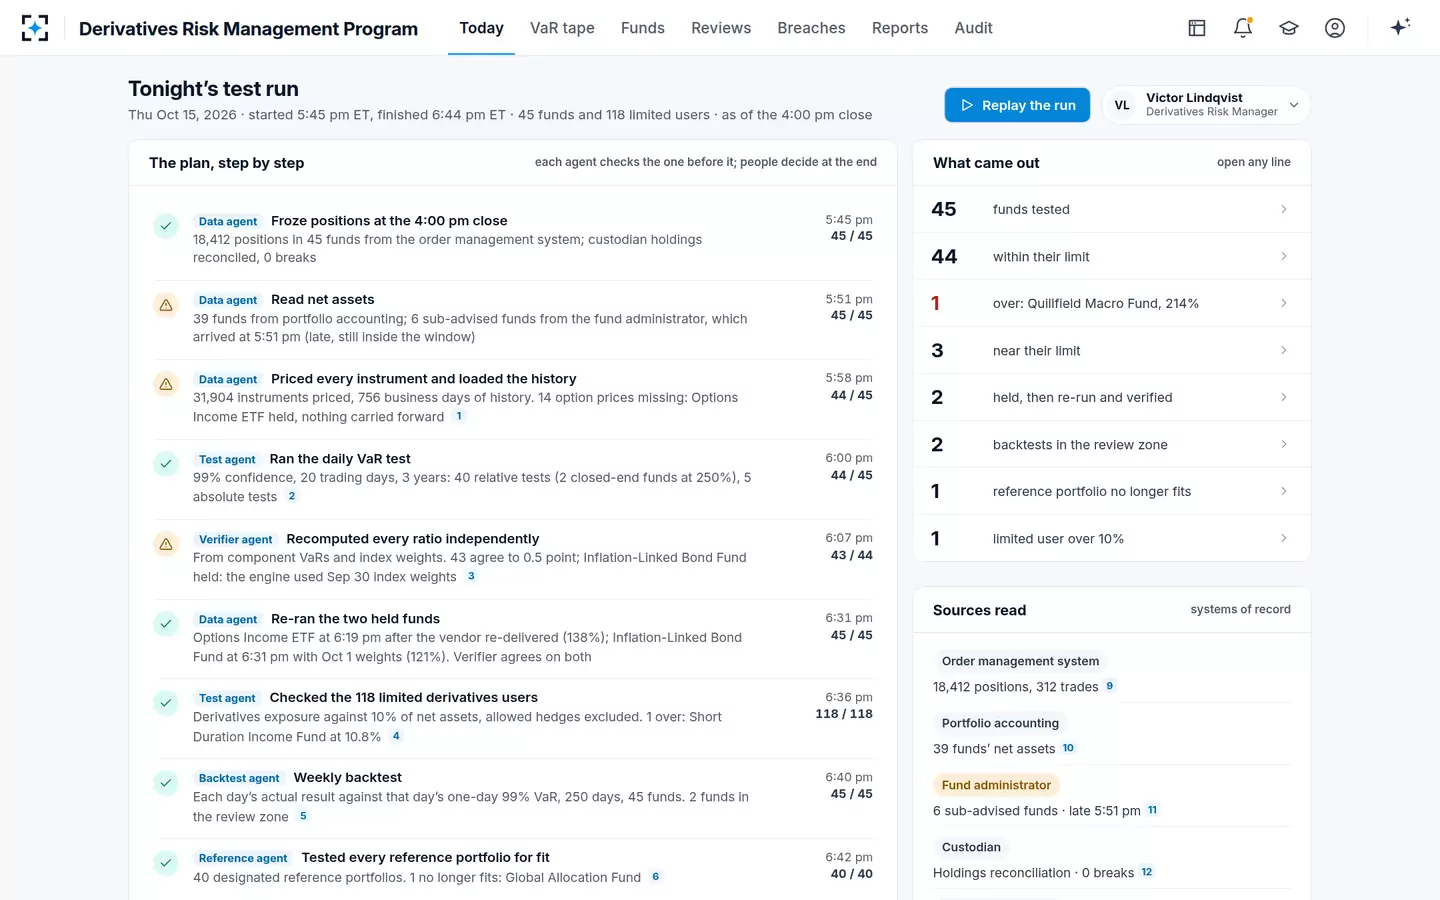
In Derivatives Risk Management Program, the run and the check are separate agents with separate limits, and the people come after both. The Test agent runs each fund's relative or absolute test on the firm's own risk engine, with the firm's model and parameters. The Verifier agent then recomputes every ratio from the engine's component VaRs and the index provider's weights. A result the Verifier disagrees with is held, re-run or escalated; it never reaches a person as a finished number.
One VaR test, four hands: the agent that runs it never checks it
Agent
Data agentFreezes positions at the close, reads net assets, prices every instrument and loads three years of history; checks that nothing is missing.
Never: fills or carries forward a missing price; it holds the fund’s test instead
Agent
Test agentRuns the daily relative or absolute VaR test on the firm’s risk engine at 99%, 20 trading days, three years; prices what-ifs on request.
Never: changes a model parameter, a limit or a reference portfolio
Agent
Verifier agentRecomputes each ratio from component VaRs and the index provider’s weights before anyone sees it.
Never: publishes a result it disagrees with; it holds it and re-runs or escalates
A person decides
Market risk analystChecks any explanation against its cited sources and prepares the plan or review.
A person decides
Derivatives risk managerApproves remediation plans, reference changes and model reviews, each with a reason code.
The design caught two errors on the sample firm's night of October 15, 2026. The Data agent found 14 option prices missing for an options-income ETF and held its test rather than carry yesterday's prices forward; the vendor re-delivered and the fund re-ran at 6:19 pm. The Verifier found that the engine had used September 30 index weights for an inflation-linked bond fund's reference portfolio; re-run on October 1 weights, the ratio was 121%. Neither error would have shown up in a workbook's formulas.
A night's run in Derivatives Risk Management Program: held twice, re-run, verified
What agents may and may not do with a VaR model
VaR is statistics, not artificial intelligence, and nothing in Rule 18f-4 needs a language model to compute it. What agents add is the work around the number: checking inputs, recomputing, explaining a breach or a backtest exception with citations, counting days, drafting reports. Examiners have noticed the trend: the SEC's fiscal 2027 priorities use the term "super intelligence (SI)" for these tools, already at work in firms' compliance monitoring, and say the test is whether firms keep meeting their existing duties, which the SEC calls "technology-neutral" (SEC Division of Examinations). The obligations under Rule 18f-4 stay with the derivatives risk manager whoever does the arithmetic.
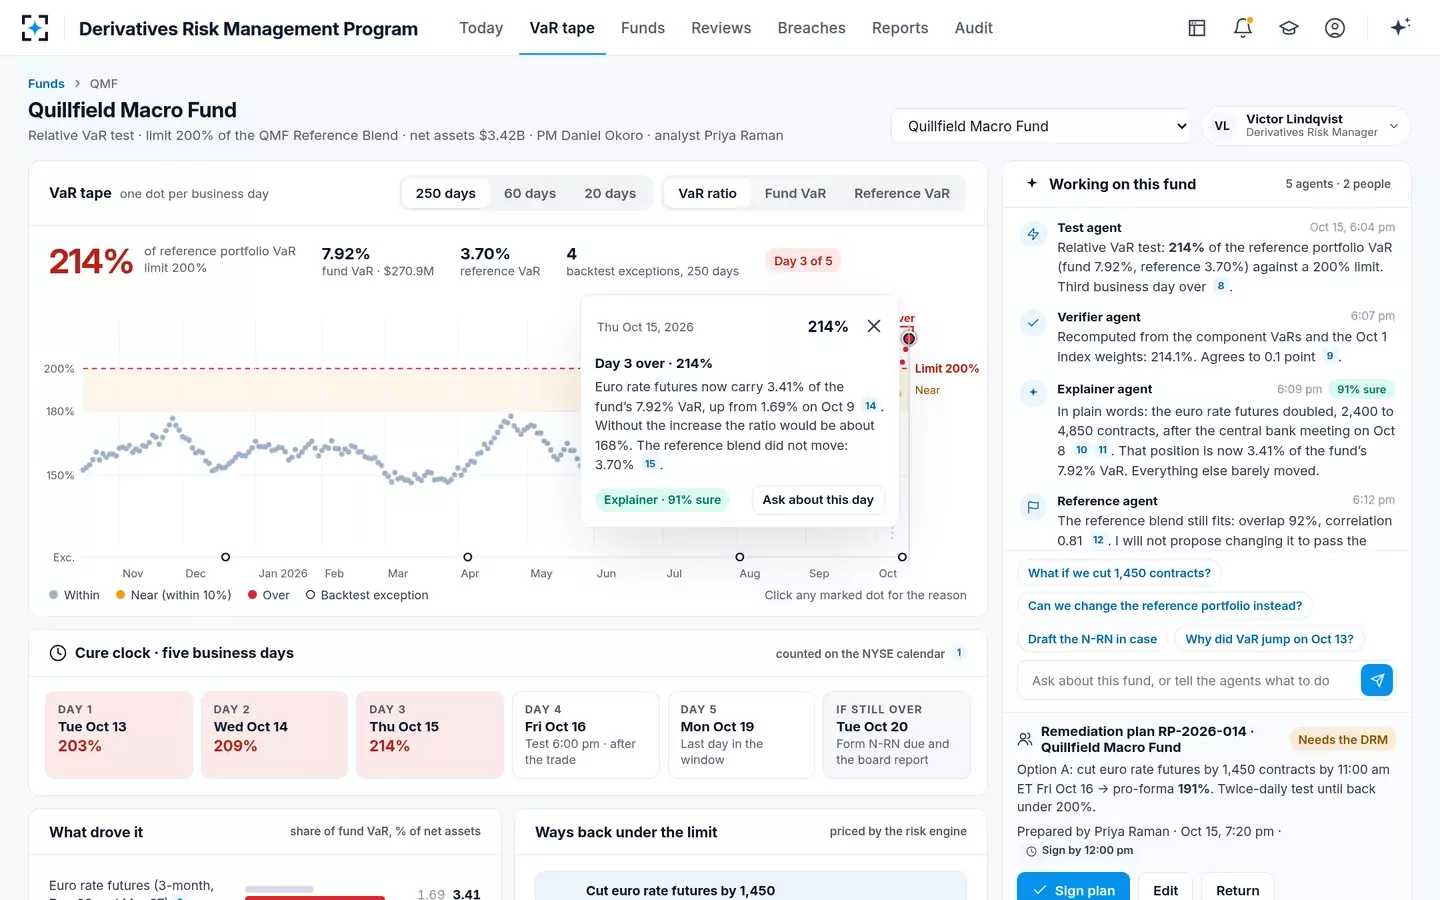
So the useful limits are about authority, not ability. In the solution no agent changes a model parameter, a limit or a reference portfolio; the Explainer never states a cause without a cited source and hands the question to an analyst below 80% confidence; and every agent's work is on the audit trail. Those limits are what let a derivatives risk manager rely on the output.
An explanation with its sources and its confidence
Excel or software for a fund's daily VaR test: what to look for
A workbook can be enough for a single fund, a small complex, or a second check on an engine. It stops being enough when the test runs every night on dozens of funds, when the people who maintain it also review it, and when the board and examiners ask for any day's number with its evidence. Whatever the tool, the same six properties decide whether a daily VaR test can be relied on.
Six properties of a VaR test you can rely on, in Excel or not
- Holds on missing data
A fund with a missing price or late net assets is held and flagged, never calculated on yesterday’s numbers.
- An independent recomputation
Every ratio recomputed by a different route before anyone relies on it, with any disagreement held.
- Locked rule parameters
99%, 20 trading days, at least three years, 200% and 20%: not editable by the people who run the test.
- Versioned firm settings
Near-limit warnings, test time and calendar changed only with an approver and a reason.
- One source for every number
The ratio in the limit report, the board report and Form N-RN comes from the same run, never retyped.
- Five years on demand
Any day’s fund VaR, reference VaR and ratio retrievable with its inputs, as the rule’s records require.
Where the solution fits, and where it does not: Derivatives Risk Management Program does not replace a risk engine or a VaR model. Its Test agent runs the firm's own engine and its Verifier checks the result; a firm calculating VaR only in Excel needs an engine first, or uses the workbook as the engine with the same checks around it. The broader buying question, what a fund pays for when it buys value at risk software, is taken up in the cost of a wrong VaR day, and the weekly test of whether the model is right in VaR backtesting for funds. The checks described here are on the Derivatives Risk Management Program page.
Questions people ask
What Excel function calculates VaR?
There is no single VaR function. Historical VaR uses PERCENTILE.INC (or PERCENTILE.EXC) on a column of scenario profit and loss at 0.01 for 99%; parametric VaR combines NORM.S.INV(0.99), STDEV.S and SQRT of the horizon. Either result is a loss, so the sign is usually flipped.
Should a VaR workbook use PERCENTILE.INC or PERCENTILE.EXC?
Either, consistently. With about 736 scenarios, PERCENTILE.INC at 0.01 interpolates between the 8th and 9th worst outcomes and PERCENTILE.EXC between the 7th and 8th, so the exclusive version gives a slightly larger loss. Whichever the program chooses belongs in its written methodology, because switching is a model change.
How many days of data does a VaR spreadsheet need for Rule 18f-4?
At least three years of historical market data, about 756 business days; more is allowed. With overlapping 20-day returns that gives about 736 scenarios, so the 1st percentile rests on the eighth and ninth worst outcomes.
Is a spreadsheet acceptable for Rule 18f-4 compliance?
The rule does not prescribe tools; it prescribes the model's parameters, a daily test, weekly backtests and five years of records, including model updates and their basis. A spreadsheet that meets those requirements and is checked independently can comply; the risk is in the controls around it, not the software.
Who should check a fund's VaR calculation?
Someone other than the person or process that produced it, recomputing from source data rather than re-reading the same workbook. Rule 18f-4 separates the program from portfolio management; a maker-checker control applies the same separation inside the program.