In type 2 diabetes life insurance underwriting, A1C levels show whether an applicant has crossed into diabetes and how well it is controlled, and life underwriters read them against the same clinical ranges doctors use: below 5.7% is normal, 5.7% to 6.4% is prediabetes and 6.5% or above is diabetes, in the CDC's thresholds. What an A1C of 7 or 7.5 does to a rating class is not public. It is set in each carrier's underwriting manual and its reinsurer's, and it depends on the trend, the treatment, the age at diagnosis and whether there are complications. That makes the reading as important as the rule: one A1C copied wrong, dated wrong or counted twice changes what the underwriter sees. Botminds' APS Summarization pulls every reading from the attending physician statement and the exam, charts it with its page, and leaves the rating to the underwriter.
The example is a fictional sample case: a 52-year-old applicant for $2,500,000 of 20-year term whose 312 pages of records contain five A1C readings on five pages from four sources. The clinical facts come from the CDC and the National Institutes of Health, linked where they appear.
One A1C reading's five stops in APS Summarization, from fax to decision
Agent
1 · The pagePage 276, an outside lab report dated 15 July 2025: hemoglobin A1C 7.1%. The record sorter has dated the page and filed it under the outside laboratory it came from.
Never: guesses a date the page does not show; an unreadable page goes to a person
Agent
2 · The unit and the methodThe lab extractor records 7.1 with its unit (%), the laboratory, the specimen date and the page. A value in another unit is converted on screen, with the conversion shown.
Never: drops the unit or the laboratory
Agent
3 · The repeatThe endocrinology note on page 175 quotes the same 7.1%. The extractor recognises a repeat of one reading, not a second test, and charts one point with both pages behind it.
Never: counts a quoted value as a new reading
Agent
4 · The rangeThe point is drawn against the carrier’s ranges, here the CDC’s: normal below 5.7%, prediabetes 5.7–6.4%, diabetes 6.5% or above.
Never: fills a gap between readings or smooths the line
Agent
5 · The sentenceThe summary writer places it in the diabetes section: "A1C 7.1% in July 2025 and 6.6% at the paramedical exam in September 2026", citing pages 276 and 288.
Never: states what the value means for the class
A person decides
The decisionThe underwriter and, on referral, the medical director read the line from 6.1% to a 7.8% peak and back to 6.6% on two medicines, and rate the case under the carrier’s manual.
What A1C is acceptable for life insurance?
There is no single acceptable A1C, and anyone quoting one is quoting a particular carrier. The clinical ranges are public. The CDC uses "Normal: below 5.7%", with 5.7% to 6.4% for prediabetes and 6.5% or above for diabetes, and the National Institutes of Health adds that within the prediabetes band "the higher the A1C, the greater the risk of diabetes". How those ranges map to preferred, standard or table ratings is written in carriers' and reinsurers' manuals, which are commercial documents and not published.
What the manuals have in common is that they rate people, not numbers. An applicant whose diabetes was diagnosed young, whose A1C has climbed for years and who has kidney changes is a different risk from one diagnosed at 50 whose A1C came down on two oral medicines. The NIDDK makes the clinical version of the same point: "an A1C level that is safe for one person may not be safe for another." The underwriter's job is to see which person the file describes, and that takes every reading, in order.
Do life insurance companies check A1C, and where do the readings come from?
Yes, from two places: the insurer's own exam and the applicant's medical records. The NAIC describes traditional life underwriting as including "a physical exam with doctor’s notes, blood work, and urine analysis", and on the sample case the paramedical blood panel included one. The attending physician statement then supplies the history: every A1C the doctor's office, the specialist and any outside laboratory recorded.
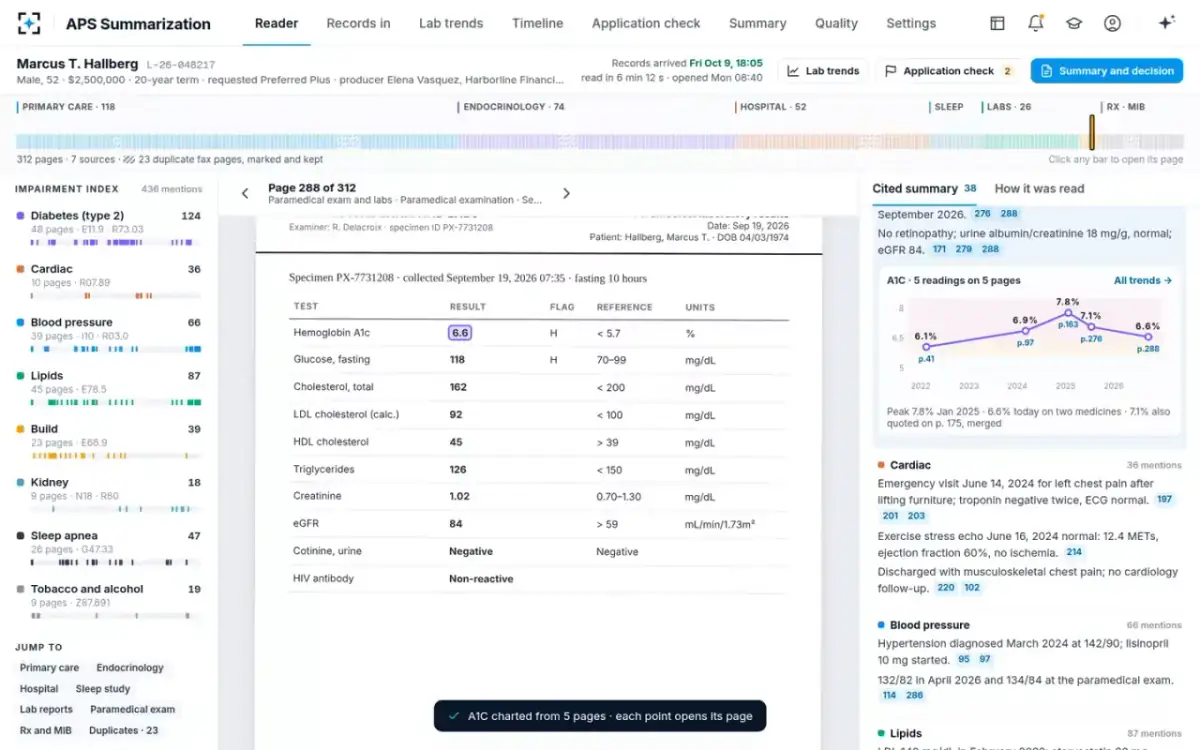
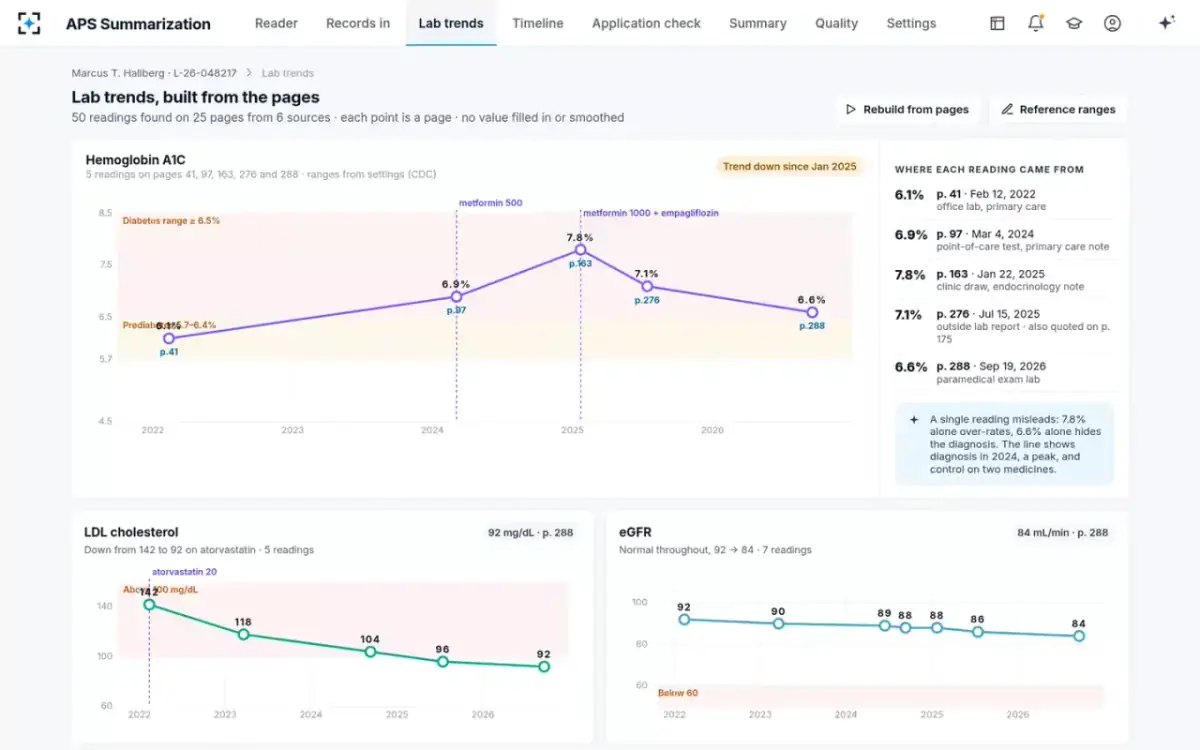
On the sample case the five readings come from four sources: the primary care office (6.1% in February 2022 on page 41, and a point-of-care 6.9% in March 2024 on page 97), the endocrinologist (7.8% in January 2025, page 163), an outside laboratory (7.1% in July 2025, page 276) and the paramedical exam (6.6% in September 2026, page 288). They sit 247 pages apart. A reader working front to back meets them in fax order, not date order, and has to hold all five in mind to see the shape.
Five A1C readings, five pages: the line the underwriter rates
Stop 1 and 2: the page, the unit and the method
A reading is only as good as its date and its laboratory. A faxed lab report carries at least three dates (collection, report, fax), and the one that matters is collection. An A1C quoted in a progress note may be from that day's draw or from a report weeks earlier. The record sorter dates every page from what the page says, and the lab extractor records each value with its specimen date, unit, laboratory and page, so the chart's x-axis is the date of the blood, not the date of the paperwork.
The method matters too, more than most underwriters are taught. The NIDDK warns that "The A1C test may give false results in people with certain conditions": a falsely high result can occur with iron-deficiency anaemia, and kidney failure, liver disease and some hemoglobin variants can also distort it. Those conditions are themselves in the records, which is why the summary keeps A1C beside the kidney and blood findings rather than alone. A point-of-care test and a laboratory test are both A1C, but they are not the same instrument; recording which is which costs nothing and can explain a jump.
"an A1C reported as 6.8 percent on one test could be reported in a range from 6.4 to 7.2 percent on a repeat test from the same blood sample."
NIDDK, The A1C Test & Diabetes
That precision note changes how to read small movements. A fall from 7.1% to 6.6% over fourteen months, on new medicine, is a trend. A difference of a few tenths between two tests in the same month is within what the test itself can produce. A chart that shows every point with its source lets the reader see which is which.
Stop 3: the repeat that looks like a second test
Records quote each other, and a quoted value is not a new reading. On the sample case the endocrinologist's note on page 175 mentions the 7.1% from the outside laboratory report on page 276. Counted twice, it would look like two tests confirming each other; charted twice, it would flatten the fall toward 6.6%. The lab extractor merges them into one point with both pages behind it, and the chart's note says so: "7.1% also quoted on p. 175, merged."
The sample carrier's monthly audit shows the same failure from the other side. One of the seven corrections in September was an A1C of 5.9% quoted on two pages, merged correctly, but cited only to the later page; both pages are cited now. Merging is right; losing the source of the earlier mention is not. Duplicate fax pages are the cruder version of the same problem: the sample file had 23, all marked and kept, so no citation can point at a page that has been thrown away.
Charted from five pages in APS Summarization: each point opens its page
Stop 4: does one high A1C affect life insurance?
It can, which is why one reading should never stand alone. A single 7.8% from the endocrinologist's first visit, read in isolation, describes diabetes that is not controlled. A single 6.6% from the paramedical exam, read in isolation, is barely over the diabetes threshold and could be mistaken for a borderline result in someone without a diagnosis. Both are true readings of the same person, a few months apart in his treatment. The NIDDK notes that A1C reflects average glucose over about three months and that "blood glucose levels within the past 30 days have a greater effect on the A1C reading than those in previous months", so each value is a snapshot of one season of control.
Rating from one A1C level vs rating from the line
One reading: Reads as uncontrolled diabetes; over-rates an applicant whose control improved
All five, charted with their pages: Shown as the January 2025 peak, the visit at which a second medicine was added
One reading: Barely over 6.5%; on its own it can hide that there is a diagnosis at all
All five, charted with their pages: Shown as the current value on two medicines, three weeks old at the decision
One reading: Prediabetes; easy to miss in a 118-page primary care chart
All five, charted with their pages: Shown as where the line began, in 2022, with the family history on page 12
One reading: A number to argue about
All five, charted with their pages: “The trend is the story — controlled on two oral agents, no complications.”
Stop 5: from the chart to the sentence and the decision
The summary sentence is the last place a reading can go wrong, by being rounded, reordered or interpreted. The sample's diabetes section reads, in order: prediabetes noted February 2022, A1C 6.1%; type 2 diabetes diagnosed March 4, 2024, point-of-care A1C 6.9%, metformin 500 mg started; A1C peaked at 7.8% in January 2025, metformin raised and empagliflozin added; 7.1% in July 2025 and 6.6% at the paramedical exam in September 2026; no retinopathy, urine albumin/creatinine normal, eGFR 84. Every clause cites its page. None says "well controlled" or names a class.
The interpretation belongs to people. On the sample case the senior underwriter proposed Standard, not the Preferred Plus requested, and referred it because the carrier sends cases over $2,000,000 with two or more impairments to its medical director; he agreed, subject to an amendment of the application. The agents' job ended at the cited line. How the same reading moves through the whole file is traced in APS summary for the insurance underwriter, traced page by page.
Lab trends: every reading built from the pages, nothing filled in
How far back do life insurers look at A1C?
As far back as the records go, which is set by what the doctor keeps and what the authorization covers, not by a fixed rule. On the sample case the primary care chart ran from June 2019, and the first A1C in it was 2022. Older readings matter less for the current rating than for the shape of the history: when prediabetes began and how fast it moved. The legal limits on how far back records reach, from doctors' retention rules to consumer-report law, are set out in how far back life insurance companies check medical records.
One limit is specific to lab data and worth knowing. Florida bars life insurers from using genetic test results absent a diagnosis, but its statute adds that "Nothing in this section prohibits a life insurer or long-term care insurer from considering a medical diagnosis included in an individual’s medical record, even if a diagnosis was made based on the results of a genetic test." An A1C is not a genetic test; a diagnosis of a hereditary form of diabetes in the chart is a diagnosis, and the summary carries it as one.
A reader's checklist for A1C levels on a life insurance file
Whoever reads the file, by hand or with agents, the same five checks keep the A1C history honest. They are the stops above turned into questions an underwriter or auditor can ask of any summary.
Five checks before an A1C level reaches a life insurance decision
- Is every reading dated by its specimen, not its fax?
Collection date on the lab page, not the date the office sent it.
- Does each reading name its unit, method and laboratory?
A point-of-care test and a lab draw differ; a value in another unit needs its conversion shown.
- Has any quoted value been counted as a new test?
A note that repeats a lab result is one reading with two pages.
- Is anything in the file that can distort A1C?
The NIDDK names iron-deficiency anaemia, kidney failure, liver disease and hemoglobin variants.
- Is the decision made on the line, with the treatment drawn on it?
Peak, latest and first reading together, with the medicine changes marked.
The full sample case, from the fax on Friday evening to the signed decision, is on the APS Summarization page.
Questions people ask
How is an applicant with an A1C of 7 underwritten?
It depends on the carrier: no public rule sets a cut-off. An A1C of 7% is in the CDC's diabetes range, so the case is underwritten as diabetes, and the age at diagnosis, the trend, the treatment and any complications weigh as much as the number. On the fictional sample case a 7.8% peak and 6.6% today ended in Standard, subject to an amendment: one sample decision, not a rule.
Does any A1C level qualify for preferred by itself?
No public source sets one. Preferred criteria are each carrier's, built with its reinsurers, and are not published. An A1C in the CDC's normal range, below 5.7%, does not by itself earn a class; the class depends on the whole file.
What is a normal A1C?
Below 5.7%, according to the CDC; 5.7% to 6.4% is prediabetes and 6.5% or above is diabetes. A1C reflects average blood glucose over about the past three months, with the most recent 30 days weighing most.
How is A1C used in life underwriting?
As one input to the diabetes assessment, read with the history: when it rose, what treatment followed and whether it came down. On the fictional sample case the five readings from 6.1% to a 7.8% peak and 6.6% today were charted with their pages, and the medical director rated the trend.
Can one lab test be wrong?
Yes, within limits. The NIDDK says a 6.8% result could read anywhere from 6.4% to 7.2% on a repeat test of the same blood sample, and some conditions, such as iron-deficiency anaemia, can make A1C falsely high. That is why a single reading should be read beside the others and beside the rest of the chart.