The fraud KPIs a bank's fraud operations should report are the ones that show outcomes: gross and net fraud loss by channel, the recovery rate, time from a complete case file to a decision, how many cases are past their clocks, how much fraud was found only after the money had gone, and which control gaps produced the most loss. Alert counts, cases closed and hours worked are activity; they belong on the team's dashboard, not on the board's. The difficulty is that public fraud data are thin and inconsistent, so a bank's own case records are the only reliable source, and only if every loss, recovery and decision is booked on the case it belongs to. Botminds' Fraud Case Management books each close with its general ledger entries and reason codes, so the quarter's figures are the closed cases added up.
The figures about the product below are sample data from a fictional bank, Corvane National Bank, and its invented customers; targets are design goals. The wage arithmetic is ours and is labelled where it appears.
Fraud KPIs worth reporting, how to count each, and where it comes from
| KPI | Definition | Counted from | Sample bank, Q3 2026 |
|---|---|---|---|
| Gross fraud loss, by channel | Sum of loss lines on cases closed as fraud in the period | Loss lines on closed cases | $4,820,400 on 6,910 cases |
| Recovery rate | Recovered ÷ gross loss, by channel | Recall, return and claim records on the case | 41.2%; wire 47%, ACH 56%, P2P 10% |
| Net fraud loss | Gross loss − recovered; equals the posted charge-offs | General ledger entries made on closes | $2,834,400 |
| Time to decision | Median and slowest tenth, complete file to approved decision | Case timestamps | Median 38 minutes; target same day |
| Clock adherence | Share of open cases past a clock, and the age of the oldest | Case clocks | 23 of 1,146 open cases past due |
| Referral timeliness | Days from confirmed fraud to referral, against the bank’s own limit | Referral timestamps | Limit: 5 business days |
| Found after the loss | Share of confirmed cases first detected after money left | Detection source and timestamps | Count from your own cases |
| Loss by control gap | Gross loss on cases tied to each named rule gap | Rule-gap references on cases | RG-114: 14 cases, $212,400 in a month |
What are the key fraud KPIs?
Eight cover what a board and a chief fraud officer need: gross loss by channel, recovery rate, net loss, time to decision, clock adherence, referral timeliness, the share found only after the loss, and loss tied to each control gap. Each is in the table above with its definition. Together they answer the three questions a board asks of a fraud program: how much did we lose, are we getting faster and keeping our promises, and what is the program learning.
Three of the eight can be counted only if cases are recorded in a particular way. Net loss equals charge-offs only if every close posts its general ledger entries on the case. Loss by control gap exists only if investigators name the failed control and the case carries the reference. Found-after-loss needs the detection source and the time money left on every case. A KPI program starts with the case record, not with the dashboard.
Outputs or outcomes: why alert counts mislead
Alert counts, cases opened and cases closed are outputs: they measure how busy the team was, not whether fewer customers lost money. The Government Accountability Office's framework for managing fraud risk in federal programs says it plainly, and its reasoning carries over to banks.
"Measure outcomes, in addition to outputs, of fraud risk management activities."
GAO, A Framework for Managing Fraud Risks in Federal Programs, GAO-15-593SP
GAO also explains why programs drift towards outputs: managers "are more likely to measure performance against outputs rather than outcomes, because outputs typically correspond to activities under managers’ direct control". The same pull operates in a fraud operations team. Alert volume is easy to count and rises when the engines are tuned noisily. Net loss and found-after-loss are harder to count and are what the program exists to move.
The alert-to-case ratio is the one output worth watching, because it shows the cost the engines impose on the team. At the sample bank, 42,180 alerts in one quarter became 6,910 cases, and 86 percent of alerts were closed as not fraud. That is one fictional bank's figure, not a benchmark, and it describes the engines' tuning, not the investigators' work.
How do you calculate fraud loss rate and recovery rate?
Recovery rate is recovered dollars divided by gross loss on cases closed as fraud in the period. A fraud loss rate puts net loss over a measure of exposure, such as the value of payments in the channel; pick one denominator, write it down and keep it, because a rate that changes its denominator cannot be trended. Both are simple arithmetic; the hard part is making sure every dollar is on a case.
What one closed fraud case cost the bank
Gross loss
$48,600 + $9,800 + $2,800 = $61,200
The wire, the ACH debit and the counterfeit deposit on the sample case.
Loss lines on the case
Recovered
$29,100 + $9,800 = $38,900
The wire recall and the ACH return; 64% of the loss.
Payments hub records
Handling, by hand
≈ 9 h × $38.99 ≈ $350
The product team’s hour estimate times the median hourly wage of the parent occupation group; unloaded, our arithmetic.
Estimate
The arithmetic makes one point clearly: on a case of this size the loss dwarfs the handling cost, so a fraud program's economics are mostly about recovery speed and prevention, not investigator hours; the same arithmetic on the estimated 1.7 hours with agents gives about $66. Handling cost matters at volume and on the many small cases where the loss is low; it matters most because hours spent fetching evidence are hours not spent on recalls while the money can still be stopped.
Recovery rate by channel in one sample quarter
What is time to decision in fraud, and when should the clock start?
Time to decision is the time from a complete case file to an approved decision, reported as a median and as the slowest tenth. Starting the clock at the complete file isolates the judgment-and-approval step; time spent waiting for evidence shows up separately in clock adherence. At the sample bank the third-quarter median was 38 minutes, against a design target of the same day.
Report the legal clocks separately from the bank's own. For a consumer's notice of an unauthorized electronic transfer, Regulation E requires a determination within 10 business days, or 45 days with a provisional credit, so the share of consumer claims decided inside 10 business days is a compliance measure as well as a service one. The SAR filing deadline of 30 days from initial detection belongs to the BSA team, but the fraud team controls how much of it is used up before the referral arrives.
Clock adherence and backlog age
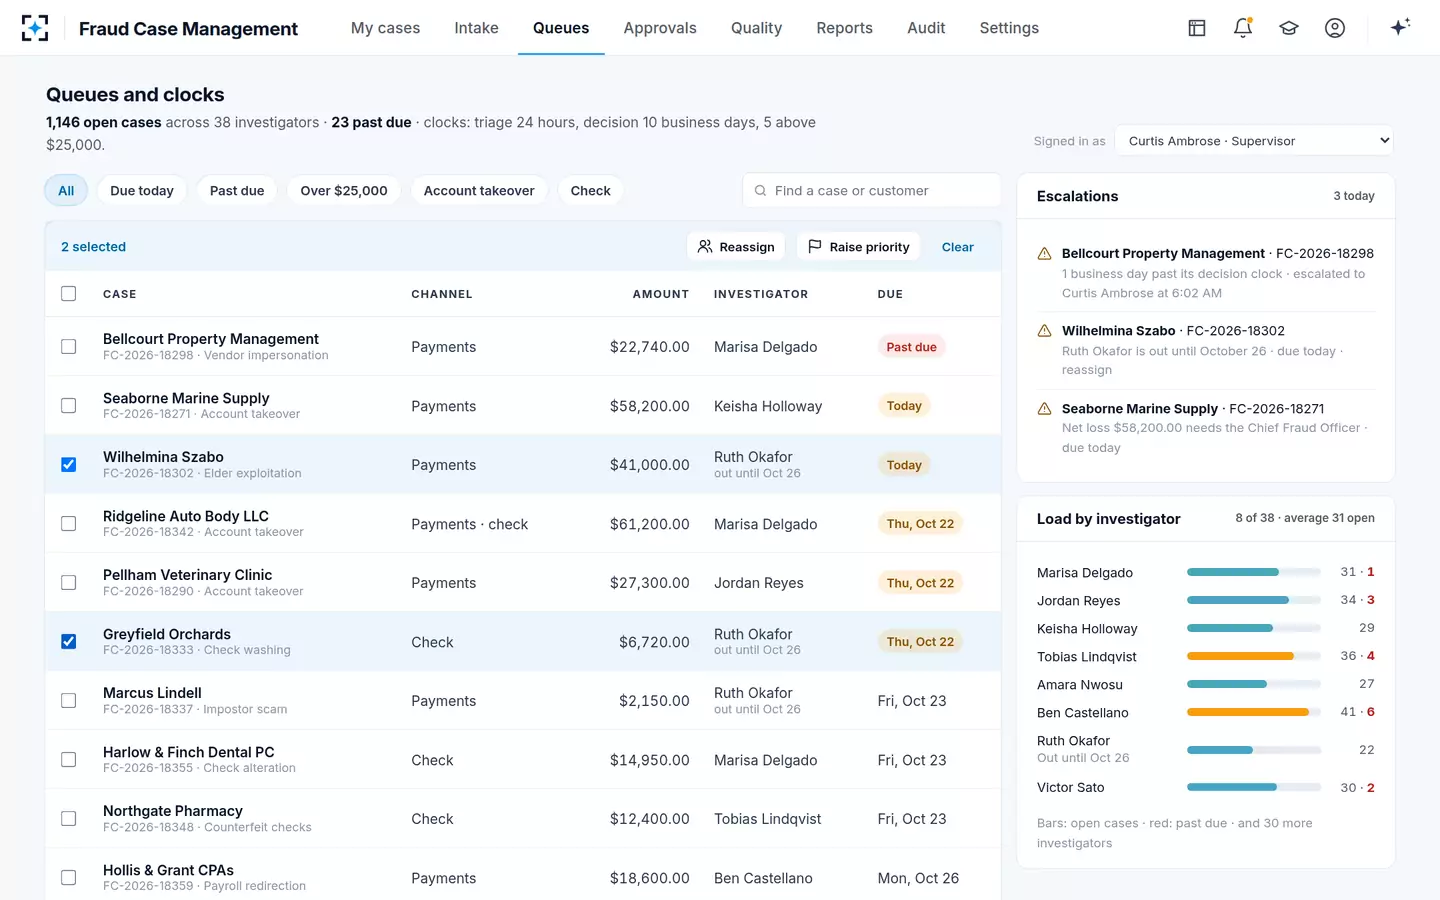
Count how many open cases are past each clock, and how old the oldest is. A past-due count alone hides a few very old cases; an average age hides them too. The sample bank's queue shows 23 of 1,146 open cases past due, about 2 percent, and three escalations on the morning shown, one of them a $58,200 net loss waiting for the Chief Fraud Officer because it is above the supervisor's limit.
Clock adherence, read straight from the queue
Referral timeliness: the fraud team's share of the SAR clock
Measure the days from confirmed fraud to the referral reaching the BSA team, and the share of referrals inside the bank's own limit. The SAR deadline runs from the bank's initial detection of facts that may justify a report, not from the day the fraud team finishes, so a slow fraud case quietly spends the BSA team's time. The sample bank sets its referral limit at five business days after fraud is confirmed, and the clock agent escalates a breach like any other.
Report the measure without the SAR outcome. Whether a referral became a filing is confidential and belongs to the BSA team; the fraud KPI is only about the hand-off. On the sample bank, the fraud case and its reports carry the referral's reference and nothing more, which keeps the KPI countable without exposing what the BSA officer decided. What the BSA side does with a referral is set out in AML investigation steps.
Found before or after the money left
The share of confirmed fraud first detected only after the money was gone is the most direct outcome measure a fraud program has, and most banks do not report it. It needs two facts on every case: how the fraud was first detected, and when the money left. The Federal Reserve Banks' 2026 survey of financial institution risk officers gives one public reading for one fraud type.
One survey's view of how late fraud is found
51%
of surveyed institutions identified money-mule activity only after losses
403
responses to the survey
±6%
sampling margin of error at 95% confidence
A bank can produce its own version for every fraud type from its cases. On the sample case at Ridgeline Auto Body, the wire left at 7:21 a.m. and the alerts came the same morning, yet $19,500 of the wire has not come back; the counterfeit check was found only when it came back unpaid two days later. Both are found-after-loss in the sense that matters, and the measure should count them.
What is a good fraud detection rate?
There is no public benchmark a bank can rely on. The federal banking agencies said in their 2025 request for information on payments fraud that the industry's fraud data are gathered piecemeal, without common definitions or a regular cadence, and no regulator or peer-reviewed study publishes a detection rate for bank fraud programs. Rates quoted online usually trace to vendors and are not comparable from one bank to the next.
Detection rate is also the engine's measure, not the case team's. What the case team can supply is the labels that make it measurable: every case closed as confirmed fraud or not fraud, with the alerts that started it. From those, the bank can compute its own detection and false-alert rates by engine and rule, and see them change when a rule changes. The measures for the proposals the case system itself makes are set out in measuring fraud investigation software.
How do you measure investigator productivity without rewarding speed?
Pair every speed measure with a quality measure, and never report one alone. Cases closed per week rewards closing; time to decision rewards signing; both are worse than useless if the closes are wrong. The sample bank pairs time to decision with three quality signals: the share of memos the quality agent challenged before approval, the findings from a 6 percent weekly sample of closed cases, and overrides recorded with reason codes.
Measure the team rather than the person where you can. Load by investigator is a management tool: at the sample bank, open cases per investigator ranged from 22 to 41 among the eight shown, and the past-due counts clustered with the heaviest loads. That is a staffing signal, not a performance verdict.
What fraud metrics should the board see?
Five, each with a trend and a short reason: net loss and recovery rate by channel; found-after-loss; clock adherence on legal clocks; the top control gaps by loss, with their status; and quality findings from the closed-case sample. Leave alert counts, hours and per-investigator figures in the operating report. Each board figure should be the closed cases added up, so that a director's question about any number can be answered with the cases behind it.
A board-level view built from closed cases
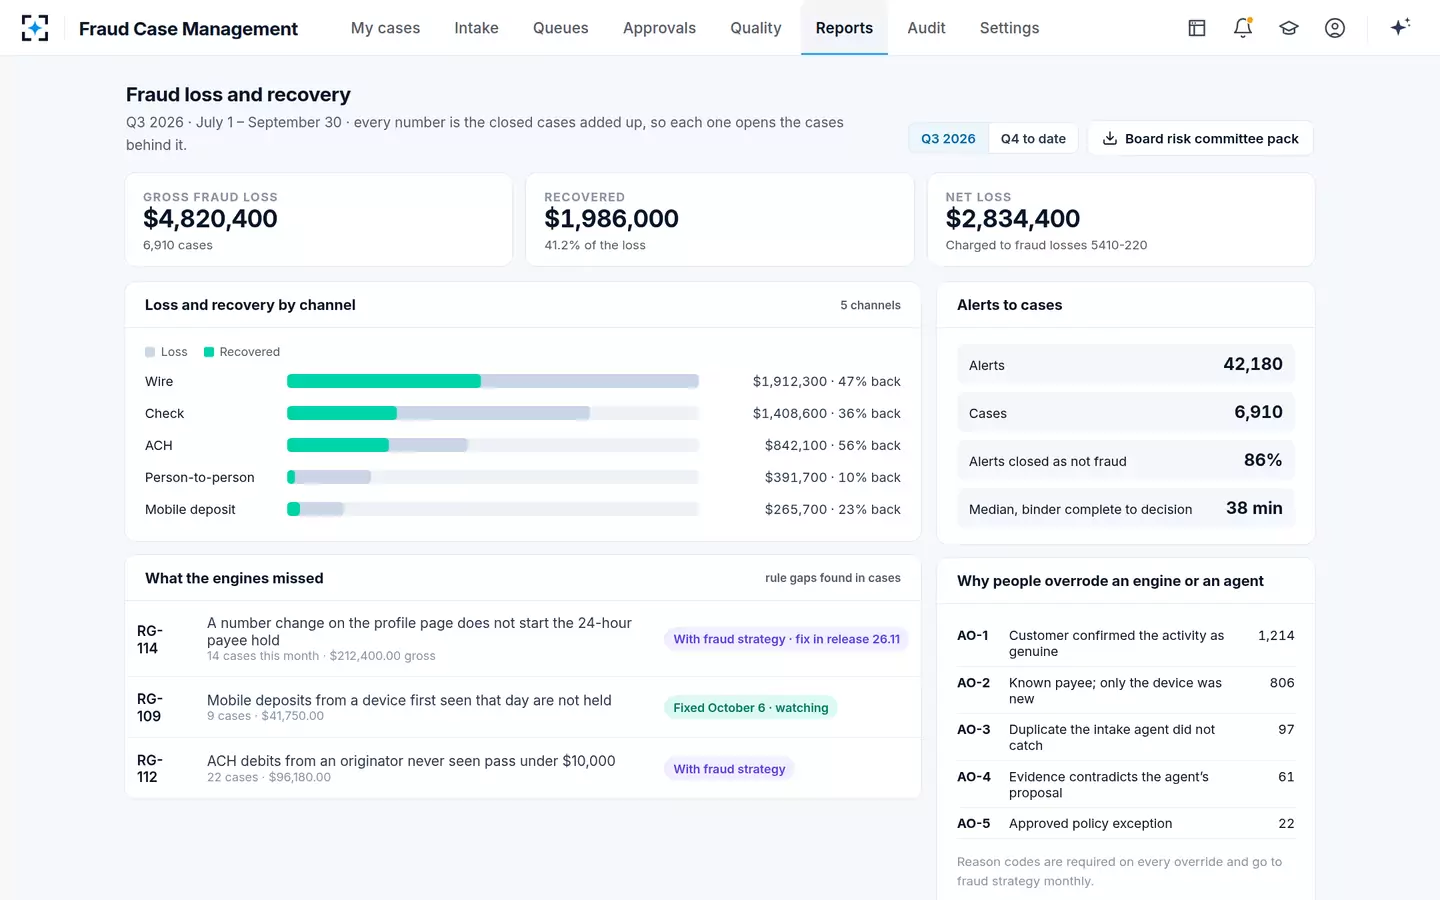
The control-gap figure is the one most boards never see and most need. On the sample bank, a single gap, a payee hold that did not start when a phone number was changed on one page, was tied to 14 cases and $212,400 of gross loss in a month, and its fix was scheduled in a named release. That is a fraud KPI with an owner and a date. How those gaps are found inside a case is shown in how to write a fraud investigation report.
Questions people ask
How do you measure fraud operations performance?
On outcomes first: net loss, recovery rate, found-after-loss and loss by control gap. Then on service and compliance: time to decision and the share of cases inside their legal and internal clocks. Activity counts such as alerts worked belong on the team's dashboard, not the board's.
How do you calculate fraud recovery rate?
Divide the dollars recovered by gross fraud loss on cases closed as fraud in the period, by channel. At the fictional sample bank that was $1,986,000 of $4,820,400, or 41.2 percent, ranging from 56 percent on ACH to 10 percent on person-to-person payments.
Should alert volume be a fraud KPI?
Only as an operating measure of the engines' cost to the team. GAO's fraud risk framework warns that managers tend to measure outputs because they are under their control; alert volume is an output and can rise while losses fall, or the reverse.
How often should fraud KPIs be reported?
Operating measures such as clock adherence daily or weekly; loss, recovery and control gaps monthly to management and quarterly to the board. Recovery figures move after the quarter closes, since a wire recall can stay open for months, so restate prior quarters when late recoveries arrive.
What data do you need for fraud KPIs?
Every loss, recovery and general ledger entry on the case it belongs to; the detection source and the time money left; each clock with the event that started it; and a reason code on every override and a reference on every control gap. Without those on the case record, the KPIs are rebuilt by hand each quarter.