To calculate concentration risk you divide the bank's exposure to one pool of loans by tier 1 capital plus the allowance for credit losses, and compare the answer with the limit the board set for that pool. The division is trivial; getting the two numbers right is not, and in practice the figure in a board report is wrong for one of four reasons — the wrong denominator, drawn balances where the limit was written on commitments, a borrower group counted as separate borrowers, or a number that was true at a quarter end and has not been true since. None of the four needs a model to fix. Botminds' Credit Concentration Risk Monitoring does the same arithmetic against every one of a bank's board limits each time a loan funds, which removes the fourth mistake and makes the other three visible.
The worked example runs on fictional sample data inside the product: Ellsmere Bank & Trust, an $18.4B commercial bank, its borrowers and its people. The rules and thresholds are from the agencies' own publications, linked where they appear.
One pool, one morning: the four numbers the calculation produces
$1.924B
tier 1 capital plus the allowance for credit losses at 30 September — the denominator every limit uses
10%
the board limit on truck transportation, cut from 12% in April
$192.4M
what that limit allows in dollars — the product of the first two numbers
$196.6M
committed to the pool after a $12.0M wire at 10:14 — 10.22% of capital, $4.2M over
How to calculate concentration risk: the formula, and the four ways it goes wrong
Every concentration measure a US bank examiner will ask about is the same fraction, expressed as a percentage of capital. The OCC's Director's Reference Guide puts the expectation to directors as a question they should be asking management: "Are limits expressed as a percentage of capital, as appropriate?" (OCC, Director's Reference Guide to Board Reports and Information). A limit in dollars alone drifts every time capital moves; a limit in percent re-prices itself each quarter.
Use of a limit = exposure to the pool ÷ (tier 1 capital + the allowance for credit losses on loans and leases)
The whole calculation, for every pool and every limit
Tier 1 capital is read from Call Report Schedule RC-R and the allowance on loans and leases from Schedule RC, so the denominator is a number the bank already files. Everything difficult is in the numerator and in the date. Each of the four failures below has a different owner, and three of the four are policy decisions that were never written down.
The four reasons a concentration percentage is wrong, in the order they are worth checking
- The denominator is not tier 1 capital plus the allowance.
Book equity, total assets or last quarter’s capital will all produce a plausible-looking percentage, and every limit in the schedule inherits the error at once. For concentrations in securities and other non-credit assets the base is tier 1 capital alone, without the allowance.
- The numerator is drawn balances where the limit was written on commitments.
The undrawn part of a committed line is the part that arrives in stress. Measuring without it reports the slower-moving half of the exposure and reports it late.
- Related borrowers are counted as separate borrowers.
A guarantor, a common owner or a single source of lease payments makes one obligor group out of several files. Unaggregated, the exposure is spread across pools that each look comfortable.
- The figure was true at a quarter end.
Between the as-of date and the meeting, the portfolio funds, draws, amends and pays down. A pool growing at 20% a year adds about 1.5% of itself a month, so a pool at 95% of its limit crosses it in about three and a half months — inside a single reporting cycle.
The denominator: tier 1 capital plus the allowance, and where to read it
For credit-related assets the FDIC states the convention plainly: "As a general rule, asset concentrations for credit-related assets should be measured as a percentage of Tier 1 Capital (T1C) plus the portion of the allowance for credit losses (ACL) attributable to loans and leases" (FDIC, RMS Manual, section 16.1; footnote markers omitted). Two consequences follow that banks often miss. Concentrations in securities and other non-credit assets are measured against tier 1 capital alone, without the allowance, so a bank running one schedule for everything is using the wrong base for part of it. And when capital has fallen far enough to stop being a useful yardstick, examiners switch to a percentage of total assets, generally two percent.
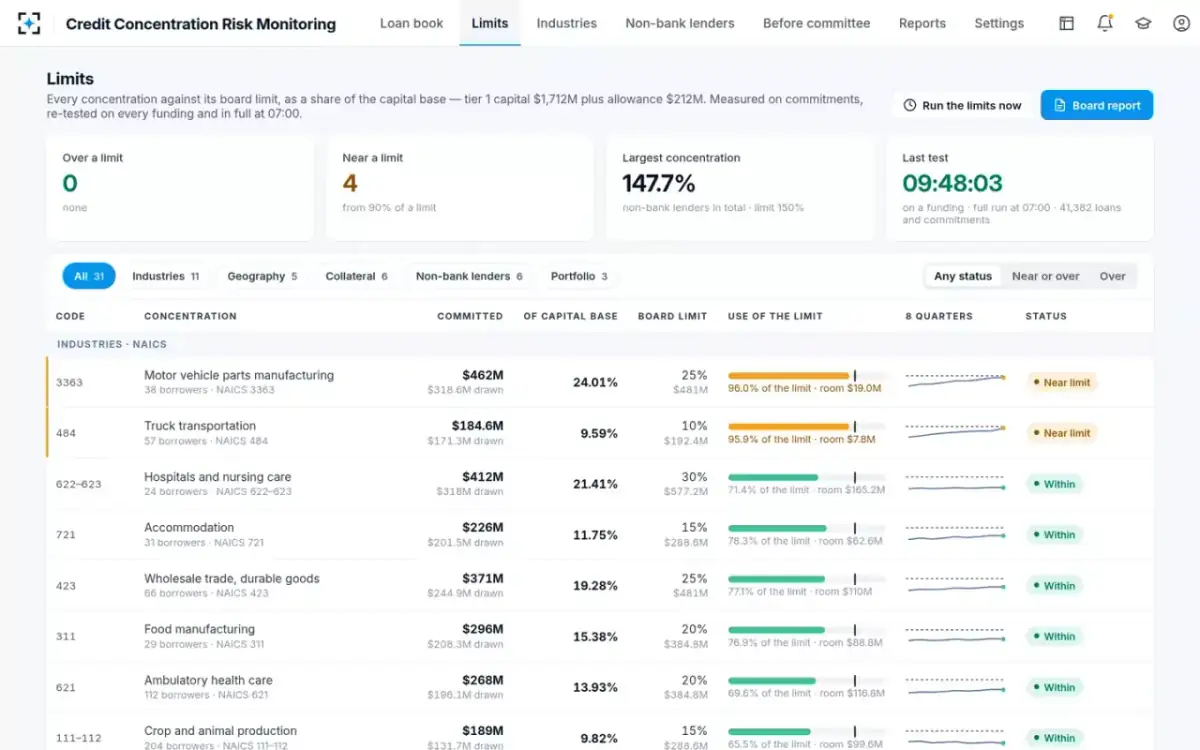
At the sample bank the base is $1,924M: tier 1 capital of $1,712M plus a $212M allowance, taken from the Call Report draft at 30 September and shown on the screen beside every limit, so that nobody has to ask which quarter a percentage was computed against. That matters more than it sounds. A bank whose capital grew 6% over a year, and whose limit schedule is carried in dollars, has loosened every limit by 6% without a board vote.
There is a second denominator banks sometimes use, and it is worth being explicit about. Tennessee Commerce Bank, which failed in 2012, used both: "TCB defined its industry concentrations as an exposure to any industry sector of more than 25 percent of Tier 1 Capital and 7 percent of the loan portfolio" (FDIC OIG, report AUD-12-014). A share-of-portfolio test answers a different question — how diversified the lending is — and it has the unhelpful property of improving when the portfolio grows. If your policy carries both, say which one the limit binds on.
Thirty-one limits, each against the same capital base, with the room left on every one
Do you measure concentration on commitments or drawn balances?
The OCC leaves the basis to the bank and tells it how to choose: the exposure "may include the committed or outstanding amount. This depends on the characteristics of the concentration, such as the likelihood the bank will fund undisbursed committed portions of the obligations and its legal obligation to do so." The test is behavioural, not accounting — how much of the undrawn line will actually be drawn, and whether the bank can refuse.
Which basis fits which pool, and what each one gets wrong
Measured on outstanding balances: The OCC gives this as the example where outstanding amounts are useful: open-to-buy is a marketing number, not an obligation the bank must fund.
Measured on commitments, drawn plus undrawn: Overstates the pool substantially, because almost none of the line is contractually committed.
Measured on outstanding balances: Understates the risk: these are drawn on a schedule the borrower controls, and the OCC names HELOCs as a case where commitments capture it better.
Measured on commitments, drawn plus undrawn: The right basis. The bank has a legal obligation to fund, and the draw comes when the borrower needs it most.
Measured on outstanding balances: Hides the part that arrives in stress. Nationally, 42.9% of bank commitments to non-bank lenders were undrawn in the third quarter of 2025, the FDIC reports.
Measured on commitments, drawn plus undrawn: The right basis, and the one the sample bank uses: a line can go from quiet to fully drawn inside a week.
Measured on outstanding balances: Materially the same answer once funded, which is why mixed portfolios can look consistent until a revolver is added.
Measured on commitments, drawn plus undrawn: Materially the same answer, plus any undrawn delayed-draw tranche.
Measured on outstanding balances: What examiners use: "Examiners should identify only the funded exposures" in the listing columns.
Measured on commitments, drawn plus undrawn: Not used for the listing calculation; unfunded amounts "should be commented on in the narrative analysis" instead.
The last row is the one that causes arguments in examinations. The examiner's listing convention is a rule for filling in a table in the report of examination, and a bank that imports it into its own limit policy has chosen, without meaning to, the measure that moves last. The sample bank measures on commitments by default, with drawn balances and a mixed basis — commitments, with consumer pools on drawn — available as settings.
What is an obligor group, and when related exposure joins the pool
An obligor group is every borrower whose repayment depends on the same people or the same cash. The OCC's examples of transactions that may perform similarly start with exposures extended to "any one counterparty, borrower, or group of related counterparties or borrowers" and exposures "dependent on the same source of repayment (including guarantors)". So a guarantee counts. A common owner counts. A single source of lease payments counts, even where the borrowers are unrelated on paper.
In the worked example the aggregator finds that Dale Redfield, the owner of the trucking borrower, personally guarantees a $3.1M line to Redfield Logistics LLC, a freight broker. The $3.1M is reported with the obligor group, because the repayment depends on the same person, but it is not added to the truck transportation limit, because freight broking is a different industry with a different sensitivity. Those two decisions — same group, different pool — are the ordinary case, and a system that can only do one of them will either overstate the industry or lose the relationship.
One distinction to keep straight. A concentration limit is a board's own policy; the legal lending limit is law. Under 12 CFR 32.3, "A national bank's or savings association's total outstanding loans and extensions of credit to one borrower may not exceed 15 percent of the bank's or savings association's capital and surplus, plus an additional 10 percent … if the amount that exceeds the … 15 percent general limit is fully secured by readily marketable collateral" (12 CFR 32.3). Different denominator — capital and surplus, not tier 1 plus the allowance — different subject, one borrower rather than a pool, and a different consequence, since breaching it is a violation rather than a governance matter. Banks that run the two tests off the same aggregation get both right; banks that run only the legal one have no view of the pool at all.
Guarantees, participations and contingent exposure: the lines people forget
Four categories go missing from hand-built concentration reports with some regularity, and all four are on the OCC's list of obligations. Letters of credit and acceptances are contingent until drawn and count at face. Participations sold reduce exposure only if sold without recourse; a participation sold with recourse, or with a repurchase agreement attached, stays in the pool. Loans bought from a single seller concentrate on the seller's underwriting as well as on the borrowers' industry, which is why the booklet lists loans purchased from a single source as a pool of their own. And net derivative exposure to a counterparty aggregates with lending to that counterparty — a point that matters most for the financial-institution pools, where the same name can appear as a loan, a federal funds sale, an investment and a swap.
Securitisation deserves a sentence of its own, because it is the one mitigation people assume works arithmetically. It does not reduce the concentration unless the reference obligations leave the balance sheet and stop being a direct, indirect or contingent exposure. Retained tranches stay in the pool; so does any credit risk kept through representations and warranties. Version 3.0 of the OCC booklet is the first to say so, and its new securitisation rule is read in full in the handbook guide.
A worked example: one $12.0M equipment loan, four limits
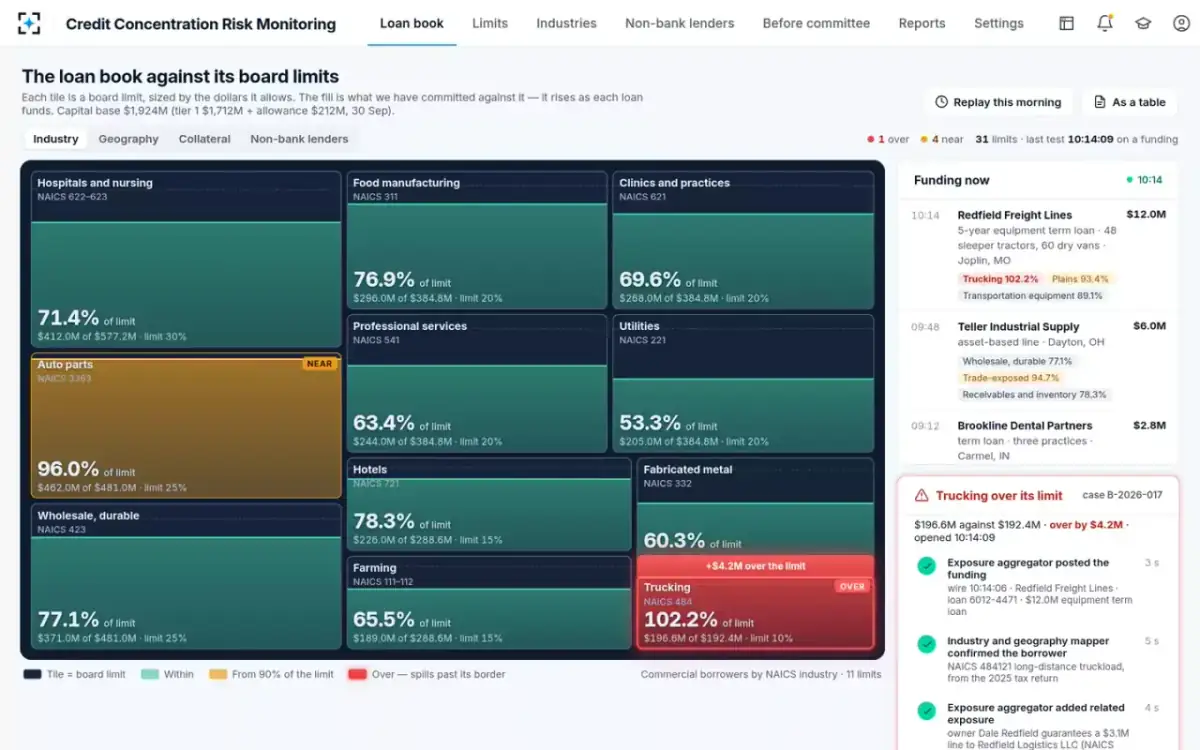
Truck transportation stood at $171.8M — 8.93% of the capital base — in the third quarter board report. By the morning of 12 October it was $184.6M, 95.9% of its limit, through three movements nobody had treated as a portfolio decision. At 10:14, loan operations released the wire on a $12.0M five-year equipment loan to Redfield Freight Lines: 48 sleeper tractors and 60 dry vans, Joplin, Missouri.
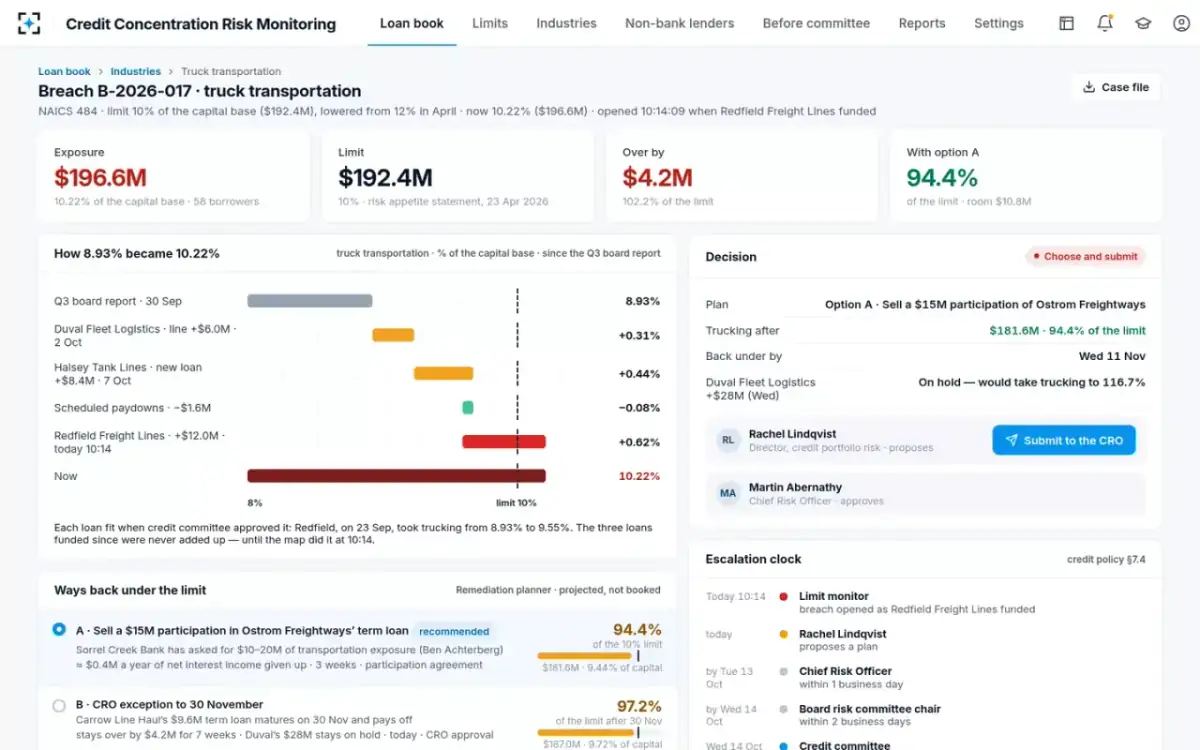
How 8.93% of capital became 10.22%, in four movements and one wire
| What happened | Amount | Effect on the pool | Running total |
|---|---|---|---|
| Third quarter board report, 30 September | $171.8M | the figure the committee and the board were working from | 8.93% |
| Duval Fleet Logistics drew a line increase, 2 October | +$6.0M | +0.31% of capital | 9.24% |
| Halsey Tank Lines funded a new loan, 7 October | +$8.4M | +0.44% | 9.68% |
| Scheduled paydowns across the pool | −$1.6M | −0.08% | 9.59% |
| Redfield Freight Lines funded, 12 October 10:14 | +$12.0M | +0.62% | 10.22% — over a 10% limit by $4.2M |
Four limits moved on that one wire, and only one of them is the industry limit everybody watches. The geography limit for the Plains region went to 93.4%, because Joplin is out of footprint. The collateral limit for transportation equipment went to 89.1%. The obligor group gained $3.1M that sits outside the trucking pool. A calculation run on the industry alone would have reported one number and missed three.
The arithmetic running at the moment of the wire, not at the end of the quarter
The 25%, 100% and 300% thresholds, and what each one triggers
Once the calculation is right, the answer gets compared against two different things: the bank's own limit, and the thresholds at which a supervisor starts writing. The second set is published, and it is narrower than most summaries suggest — the threshold depends on how the pool is defined, not only on its size. These are the FDIC's report-of-examination lines for any pool; the 100% and 300% screens of the 2006 commercial real estate guidance use the same capital base but test construction lending and total CRE, and are worked through separately.
What each supervisory threshold triggers, and which pools it applies to
| Threshold | How the pool is defined | What it triggers |
|---|---|---|
| 25% or more of tier 1 capital plus the ACL on loans and leases | Individual borrower; a small, interrelated group of individuals; a single repayment source; or an individual project | Listed on the Concentrations page of the report of examination, and a written analysis of the bank’s risk management for that concentration |
| 100% or more of the same base | Industry; product line; type of collateral; or short-term obligations of one financial institution or affiliated group | Listed on the Concentrations page |
| 300% or more of the same base | Industry, product line or collateral type | Listed, and a written analysis of the bank’s risk management for that concentration |
| 10% or more of total assets, by a single funding type | Funding rather than assets; plus any uninsured deposit concentration at 50% or more of total deposits | Listed on the same page — the Concentrations page covers both sides of the balance sheet |
| Below any threshold | Any pool where elevated risk is evident | May still be listed and analysed at the examiner-in-charge’s discretion |
These are thresholds for supervisory attention, not ceilings, and the distinction is set out at greater length in the guide to what a concentration is. The number that actually constrains a bank is its own, and how to set one that holds is a separate piece of work.
How is the Herfindahl–Hirschman index used for loan concentration?
The Herfindahl–Hirschman index is the sum of the squared percentage shares of each segment in a portfolio. It runs from near zero for a perfectly spread book to 10,000 for a book with one borrower, and it has an intuitive reading: 10,000 divided by the index is roughly the number of equal-sized segments the portfolio behaves like. Banks use it to track diversification over time, and it is genuinely useful for that — a rising index says the book is getting narrower even when no single limit has moved.
Eleven industry pools at one bank: an index of 1,015, or about ten equal-sized bets
Two cautions before anyone puts it in a board report. The index is entirely a function of how the segments were drawn: the same book cut into eleven industries, into four sectors, or into sixty NAICS codes gives three different numbers, none of them wrong and none of them comparable. And no US banking agency publishes a threshold for it. The OCC booklet's own list of common credit risk benchmarks — special mention and classified percentages, net loss rates, nonaccrual rates, delinquency and roll rates, growth rates in commitments and utilisation, the risk rating distribution, weighted-average ratings, probability of default, loss given default and capital intensity — contains no diversification index at all. Treat it as a trend line beside the limits, never as a substitute for them.
Why the number you calculate at a quarter end is already the wrong number
The arithmetic above takes a minute. The problem is that it is usually performed once a quarter, on data pulled weeks after the quarter closed, and the portfolio does not wait. At the sample bank, the limits are re-tested across 41,382 loans and commitments each morning at 07:00, and again within seconds of any funding, booking, amendment or paydown that touches a limit. The gap between those two schedules is the whole difference between a report that describes the bank and a report that describes the bank as it was.
The same calculation, kept as a case rather than a cell in a spreadsheet
Doing the division is the easy half. Doing it on every limit, every time the portfolio moves, is the half that decides whether the answer is still true. To see the capital base, the limits and the cases on one book, start from Credit Concentration Risk Monitoring.
Questions people ask
What is 25 percent of tier 1 capital plus allowance?
It is the level at which the OCC says a concentration exists, and at which an examiner lists a single-borrower, single-repayment-source or single-project concentration on the report of examination. In dollars it is a quarter of the sum of tier 1 capital from Call Report Schedule RC-R and the allowance for credit losses on loans and leases from Schedule RC. At the sample bank, with a base of $1,924M, that is $481M. It is a reporting threshold, not a cap.
How do you count a guarantee in a concentration?
At the amount the bank could be called on for, in the pool the guarantee creates. Exposures "dependent on the same source of repayment (including guarantors)" are one of the OCC's examples of transactions that may perform similarly, so a guarantor who stands behind six borrowers has created a six-borrower pool whatever industries they are in. A guarantee received from outside a pool does not reduce the industry concentration; it adds a second pool around the guarantor.
Is the legal lending limit the same as a concentration limit?
No. The legal lending limit in 12 CFR 32 caps lending to one borrower at 15% of capital and surplus, plus a further 10% if the excess is fully secured by readily marketable collateral with a market value of at least 100% of that excess at all times. It is law, it applies to one borrower, and it uses capital and surplus as its base. A concentration limit is set by the board, applies to a pool, and is normally expressed against tier 1 capital plus the allowance. A bank can be well inside the legal limit on every name and still be far past a sensible concentration.
How do you measure concentration in a loan portfolio when one loan is in several pools?
You count it in each. The OCC is explicit that a single transaction may appear in more than one pool — an open-end revolving account can sit in a retail product pool and a geographic pool at once, and a project finance loan can sit in project finance, in the utilities industry and in a country pool. Pools are tests, not buckets, so the shares do not need to sum to 100%, and a report that forces them to has lost the point of the exercise.
Does the calculation change for a bank under $10 billion in assets?
The arithmetic does not. The reporting does: only institutions with $10 billion or more in total assets complete the five Call Report subcategories for lending to non-depository financial institutions, so a smaller bank reports that lending as one line. And where capital has fallen so low that it no longer distinguishes a concentration, examiners measure against total assets instead, generally at two percent.
How often should the calculation be run?
No rule fixes a frequency, which is why quarterly became the default. The useful test is whether the number in front of the board could have changed materially since it was computed: a pool growing at 20% a year adds about 1.5% a month, so a pool reported at 95% of its limit may already be at 97% six weeks later and over it before the next quarterly report is built. The sample bank re-tests every limit a movement touches within seconds and all 31 limits each morning.