Banks' exposure to private credit is now largely measurable, because banks report it: loans to nondepository financial institutions reached $1.32 trillion in the third quarter of 2025, 10.0% of all bank loans, and banks with $10 billion or more in assets split that total into five categories, one of which is lending to private equity funds. The difficulty is that the reported figure is the easy half — almost 43% of the sector's commitments are undrawn, the delinquency rate is currently a fraction of commercial and industrial lending, and neither fact tells a risk committee what its own limit should be. Botminds' Credit Concentration Risk Monitoring is where a bank keeps that limit and its sub-limits, measured on commitments, re-tested every time a facility funds or an amendment lands.
Every industry figure here is from the FDIC, the OCC, the Federal Reserve or the Basel Committee, linked where it appears. Figures naming a bank, a fund or a person are fictional sample data inside the product: Ellsmere Bank & Trust, an $18.4B commercial bank.
The four reported numbers a risk committee should have in front of it
$1.32T
of bank loans outstanding to nondepository financial institutions, third quarter 2025
21.9%
compound annual growth 2010 to 2024 — the fastest-growing loan segment on the Call Report
52.3%
of tier 1 capital plus the allowance, industry-wide, up from 4.1% in the first quarter of 2010
0.15%
past-due and nonaccrual rate on those loans, against 1.32% for commercial and industrial loans
How exposed are banks to private credit, in reported numbers
Three facts sit together, and they point in different directions. The sector is the fastest-growing loan segment on bank balance sheets since the financial crisis. It has, so far, performed better than the business lending it most resembles. And more than two-fifths of what banks have committed to it has not been drawn, which means the reported balance is not the exposure.
A caution about vocabulary before the numbers. "Private credit" is narrower than what the Call Report measures. The FDIC's reporting line covers every non-depository financial borrower — mortgage companies, finance companies, insurers, broker-dealers, securitisation vehicles and funds of several kinds. Private credit funds are a subset, and they do not have a line of their own: the five Call Report categories put a private debt fund wherever its book sends it, while the private-equity line captures capital call facilities. Anyone quoting a single "bank exposure to private credit" number is quoting something broader or something narrower.
For the narrower figure, the Federal Reserve has published an estimate built from supervisory data rather than the Call Report. Committed credit lines from the largest US banks to private debt funds and business development companies reached about $95 billion at the end of 2024, up roughly 145% in five years, with about $56 billion drawn. Those commitments are "about 7 percent of banks' regulatory capital on average", and the exposure is not spread evenly: "about sixty percent of these loan commitments is concentrated among five U.S. GSIBs" (Berrospide, Cai, Lewis-Hayre and Zikes, FEDS Notes, 23 May 2025).
Where the numbers come from: item 9.a and Memorandum 10
Every bank reports total loans to nondepository financial institutions on Schedule RC-C, Part I, item 9.a, together with unused commitments and past-due and nonaccrual amounts. Banks at $10 billion of assets or more split that total into five Memorandum items — mortgage credit intermediaries, business credit intermediaries, private equity funds, consumer credit intermediaries, and everything else — and report unfunded commitments for each. That is the whole public apparatus, and it has existed since the December 2024 filing.
It answers some questions and not others. It gives size, growth, composition, utilisation and performance, by bank and by asset-size cohort. It does not give the identity of the borrower, the collateral behind the facility, the advance rate, or what the fund at the other end has lent to. A risk committee that wants those has to get them from the facility's own documents, which is the work the Call Report category depends on in the first place.
The growth: $56 billion in 2010 to $1.32 trillion in 2025
The series begins in the first quarter of 2010, when the line was added to the Call Report after non-bank failures in the financial crisis. "NDFI loans outstanding rose from $56 billion in first quarter 2010 to $1.32 trillion in third quarter 2025," the FDIC reports. "NDFI lending as a share of bank lending also grew, from less than 1 percent of total loans to 10.0 percent, and now accounts for more than a third of lending to businesses not secured by real estate."
How fast, against everything else a bank lends to
| Measure | 2010 | Third quarter 2025 |
|---|---|---|
| Loans outstanding to non-depository financial institutions | $56 billion | $1.32 trillion |
| Share of total bank loans | under 1% | 10.0% |
| Share of tier 1 capital plus the allowance, all banks | 4.1% | 52.3% |
| Same ratio, banks over $100 billion in assets | 5.7% | 68.1% |
| Same ratio, banks under $10 billion in assets | about 1% | 6.3% |
| Compound annual growth 2010–2024 — and the next-fastest segment | — | 21.9% against 7.7% for multifamily commercial real estate |
The capital ratio in that table is the row to read twice, and also the row most likely to be misused. The FDIC states in a footnote that the ratio of NDFI lending to tier 1 capital and allowance "is not a supervisory designation but is described in this report for analytical purposes." It is a measure of how big the sector has become relative to the money that absorbs losses. It is not a threshold anybody has to stay under, and a board paper that presents it as one is inventing a rule.
Which banks hold most of the loans to nondepository financial institutions?
The largest ones, by a distance. Banks with more than $100 billion in assets held about 86% of industry loans to NDFIs in the third quarter of 2025, and ten of those institutions held about 71% of the total. For comparison, thirty banks had assets above $100 billion and they held 70% of all bank assets — so NDFI lending is concentrated even by the standards of a concentrated industry.
Composition differs with size, which matters to any bank benchmarking itself. At banks between $10 billion and $100 billion, almost 40% of NDFI lending is to mortgage credit intermediaries. Above $100 billion, the book is spread more evenly across private equity, business credit and mortgage credit. A mid-sized bank comparing its own mix with the industry average is comparing itself with a distribution dominated by institutions that lend differently.
Where the sector's lending sits: five categories at banks over $10 billion
Nearly 43% is undrawn — the number a limit on balances misses
This is the single most important line in the data for anyone writing a limit. "In third quarter 2025, unfunded commitments to NDFIs were $987 billion, or 42.9 percent of total commitments to NDFIs. These loans tend to be revolving credit lines that could be drawn down in times of stress and could represent a potential stress on bank liquidity."
$1.32 trillion drawn, $987 billion not — and the second number behaves differently
Total bank commitments to non-depository financial institutions, third quarter 2025
- Outstanding $1.32T · 57.1% · 57.1%
- Unfunded $987B · 42.9% · 42.9%
Two consequences follow for a limit. A limit set on outstanding balances will report a bank as comfortable right up to the point where its borrowers draw, and they draw together, because the thing that makes one fund need cash tends to be the thing that makes the others need it. And a liquidity plan built on the funded figure is built on the smaller of two numbers. The Federal Reserve's work puts the utilisation rate on bank lines to private debt funds and BDCs at about 56% on revolvers, against about 19% for revolving lines to non-financial corporations — a reminder that utilisation is not a constant a bank can assume away.
Are private credit loans riskier than C&I loans? What the past-due rates say
On the reported evidence, not yet, and by a wide margin. In the third quarter of 2025 the past-due and nonaccrual rate on bank loans to NDFIs was 0.15%, against 1.32% on commercial and industrial loans — business lending not secured by real estate in both cases. The pattern holds across bank sizes: 0.49% at banks under $10 billion, 0.31% between $10 billion and $100 billion, and 0.12% above $100 billion.
The FDIC's explanation is structural rather than flattering. Most bank facilities to NDFIs are "highly collateralized with conservative advance rates against the collateral pledged", and many NDFIs have long lock-up periods for investor redemptions or other long-dated liabilities, which eases liquidity pressure. In other words, the low delinquency rate is a property of how these facilities are structured — the advance rate, the borrowing base, the eligibility tests — and not of the borrowers being stronger than other businesses.
That is precisely why the rate deserves to be read as a reason to check structure rather than as a reason to relax. The same analysis lists the channels through which losses could still arrive: credit risk on the loans themselves, losses on the assets pledged as collateral, and liquidity pressure if a sector of NDFIs draws its lines at once. It also notes that newer NDFIs "may not have experienced a full credit cycle", and that for loans the NDFI originated, "the credit decisions, credit administration, and collateral valuations fall outside the direct control of banks."
So far, these risks have not materialized into high delinquency rates or large losses to banks.
FDIC, Banking Issues in Focus No. 1, February 2026
What supervisors said in 2025 and 2026
The OCC's Spring 2026 Semiannual Risk Perspective put the same tension in supervisory terms. Bank exposures to private credit funds were performing as agreed, it reported, but credit quality in some vintages, borrower types and sectors of the private credit markets showed signs of weakening, and debt restructurings and payment-in-kind terms could be hiding deterioration inside the funds' own portfolios. With lending to the funds growing and concentrations rising at some banks, the agency called closer monitoring of borrower performance and refinancing risk increasingly important (OCC, Semiannual Risk Perspective, Spring 2026). The risk a bank carries is at one remove — not the fund's credit, but what the fund's credit does to the collateral behind the bank's facility.
Internationally the Basel Committee reached the same place by a different route, publishing a horizon-scanning report on banks' links to non-bank financial intermediaries in July 2025: "Banks are connected to NBFIs through a wide range of direct and indirect activities and services" (Basel Committee, July 2025). Its emphasis is on data — on whether supervisors and banks can see the linkages at all — which is the same problem a bank has internally when lending, derivative exposure and investments to the same financial names sit in three different systems.
What a private credit sub-limit should be set against
Three design decisions decide whether the limit will work, and all three can be read off the data above.
Three decisions in a non-bank lending limit, and what the reported data implies
| The decision | What the data implies | What to write down |
|---|---|---|
| Commitments or drawn balances | Nearly 43% of the sector’s commitments are undrawn, and utilisation on lines to private debt vehicles runs far above the corporate average. | Commitments, for this pool, with the drawdown assumption stated and the liquidity plan built on the committed figure. |
| One limit, or a limit with sub-limits | The five Call Report categories behave differently: mortgage credit dominates mid-sized banks, private equity capital call facilities dominate the largest. | A limit on all non-bank lending plus a sub-limit per category, so a reclassification moves a specific number rather than hiding inside a total. |
| Where the category comes from | The category depends on more than 50% of the borrower’s assets or lending activities, which only its own documents establish. | The document order that decides, who confirms a category, and that an amendment or a new borrowing base re-opens the question. |
One bank's non-bank lending limit and its five sub-limits, measured on commitments

What to put in front of the board this quarter
Four numbers, and one of them is uncomfortable. First, the bank's own exposure as a percentage of tier 1 capital plus the allowance, stated on the same basis as its limit and dated. Second, the undrawn share, because that is the gap between what is reported and what is committed. Third, the split across the five categories against their sub-limits, with any facility whose category is under review named. Fourth, the industry figures above, labelled as industry figures, so that nobody treats 52.3% as a benchmark they are inside.
The quarter’s position, breaches, near-limit list and trend, with the figures cited
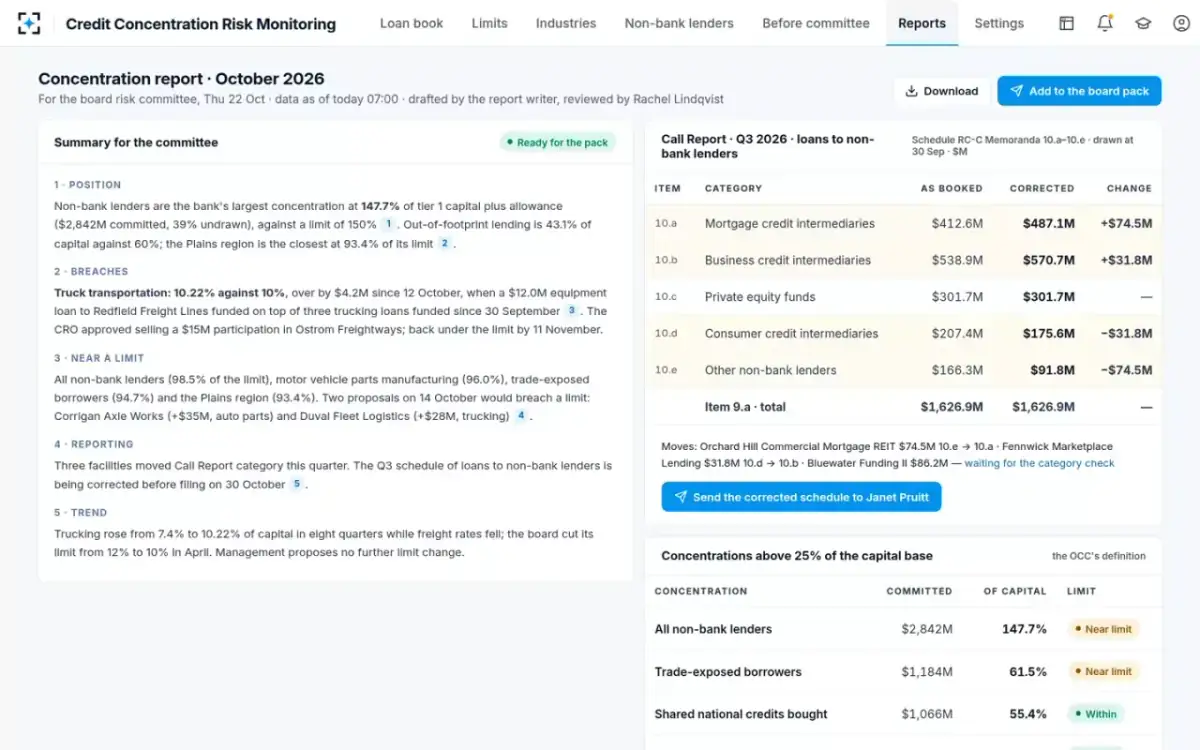
The uncomfortable one is the second, read as a trend. A shrinking undrawn share — rising utilisation on revolving lines to funds — can be an early sign that borrowers' other funding has become harder or dearer to get, and it shows in data the bank already holds, often before anything shows in a delinquency rate. Where limits are tested on commitments, utilisation does not move the limit — which makes it exactly the kind of number that goes unreported unless someone asks for it.
The honest summary of the reported evidence is that this is a large, fast-growing and currently well-performing exposure whose risk is concentrated in structure and in liquidity rather than in delinquency. Setting the limit that governs it is the decision that matters. To see the register, the sub-limits and the facility checks on one book, start from Credit Concentration Risk Monitoring.
Questions people ask
How big is bank lending to nondepository financial institutions?
$1.32 trillion outstanding in the third quarter of 2025, 10.0% of all bank loans, with a further $987 billion committed and undrawn. It has grown from $56 billion in the first quarter of 2010, a compound annual rate of 21.9% through 2024 — the fastest-growing segment reported on the Call Report, against 7.7% for the next fastest, multifamily commercial real estate.
Does the Call Report show a bank's exposure to private credit specifically?
Not as one line. Memorandum item 10.c covers loans to private equity funds, most of which are capital call facilities secured by investors' commitments, and that is a different thing from lending to a private credit fund. A private debt fund is reported in whichever category more than half of its book sends it to — mortgage, business or consumer credit intermediaries — or in the residual category if none applies. Reading "private credit exposure" off a single Call Report line will give you the wrong number in either direction.
Is 52.3% of tier 1 capital plus allowance a supervisory limit?
No. The FDIC computes that ratio for analysis and says in a footnote that it "is not a supervisory designation". It describes how large the sector has become relative to loss-absorbing capital across all banks; it is not a threshold, and no agency publishes one for this exposure. The number that constrains a bank is the limit its own board sets.
Why did bank lending to NDFIs jump in the fourth quarter of 2024?
Partly because the instructions changed. The December 2024 Call Report expanded what belongs in the line and moved loans to brokers, dealers, investment companies and mutual funds into it, and the FDIC records that some banks reclassified existing lending into the NDFI line as a result. Across the industry, commercial and industrial loans and "all other" loans both fell between the third and fourth quarters of 2024 — movements that mix real lending changes with reclassification and cannot be separated from the published data.
What would a simultaneous drawdown of the undrawn commitments do?
That is the scenario supervisors describe rather than one anybody has measured in this cycle. The FDIC's concern is that NDFIs using less stable funding alongside bank lines "may draw down their bank credit lines" in a downturn, increasing liquidity demands at banks at the same time as a fire sale of NDFI assets depresses values. The Federal Reserve's note models drawdowns against banks' capital and liquidity and concludes that, on the data available, the implications look limited so far — while warning that the interconnection warrants close monitoring.
Do smaller banks have this exposure too?
Much less of it. Banks under $10 billion in assets carried NDFI lending at 6.3% of tier 1 capital plus the allowance in the third quarter of 2025, against 68.1% at banks above $100 billion. They also do not report the five subcategories, so their exposure appears as a single line. The sector risks still reach them indirectly, through the same borrowers and the same collateral, which is an argument for a limit rather than a schedule.