PSR APP fraud performance data is the Payment Systems Regulator's annual, firm-by-firm report on authorised push payment (APP) scams at the UK's 14 largest banking groups and the smaller firms that receive the most scam money. It measures three things: how much of their customers' scam losses each bank refunded, how much their customers sent to scammers for every £1 million of payments, and how much scam money each of the 20 worst-placed receiving firms took in. A separate quarterly dashboard tracks the reimbursement rules that began on 7 October 2024. For a bank, the data are a public mirror: anyone can see where it stands, and since the sending and receiving banks now share each refund 50:50, every metric has a price. Botminds' APP Fraud Detection is built to move the sending-side measure, the money customers send to scammers, by helping a fraud team stop scam payments before they leave.
The PSR's three APP fraud metrics, read as a mirror
| Metric | What it measures | Whose data | The question it puts to your bank | In the latest report |
|---|---|---|---|---|
| Metric A · reimbursement | What it measuresThe share of customers’ reported APP scam losses the bank refunded, by value and by number of cases. | Whose dataThe 14 largest banking groups, about their own customers. | The question it puts to your bankOf what our customers lost, how much did we give back, and how far are we from the best and the worst? | In the latest reportUp to 7 October 2024, 60% by value across the 14; a 61-point gap between the highest and lowest. |
| Metric B · scams sent | What it measuresAPP scam losses per £1 million of payments the bank’s customers sent, and scam payments per million sent. | Whose dataThe 14 largest banking groups. | The question it puts to your bankHow much of our customers’ outgoing money ends up with scammers, against our peers? | In the latest reportMetro Bank, £377 lost per £1 million sent; Starling, 131 scam payments per million. |
| Metric C · scams received | What it measuresAPP scam money arriving per £1 million received, and scam payments per million received, for the 20 highest receivers. | Whose dataReported by the 14 senders about every firm their customers’ scam payments reached. | The question it puts to your bankHow much scam money lands in accounts we opened, and are we among the 20? | In the latest reportPrepay Technologies, £3,132 of every £1 million received; Guavapay, nearly 11% of payments received. |
What does PSR APP fraud performance data publish?
It publishes three measures for each named firm, plus totals and scam-type breakdowns. In the PSR's words, the data cover "Reimbursement to victims (from the largest 14 banking groups in Great Britain and Northern Ireland)", how much money is sent from victims' accounts by each firm, and "How much money is received into fraudsters’ accounts by each payment firm as a result of APP scams". The regulator presents it as transparency for customers: with it, "you will be able to see the full extent of how well your bank has performed in tackling APP fraud".
The latest report, published in February 2026, is the last before reimbursement became mandatory. It covers scam payments made over Faster Payments before 7 October 2024 whose cases closed in 2024, for the 14 largest banking groups and 11 smaller firms that were among the 20 highest receivers of scam money. Because it stops early, the PSR declined to compare firms with earlier years, and compared the first half of 2024 with the first half of 2023 instead. Full reports for 2023 and 2022 remain on the same page.
Where can I find APP fraud data by bank?
On the PSR's "APP fraud performance data" page, which carries the charts for each metric, an accessible text version, and the downloadable reports for 2024, 2023 and 2022. The aggregate figures since the reimbursement rules began are on a separate page, the APP scams reimbursement dashboard, updated quarterly. Firm-level reimbursement under the new rules is not yet published in the same form; the PSR said in its 2024 report that it planned to consult on proposals for APP scam data in the first quarter of 2026.
For a bank's executive team, the first step is to find its own row in each chart. For a firm outside the 14, the receiving tables are the ones to check: a firm appears there if it was among the 20 that received the most scam money relative to its payments, whether or not it reports to the PSR itself.
Metric A: how much of your customers' losses you refunded
Metric A shows the share of customers' APP scam losses each bank refunded, and before mandatory reimbursement it varied enormously. The PSR found that "Up to 7 October 2024, of the money lost to APP scams by customers, 60% was reimbursed", with a gap of 61 percentage points between the highest and lowest firm. By case count, 73% of reported cases were fully or partly reimbursed. Refunds ordered by the Financial Ombudsman Service are excluded from the rates.
The mandatory rules have changed what this metric means. In the first 18 months, the dashboard shows 88% of reimbursable value returned across all firms. A refund rate is now mostly a measure of compliance with the rules rather than of a bank's generosity, which makes the other two metrics, what customers sent and what accounts received, the more revealing ones for an executive team.
Metric B: how much your customers sent to scammers, per £1 million
Metric B is the sending bank's detection score in public: the value of APP scam payments per £1 million its customers sent, and the number of scam payments per million. The PSR gives Metro Bank as an example, "for every £1 million of transactions sent by customers of Metro Bank, £377 was lost to APP scams", and Starling for the volume measure, at 131 scam payments per million sent. Across the 14 largest groups, £145 million was lost in the first half of 2024, 18% less than a year earlier, with case numbers down 13%.
This is the metric scam detection moves directly. Every scam payment stopped before it leaves is one that never enters it; every scam payment released after a weak conversation is one that does. Recoveries are excluded from the PSR's sending figures, so a bank cannot improve Metric B by chasing money afterwards, only by stopping it.
Which banks receive the most APP fraud? Metric C
The firms that receive the most scam money relative to their size are mostly smaller payment and e-money firms, not the large banks. The PSR found that "The fraud rate for non-directed firms by value was 41 times higher than for the largest 14 banking groups", where non-directed means the firms not required to report to it. The three highest of those firms received 15% of all APP scam losses while handling 3% of consumer Faster Payments.
Where scam money lands, against where ordinary payments go
APP scams received, by value
- Largest 14 groups · 66%
- Other firms · 34%
Consumer Faster Payments, by value
- Largest 14 groups · 81%
- Other firms · 19%
APP scams received, by number
- Largest 14 groups · 52%
- Other firms · 48%
Consumer Faster Payments, by number
- Largest 14 groups · 90%
- Other firms · 10%
The extremes are stark. The PSR's example for value is that "for every £1 million received into customer accounts at Prepay Technologies, £3,132 was APP scams". For volume, it reports that nearly 11% of the payments Guavapay received were scam payments, a rate it calls 44 times higher than the next firm's, and that the FCA had restricted Guavapay from onboarding customers and issuing new e-money. The PSR notes that the receiving figures for these firms come from the 14 largest banks' data, because the smaller firms are not required to submit their own.
What does the receiving bank data show? Why it now costs half
It shows where scammers keep their accounts, and since October 2024 that has a direct price. Under the reimbursement rules the receiving firm pays half of each in-scope refund, which the PSR describes as bringing in, "for the first time, those firms on the receiving end that bank the fraudsters". A firm high in Metric C before the rules is a firm paying half of many refunds after them.
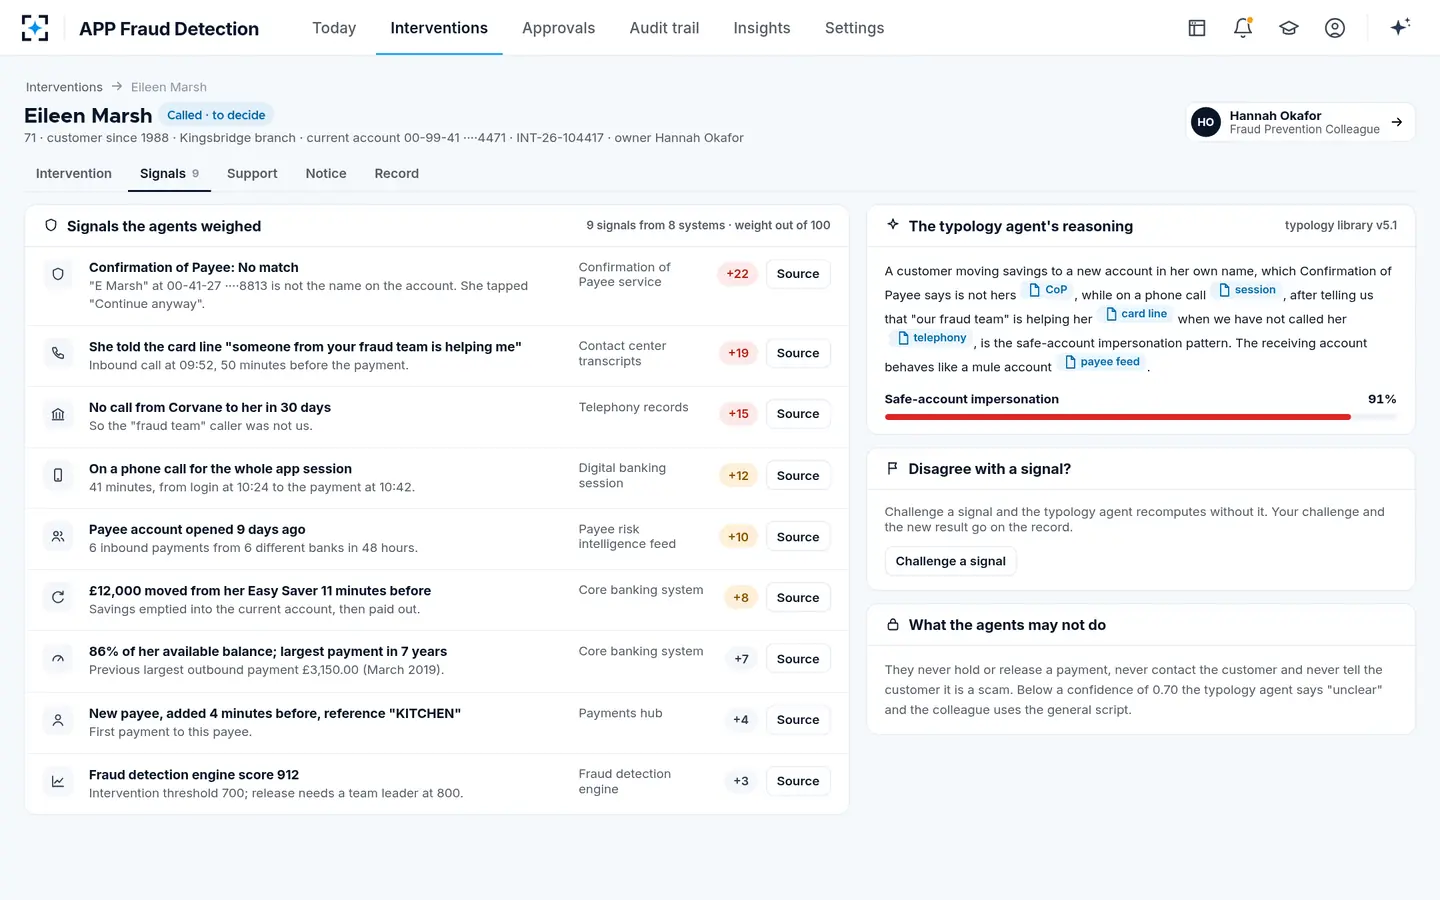
For a sending bank, the receiving data are also a detection input. The age and recent traffic of the receiving account, and the firm it sits at, are among the strongest signals a held payment carries. On the solution's fictional sample bank, the receiving account behind a £14,300.00 safe-account scam was nine days old and had taken six payments from six different banks in 48 hours; its payee risk signal carried 10 of 100 points in the typology agent's assessment. The PSR data say which firms such accounts cluster at; the payee feed says which account, today.
The receiving account as a signal: nine days old, six payments from six banks in 48 hours
What is the PSR APP scams dashboard?
The dashboard is the PSR's quarterly public summary of how the mandatory reimbursement rules are working across all firms. It covers closed claims for scam payments over Faster Payments made on or after 7 October 2024, using data the firms report to Pay.UK, the operator of Faster Payments, under the PSR's Specific Direction 20. To 31 March 2026 it showed around 438,300 claims, of which 301,500 were in scope, and 88% of in-scope value returned.
It has limits a reader should know. The PSR notes that "The data accuracy and completeness are subject to the information provided by sending firms. We do not have information from receiving firms to validate the information." It also excludes scams where both accounts are at the same firm: "The data does not include ‘on us’ APP scam reimbursement." And it is an aggregate: it does not show firm by firm how each bank is doing under the new rules.
The reimbursement dashboard at 18 months
438,300
claims reported, 7 October 2024 to 31 March 2026
82%
of claims closed within five business days
98%
closed within 35 business days
2%
of claims rejected for insufficient consumer caution in the first quarter of 2026
What share of APP claims are closed in five days?
82%. The dashboard reports "82% of claims in Q1 2026 were resolved within five days", a rate it describes as stable over the previous twelve months except for a dip in the third quarter of 2025, and 98% of claims overall closed within 35 business days. Five business days is the standard the rules set; a firm may stop the clock while it waits for information, up to the 35th day.
That speed is claims-side work; how a claims team is organised for five days is covered in PSR mandatory reimbursement: the claims team built for five days. The detection-side lesson is about evidence. A claim decided in five days is decided on what the sending bank already has: the warnings it gave, the questions it asked, the answers it heard. A bank whose intervention notes are free text gives its claims team less to work with than one whose every question and answer is kept with the time it was heard.
How does my bank compare on APP fraud? Reading your own position
Compare your bank on each metric separately, against the median and the extremes, and ask what your own data show that the PSR's do not. The published figures are a year or more old by the time they appear and stop at the bank's edge. The questions below turn them into a board discussion.
Six questions for an executive team reading the PSR data
- Where do we sit on scams sent per £1 million, by value and by number?
Metric B is the one detection moves. A rank by value far from the rank by number can reflect a mix of a few large scams and many small ones.
- Which scam types drive our value?
Across the 14 largest groups, purchase scams were about three quarters of cases but just over a quarter of value, while investment scams were a quarter of value from one case in twenty-five. Our mix decides where interventions pay.
- Do we appear in the receiving tables?
If we do, we pay half of those refunds now, and our account opening and monitoring are part of the answer.
- Do our own figures match the regulator’s?
The dashboard relies on sending firms’ data that receiving firms cannot validate. Reconcile before the board sees a discrepancy elsewhere.
- What does our management information measure?
The FCA found many firms reported fraud mainly against commercial risk appetite; add customer outcomes, such as delayed genuine payments and support given.
- What will the next report show?
The 2024 data stop on 6 October 2024. Our own held, stopped and released payments since then are the leading indicator.
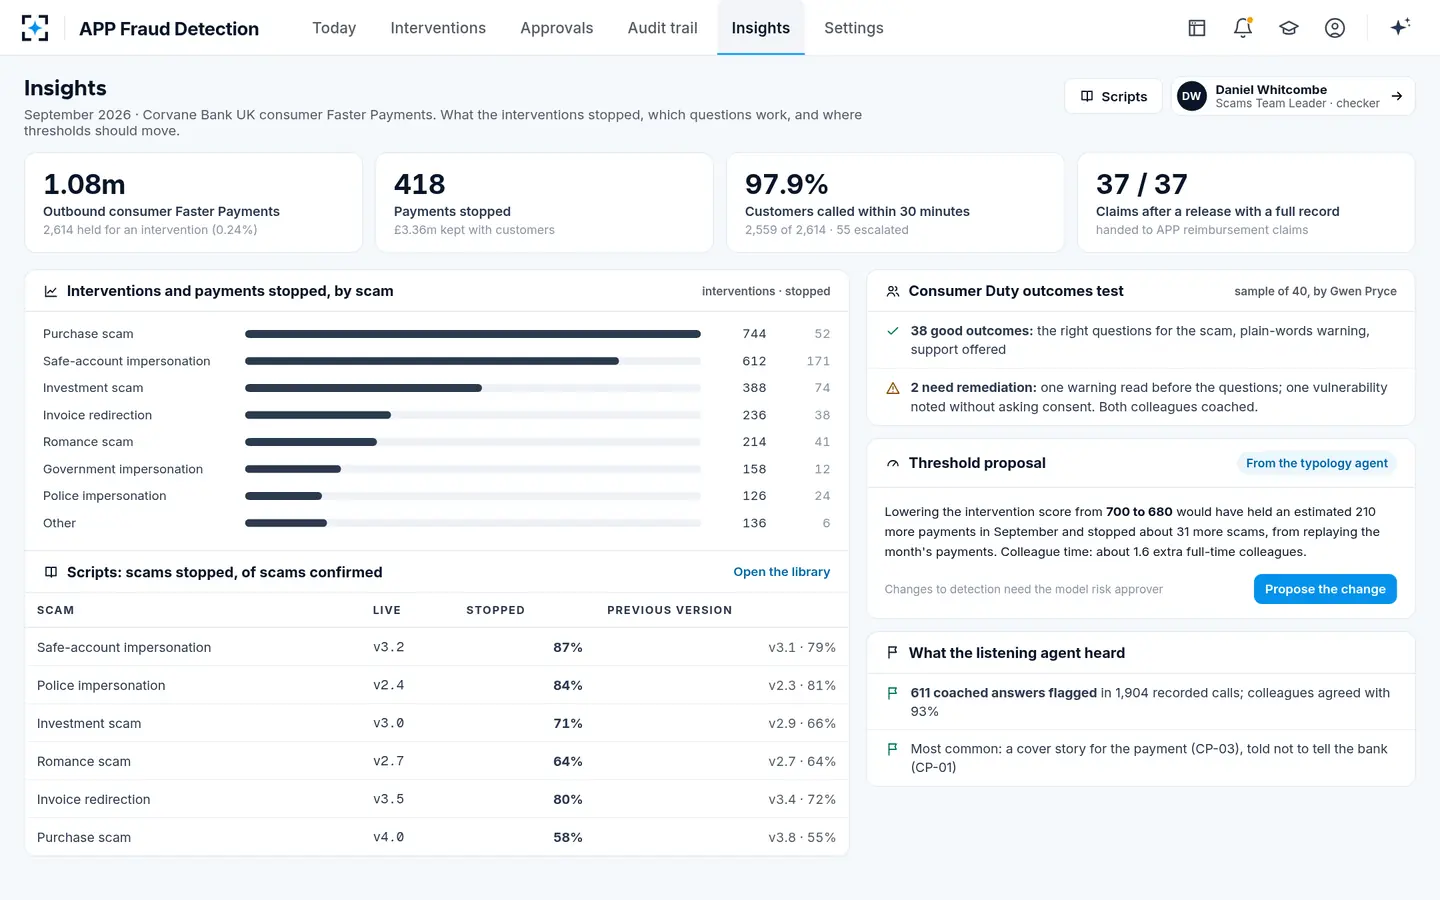
The last question is the one a detection system can answer every month. At the solution's fictional sample bank, the September view shows 1.08 million outbound consumer Faster Payments, 2,614 held for an intervention, 418 stopped with £3.36 million kept with customers, and the stop rate of each intervention script against its previous version. Those are sample figures, not a customer's result, but they are the internal version of Metric B: the scam payments that never made it into the regulator's numerator.
The internal mirror: what a month of interventions stopped, by scam type and by script
What the PSR data cannot tell you
It cannot tell you why a firm's numbers are what they are. The 2024 report itself notes "significant variation between firms" in refunds and lists definitional disputes that affect the counts: payments between a customer's own accounts, where a scam is flagged only if the victim was under the scammer's control, and payments to crypto exchanges, where it may not be clear when the victim lost control of the money. Sending and receiving firms also disagree about whether some claims are APP scams at all.
It cannot tell you where the scam started, though the PSR has begun to publish that separately. Its report on where scams originate found that in 2023 platforms owned by one social media group were linked to "54% of scam incidents (119,338 cases) and 18% of total losses (£62.7 million)", while fraudulent calls and texts were in 12% of cases but "accounted for 31.5% of the losses (£107.2 million)". A bank cannot stop a scam at its source, but knowing that scams which start with a call or a text cost the most per case is an argument for listening to the customer's account of who called them, which is what an intervention call is for.
And it cannot tell you what a stopped payment was worth, because stopped payments do not appear in it. That calculation, from the customer's side and the bank's, is in APP fraud prevention: what a stopped payment is worth. The system that produces the internal figures is APP Fraud Detection.
Questions people ask
Which UK bank has the most APP fraud?
It depends on the measure. In the PSR's 2024 report Metro Bank had the highest value of scam losses sent per £1 million among the 14 largest groups, at £377, while among receiving firms Prepay Technologies had the highest value received, £3,132 per £1 million, and Guavapay the highest share by number, nearly 11%.
How often does the PSR publish APP fraud data?
Firm-by-firm performance reports have been annual, covering 2022, 2023 and 2024 up to 6 October; since the reimbursement rules began the PSR has published a quarterly aggregate dashboard. It said it would consult on future APP scam data in the first quarter of 2026.
What is a directed PSP in the PSR data?
One of the 14 largest banking groups that the PSR has directed, under Specific Direction 18, to submit data on scams sent, where the money went, and reimbursement. Smaller firms are "non-directed"; their receiving figures come from the directed banks' reports.
Does the PSR data include scams paid by card or CHAPS?
The firm-by-firm reports and the dashboard cover scam payments over Faster Payments. Card payments have their own protections, and the dashboard notes that wider reporting of APP fraud, for example involving crypto, is broader than Faster Payments.
Why did APP scam reimbursement rates rise?
Because refunds became mandatory for in-scope scams from 7 October 2024. Before then, refunds by the 14 largest groups ran at 60% by value with a 61-point spread between firms; under the rules, the dashboard shows 88% of in-scope value returned.