A trade surveillance system comparison should compare the cost of a closed alert, not the price of a licence. Every alert a system raises must be examined, decided and recorded with a reason the firm keeps for five years, and most of the cost of surveillance sits in that work: analyst minutes per alert, the second check, management of the models, and the occasional expensive failure when data or logic silently stops an alert from firing. Three operating models dominate: a vendor engine with an in-house analyst team, review outsourced to a group hub or a provider, and an engine with agents that assemble each alert into a case for the analyst. No regulator or independent study publishes surveillance costs or alert volumes, so the comparison has to be built from a firm's own data. Botminds' Trade Surveillance is the third model's case layer: it works on the alerts an existing engine raises, so its value shows up in the minutes and the record per alert, not in detection.
Figures marked as sample data come from a fictional asset manager, Quillfield Capital, in the solution. Time estimates are Botminds' own and labelled. Regulators' findings are quoted with their sources.
Where alerts come from is not where findings come from
Share of 1,318 alerts a month
- Trading before news · 22%
- Front running · 9%
- Information barrier · 3%
- Momentum, close, spoofing · 47%
- Wash, ratings, short sales · 19%
Share of about 20 productive alerts a month
- Trading before news · 30%
- Front running · 20%
- Information barrier · 20%
- Momentum, close, spoofing · 15%
- Wash, ratings, short sales · 15%
How to compare trade surveillance systems: count the cost per closed alert
Start from the unit the rules make you produce: a decided alert with a recorded reason. Delegated Regulation 2016/957 requires a firm to keep its documented analysis of every order or transaction it examined, with the reason it did or did not report, for five years (Article 3(8)). A system that raises alerts cheaply but leaves each one expensive to decide is not cheap; one that decides alerts cheaply by not recording why is not compliant.
Two numbers then frame the comparison. Cost per closed alert covers the routine: licences and data spread over the alert count, plus the analyst and checker time each alert takes. Cost per productive alert covers the purpose: what the firm spends to find each case that leads to an escalation or a finding. The split above shows why both matter. In the sample firm, three models generate almost half the alerts and a seventh of the findings; a system comparison that cut those alerts in half, provably without losing the real cases, would save more analyst time than any difference in licence price.
Three ways to run surveillance, compared
Most buy-side firms choose among three operating models, or a mix. Each can meet the rules; each puts the cost and the risk in different places.
Trade surveillance system vendors and operating models, compared on what you pay for and what you still own
| Vendor engine, in-house analysts | Outsourced or group review | Engine plus case agents | |
|---|---|---|---|
| What you pay for | Engine licence and data; a team that gathers evidence and decides every alert. | A provider or group hub that generates alerts and often triages them; local oversight staff. | Engine licence and data; a case layer that assembles evidence; a smaller team that decides and checks. |
| Where analyst time goes | Mostly gathering: orders, tickets, news, messages and lists from separate systems. | At the provider; locally on oversight and escalations. | Mostly judging: the case arrives assembled, with a drafted reason and a counter-argument to answer. |
| What the rules still require of you | Everything, directly. | You "remain fully responsible", keep the expertise to judge the provider and "direct access" to alert data. | Everything, directly; a person makes every decision. |
| Typical weak spot | Notes that record a verdict, not the analysis; thin second checks. | Local staff who do not understand the alert logic or calibration. | Over-trusting drafted reasons; needs every close checked against its sources. |
| Best fit | Firms with steady volumes and a strong team. | Groups with a central hub and modest local flow. | Firms whose analysts spend most of each alert gathering evidence. |
Should we outsource trade surveillance?
You can outsource the work, not the responsibility, and the FCA has seen what happens when firms forget the second half. The Delegated Regulation allows delegation within a group, and delegation of "data analysis, including order and transaction data, and the generation of alerts" to a third party, on conditions: the firm "shall remain fully responsible", must keep "the expertise and resources necessary for evaluating the quality of the services provided", and must have "direct access to all the relevant information regarding the data analysis and the generation of alerts" (Article 3(6) and (7)).
In practice the FCA found arrangements with "inadequate knowledge of alert logic and calibration; weak or no quality assurance work on triaging alerts; and insufficient management information", and some UK compliance teams that "discovered the surveillance was ineffective for the UK business" only after the FCA asked (Market Watch 69). Outsourcing can lower the cost per closed alert. It does not remove the oversight cost, and a comparison that leaves that line out flatters it. The legal side is set out in the guide to MAR Article 16.
The cheapest option, and why it fails: leaving it to the front office
There is a fourth operating model that never appears in a vendor comparison because it costs almost nothing: relying on traders and portfolio managers to spot and escalate abuse themselves. The FCA has described firms that "place a reliance on front office staff to identify potential market abuse, sometimes giving them sole responsibility for monitoring", or that cite the front office "as mitigation for a limited or absence of surveillance in Compliance" (FCA, Market Watch 69).
It named three risks: that suspicious activity "is not consistently identified and escalated"; that "staff know when trading activity might be escalated and might share that knowledge"; and that staff paid on client business may be conflicted when deciding whether to escalate. The front office is an essential source of escalations, and the rules require its staff to be trained. It is not a substitute for independent review, and a cost comparison that counts it as one is comparing a control with its absence.
How much does trade surveillance cost per alert? Build the number yourself
No regulator or independent study publishes the cost of surveillance per alert, and vendors do not publish prices. The number has to come from your own records, and it is worth building because it turns a vendor comparison into arithmetic. Four terms cover most of it; a fifth, often missing, covers the risk.
Cost per closed alert, term by term
Platform
(engine + data + case tool) ÷ alerts closed
Annual licences, market data and news feeds, hosting and integration, over a year's closed alerts.
Procurement and IT
Analyst time
minutes per alert × loaded rate per minute
Measured on a timed sample of closes, end to end, by alert type.
Head of surveillance
Second check
share checked × minutes per check × rate
Every close, a sample, or grouped sets with a sampled check.
Senior analysts
Model care
(tuning + testing + annual review) ÷ alerts closed
Calibration, logic, code and data tests; backtests of every threshold change.
Surveillance and IT
Measure the analyst term carefully, because it dominates. Time twenty closes of each main alert type from opening to signed reason, including the minutes spent searching archives. Botminds' own estimate for a non-trivial alert is about 45 minutes by hand, three-quarters of it spent gathering, against about 14 minutes when the case arrives assembled; that is an estimate to test against your sample, not a measured result at any firm. The return rate of a second check is the quality side of the same term: a cheap close that comes back for missing evidence was not cheap.
Trade surveillance system challenges the price list leaves out
The largest costs in surveillance are the ones no invoice shows. The FCA's 2026 priorities list them in one sentence: "gaps in some firms' market abuse surveillance, with incomplete or inaccurate data feeds, ineffective alert calibration, and weak testing and governance of surveillance models" (FCA, Wholesale Markets priorities). Each has a price when it is found.
A data gap means alerts that never fired, and the FCA has described firms unaware of such faults for two years or more, one of them for over three years, discovered only when the regulator asked about trades the firm had not reported (Market Watch 79). Poor calibration means either noise, which costs analyst hours, or blindness, which costs more: a broker that narrowed its marking-the-close report in 2017 saw flagged trades fall "more than 98 percent" and paid a $350,000 FINRA fine (FINRA AWC No. 2014039952901). And calibration to the market rather than the firm is its own risk: the FCA warned that relying on "average peer parameters and average peer output volumes" will not necessarily satisfy MAR (Market Watch 56). A system comparison should ask each option how it prevents, detects and proves the absence of these failures.
Trade surveillance system benefits you can measure
Measure benefits on your own alerts, in four numbers: minutes per closed alert, productive rate per model, return rate on second check, and time from suspicion to report. Each can be read before and after a change, and each maps to something a regulator cares about.
Productive rate by alert model: where review time finds something
Read the low end carefully. A 0.5% productive rate on marking the close says each finding costs about two hundred reviews; it does not say the model is useless. The defensible response is the one the sample firm's Tuning agent takes: propose a narrower threshold for a documented innocent pattern, backtest six months, and show that every past true positive still fires before the Head of Surveillance approves. In the sample, that proposal would take the model from 204 alerts a month to 126, a 38% fall in its volume, with all three past true positives kept.
The alert queue: every alert already a case, with look-alikes grouped
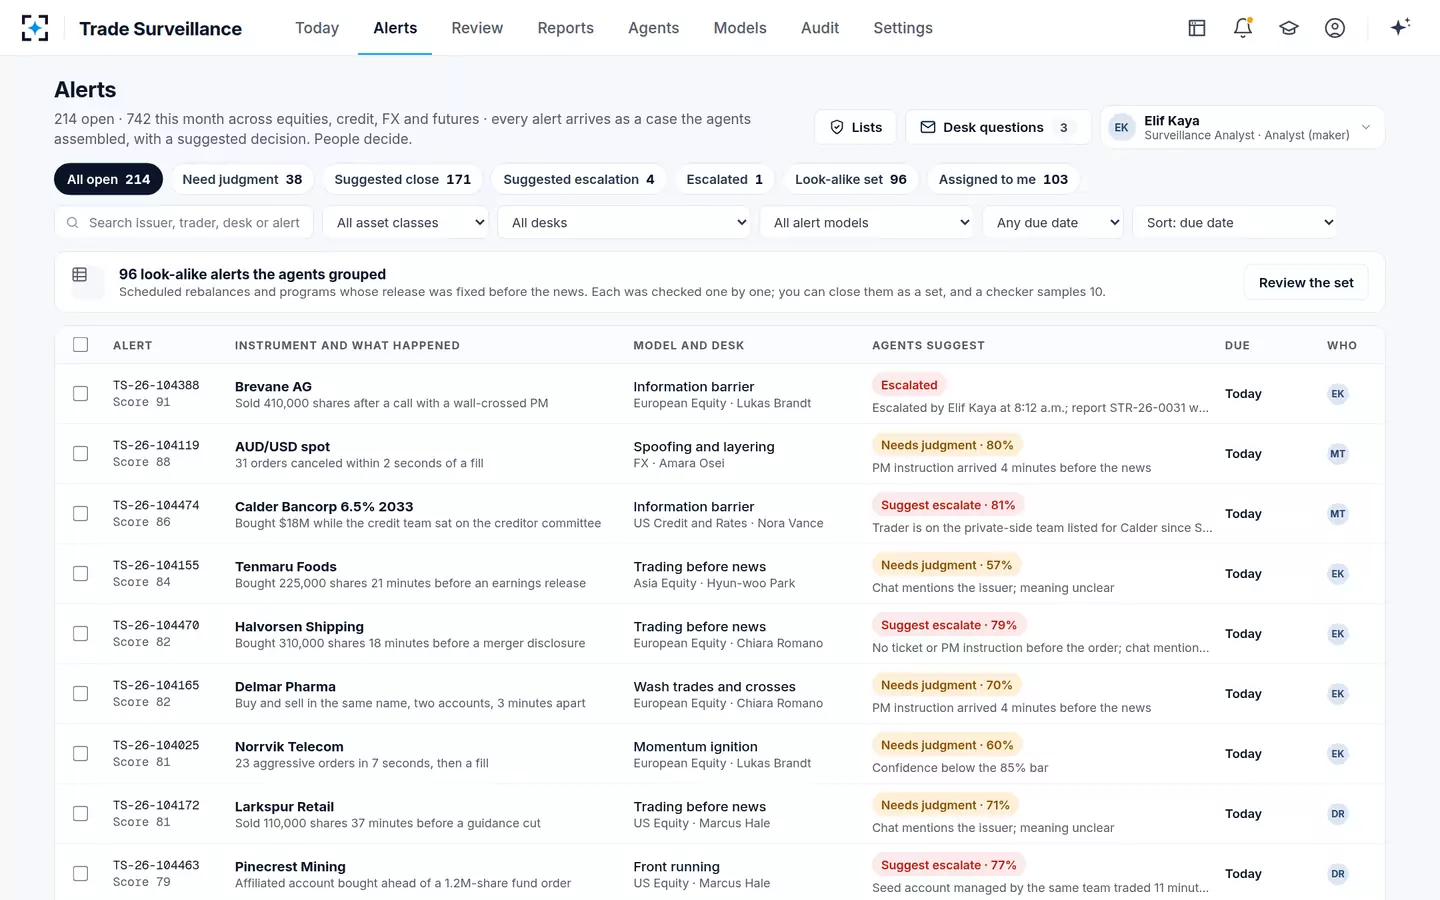
Trade surveillance system evaluation: a scorecard
Evaluate on your own data, with tests that can fail. A proof of concept on a vendor's demonstration data proves the demonstration. The checklist below can be run on any of the three operating models, and each item has a pass mark.
A trade surveillance system evaluation scorecard, run on last month's data
- Data completeness by source and venue
Order and execution counts reconcile to the order system for every desk, venue and private feed, including cancelled and amended orders.
- Seeded detection
A handful of planted cases per scenario all alert, including one in an illiquid instrument and one split across accounts.
- Past true positives
Every real case from the last year alerts on replay, at current thresholds and at any proposed ones.
- Minutes per closed alert
Timed on a sample of twenty per main alert type, by the people who will use it.
- The record
Each close carries what fired, what was checked, the counter-argument and the reason; it exports unchanged with its sources.
- Oversight you can exercise
Your staff can read each scenario's logic and parameters, and change thresholds only with a backtest and an approver.
- People in the decision
No automated close, escalation or filing; a second person on closes; the rules for both enforced by the system.
- Annual review readiness
The evidence for the yearly audit and review the rules require can be produced without a project.
Best trade surveillance software: where Trade Surveillance fits in the comparison
There is no best trade surveillance software in the abstract; there is a best fit for where a firm's cost and risk sit. Botminds' Trade Surveillance does not replace the engine: the alert models keep running there, and the solution takes their alerts and the order system's exceptions. It belongs in the comparison if a large share of each alert's cost is evidence gathering and note writing, if second checks are sampled because checking every close is too slow, or if threshold changes are argued without backtests.
It does not belong if the firm's problem is detection: missing data, uncovered asset classes or scenarios that do not exist. Those need fixing in the engine and the feeds first, as the implementation guide sets out. Where it fits, the case layer changes three lines of the formula: analyst minutes, the cost of checking every close, and the cost of proving a threshold change. One alert, traced end to end shows the minutes; to price it on your own alerts, start at Trade Surveillance.
Questions people ask
Who are the main trade surveillance system vendors?
No regulator publishes a list of trade surveillance vendors or rates them, and this guide names none. The right shortlist depends on asset classes, volumes and whether you need an engine, a case layer or both. Ask each for evidence on your own data rather than for a feature list; the questions in the scorecard above apply to all of them.
Is it cheaper to outsource trade surveillance?
Often for alert generation and first-level triage, less often in total. The firm remains fully responsible and must keep the expertise to judge the provider and direct access to its alert data, so oversight staff and management information remain a cost. The FCA has found outsourced arrangements that were ineffective for the UK business without the local team knowing.
What drives the cost of trade surveillance?
Analyst time per alert, multiplied by alert volume, is usually the largest line, followed by licences and market data. Low-yield alert models drive volume; in the sample firm, three models produced 47% of alerts and about 15% of findings.
How do you reduce trade surveillance costs without increasing risk?
Cut the minutes per alert before cutting alerts: assemble evidence automatically, group look-alikes with a sampled check, and draft notes from cited sources. Change thresholds only with a backtest showing past true positives still fire; FINRA fined a broker whose narrowed marking-the-close report flagged more than 98% fewer trades.
What should a trade surveillance RFP ask for?
A test on your own last month of data: completeness by source, seeded cases, replay of past true positives, timed closes, a sample exported record, and the provider's written limits on what automation may decide. Prices matter after those pass.