The alert to SAR ratio divides the alerts a transaction monitoring programme produces by the suspicious activity reports that come out of them; its mirror image, the share of alerts or cases that end in a SAR, is often called SAR yield or the alert-to-SAR conversion rate. It is the most quoted number in AML monitoring and one of the least informative. It cannot say whether suspicious activity was missed, it rewards filing for its own sake, and it averages away exactly the places where risk hides. This guide explains what the ratio does and does not tell a BSA Officer, what Bank of America's 2026 penalty shows about it, and which measures belong beside it in a board report. Botminds' AML Alert Triage, which prepares and challenges every alert before a Level 1 analyst decides, produces most of those measures as a by-product of the work.
An average can hide the alerts that matter: Bank of America's SAR yields around its review line
What is the alert to SAR ratio?
The alert to SAR ratio is the number of alerts generated for each SAR filed, over a period or by scenario. A bank that worked 40,000 alerts in a quarter and filed 800 SARs from them has a ratio of 50 to 1, or a 2% alert-to-SAR conversion rate. Variants divide by cases instead of alerts, or count SARs per scenario so that each rule can be judged on its own.
FinCEN defined the closely related measure in its October 2026 order against Bank of America: "SAR yield refers to the percentage of SARs the Bank files that result from the total number of Event Groups containing a certain risk factor or AML model". It also gave rare official guidance on its use: banks "may find it useful to measure SAR yield in evaluating the effectiveness of their internal controls, but this is not the only metric that can be considered" (FinCEN, Bank of America consent order, 2026).
What is a good alert to SAR ratio?
There is no regulatory benchmark, and there should not be one. The right ratio depends on the bank's customers, products and scenarios, and a ratio that looks good can mean either sharp monitoring or missed activity. A rising ratio may mean new scenarios are producing noise; it may equally mean the bank added coverage it previously lacked. A falling ratio may mean better targeting, or analysts escalating defensively.
The agencies said as much when they explained, in 2021, why monitoring produces so many alerts: "the objectives of most BSA/AML models place greater emphasis on coverage over efficiency", and "a bank may choose to accept a reduction in efficiency (such as by producing more alerts) in exchange for greater coverage". They also noted the difficulty of testing such systems given "the lack of information about realized outcomes (e.g., Suspicious Activity Reports)" (Interagency Statement on Model Risk Management for BSA/AML systems, 2021). That statement was rescinded in April 2026 along with the old model risk guidance, but the trade-off it describes has not gone anywhere: a ratio built for coverage will always look inefficient.
A ratio is useful in one place: comparing a scenario with itself over time, or comparing segments of one scenario. That is how Bank of America's own testing used SAR yield, and the chart above shows what that kind of comparison found when someone looked below the line.
What Bank of America's SAR yields reveal about an average
Bank of America's monitoring system scored alerts and grouped them by customer; a group was investigated only when its score reached 20 points. The bank measured SAR yield above and below that line for years. Its testing from 2018 to 2020 found that groups scoring 20 to 24 points produced SARs roughly a third of the time. Testing in 2022 and early 2023 found that groups scoring 16 to 19 points, just below the line and never sent to an investigator, "were generally between 38% and 45%" (FinCEN, 2026).
The bank-wide ratio could not show that. Neither could a yield computed only on investigated cases, because the alerts below the line were never investigated and so never counted. Only below-the-line sampling exposed it, and even then, FinCEN found, the bank's tests asked whether the yields differed statistically rather than how much reportable activity was being left uninvestigated. When the bank finally lowered the line in December 2023, it estimated 16,000 more US investigations a month, twice its previous monthly volume, needing "an incremental 750" staff; a lookback found nearly 8,900 SARs it had failed to file, on almost $4 billion of activity. FinCEN's penalty was $1.2 billion, with $750 million credited to the OCC's.
The lesson for a board report is direct. A ratio describes the alerts a bank chose to work. The question a board needs answered is about the alerts it chose not to, and only a measure built on below-the-line samples can answer it. Threshold tuning, set, tested and written down explains how that sampling is designed.
What is a defensive SAR, and why does the ratio reward it?
A defensive SAR is one filed to protect the bank from criticism rather than because the activity is genuinely suspicious. The Wolfsberg Group, the association of global banks that sets financial crime standards, put it plainly in 2024: a defensive filing may take away the bank's regulatory risk of not filing, but it is unlikely to tell law enforcement anything useful (Wolfsberg Statement on Effective Monitoring for Suspicious Activity, 2024). The guide to defensive SARs sets out how examiners and FinCEN treat the practice.
The ratio rewards defensive filing because every SAR improves it, useful or not. Wolfsberg's critique of the metric is the clearest anyone has published: banks measure monitoring "using metrics such as the coverage of potentially relevant red flags and typologies, alert and case volumes, alert productivity, or alert-to-SAR/STR ratios. These metrics are limited in their ability to measure actual effectiveness due to their focus on the quantity, as opposed to the usefulness, of the information provided."
The Group does not believe that the value being derived from the (constantly increasing) volume of SARs/STRs is contributing proportionately to effective outcomes in the fight against financial crime.
The Wolfsberg Group, Statement on Effective Monitoring for Suspicious Activity, 2024
US policy is moving the same way, at least on paper. Announcing its April 2026 program proposal, Treasury Secretary Bessent said that "for too long, Washington has asked financial institutions to measure success by the volume of paperwork rather than their ability to stop illicit finance threats" (FinCEN, April 2026). The proposed rule would let FinCEN weigh, in an enforcement decision, whether a bank provided "highly useful information to law enforcement" or produced "demonstrable outputs evincing the effectiveness" of its programme (91 FR 18704, proposed 31 CFR 1020.221(d)). It remains a proposal; no final rule had been published by late October 2026.
How many alerts lead to a SAR? Nobody publishes the answer
No US regulator publishes an industry alert-to-SAR ratio, and the reason is structural: FinCEN counts SARs, not alerts. It received 4.7 million SARs in fiscal 2024 from all filer types, and the top ten filers filed about 45% of them (FinCEN Year in Review FY2024). That concentration alone makes an industry average meaningless for a regional or community bank.
The usefulness side is even thinner. GAO found in 2022 that "FinCEN receives limited data from law enforcement agencies on their use of BSA reports" because "agencies largely do not collect such data", so "FinCEN cannot provide comprehensive feedback to financial institutions" on the reports they file (GAO-22-105242). The best public indication of how far filing and usefulness diverge comes from abroad. Germany's financial intelligence unit reported that of 337,186 suspicious transaction reports in 2022, it forwarded 15.3% to law enforcement, and feedback showed most resulting cases closed without prosecution (as cited by Wolfsberg, 2024).
From report to result: how little of the volume reached law enforcement in one country
German FIU, 337,186 reports received in 2022
- Forwarded to law enforcement · 15.3%
- Not forwarded · 84.7%
What KPIs should an AML program track instead?
Track the measures that would have shown the failures in recent enforcement orders before an examiner did: how old the queue is, how many decisions miss the bank's own deadlines, how long it takes from alert to detection to filing, how often quality control overturns a closure, and what below-the-line samples find. Keep the alert to SAR ratio, but per scenario and per score band, never as one bank-wide number.
Monitoring measures, and the question each answers for the board
| Measure | What it answers | Where the failure showed up |
|---|---|---|
| Backlog by age and risk band | Are we keeping up, and is the oldest risk being worked first? | TD Bank, USAA, Shinhan: backlogs of tens of thousands of alerts or 17 months |
| Share decided within the bank’s own deadline | Is the written procedure being followed? | Blue Ridge: standards for timely dispositioning ordered |
| Days from alert to detection date to filing | Are SARs filed within 30 days of detection, and is detection recorded? | TD Bank: over 6,000 SARs filed late |
| SAR yield per scenario and score band, including below-the-line samples | Are we missing suspicious activity just outside what we work? | Bank of America: 38–45% yields below the line |
| QC reopen rate and its reasons | Are closures supported by their evidence? | CommunityBank of Texas: alerts cleared without reading the supporting documents |
| Overrides of a reviewer or recommendation, by reason | Where do people and the process disagree, and who is right? | Untested rescoring and suppression at Bank of America |
| Law enforcement follow-up on filed SARs | Did anything we filed get used? | GAO: FinCEN cannot give comprehensive feedback |
| Staffing against alert volume | Can the desk do what the procedure promises? | TD Bank: AML spending held flat while backlogs grew |
Two of these deserve emphasis because they are the hardest to fake. Below-the-line SAR yield measures what the bank is not looking at; Wolfsberg recommends "assessment of false negatives", based on SARs that came from other sources such as staff referrals, as a qualitative and quantitative metric. And the QC reopen rate measures the quality of the closures behind every ratio. AML alert disposition sets out what a closure must carry for that check to work.
Backlog age: the measure behind the largest penalties
The large US monitoring cases of recent years keep returning to the same fact: a backlog the bank had measured and not cleared. At USAA Federal Savings Bank the count at the end of 2021 was "around 90,000 un-reviewed alerts and 6,900 un-reviewed cases", expected to grow to 120,000 and 24,000 (FinCEN, USAA consent order, 2022). At TD Bank the BSA Officer's reports to the board "consistently showed" the investigations teams "in 'red' status, indicating significant backlogs", while "AML spending remained flat" (FinCEN, TD Bank consent order, 2024). At Shinhan Bank America the backlog reached 17 months (FinCEN, 2023).
What an unreported or unworked backlog cost, in the enforcement record
90,000
unreviewed alerts and 6,900 unreviewed cases at USAA FSB, end of 2021
$140M FinCEN penalty, 2022
6,000+
SARs filed late by TD Bank during its backlogs, on over $500 million of activity
$1.3B FinCEN penalty, 2024
8,900
SARs Bank of America failed to file, found by a lookback after it lowered its review line
$1.2B FinCEN penalty, 2026
17months
of alert backlog at Shinhan Bank America
$15M FinCEN penalty, 2023
A ratio would have looked unremarkable in all four banks. Backlog age, reported by risk band and against the bank's own deadlines, would not. That is why the OCC wrote into Blue Ridge Bank's order a duty to report any backlog in suspicious activity monitoring and reporting to the board and management promptly and in writing, so it gets resolved (OCC, Blue Ridge Bank consent order).
What should be in a BSA board report on transaction monitoring?
A board report on monitoring should let directors see, in a few minutes, whether the bank can keep its own promises and whether it is missing anything. Volumes and ratios go at the back; age, timeliness and test results go at the front, each against a limit the board approved.
Eight lines for the monitoring page of a BSA board report
- Open alerts by age band and risk
With the oldest item and how far past the bank’s own deadline it is.
- Decisions within the deadline
By risk band, against the target the procedure sets, for example 3, 5 and 10 calendar days.
- Escalations and SAR timeliness
Days from detection date to filing, and any SAR filed after the 30-day period.
- Below-the-line results
What samples under each threshold found, against the bank’s false-negative tolerance.
- Quality control
Reopen rate and its top reasons, and any analyst or scenario outlier.
- Overrides
Closures against a reviewer or recommendation, by reason, with what QC found on them.
- Coverage changes
Scenarios added, retired or retuned this period, and who approved each.
- Resourcing
Staff and contractors against volume, and any BSA staff lent to other functions.
How the measures come out of Botminds' AML Alert Triage
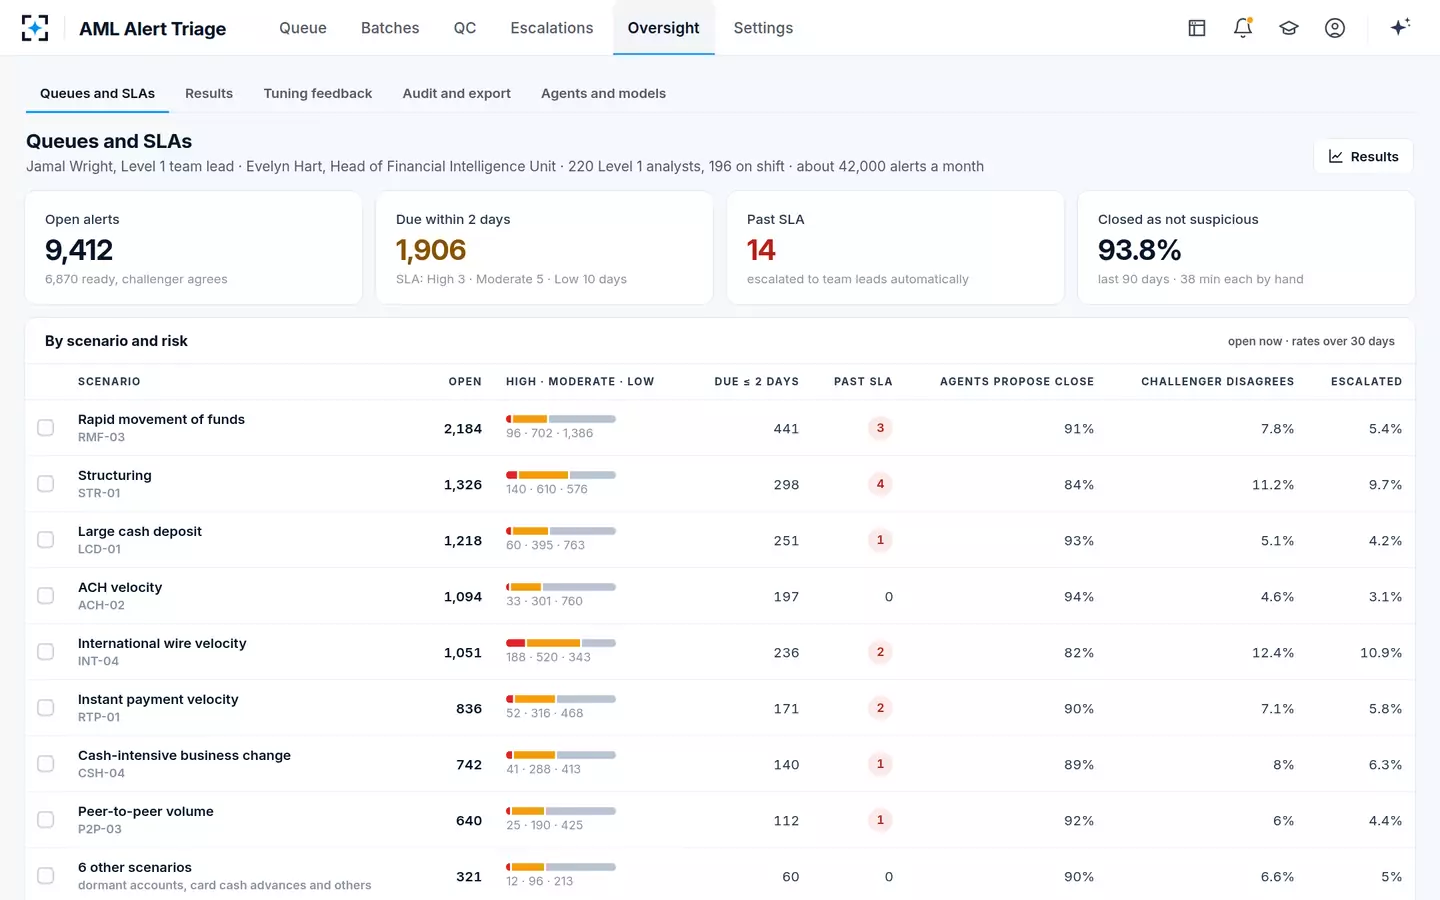
Because every alert in Botminds' AML Alert Triage is decided by a named analyst under a reason code, with a challenger agent's view recorded beside it, most of the measures above are counts of things that already happened rather than a separate reporting exercise. The queue screen shows open alerts by scenario and risk, what is due within two days and what is past the deadline, with the share the agents propose to close, the share where the challenger disagrees and the escalation rate per scenario. Past-deadline alerts go automatically to the team lead.
Queue age and challenger disagreement, by scenario, every day
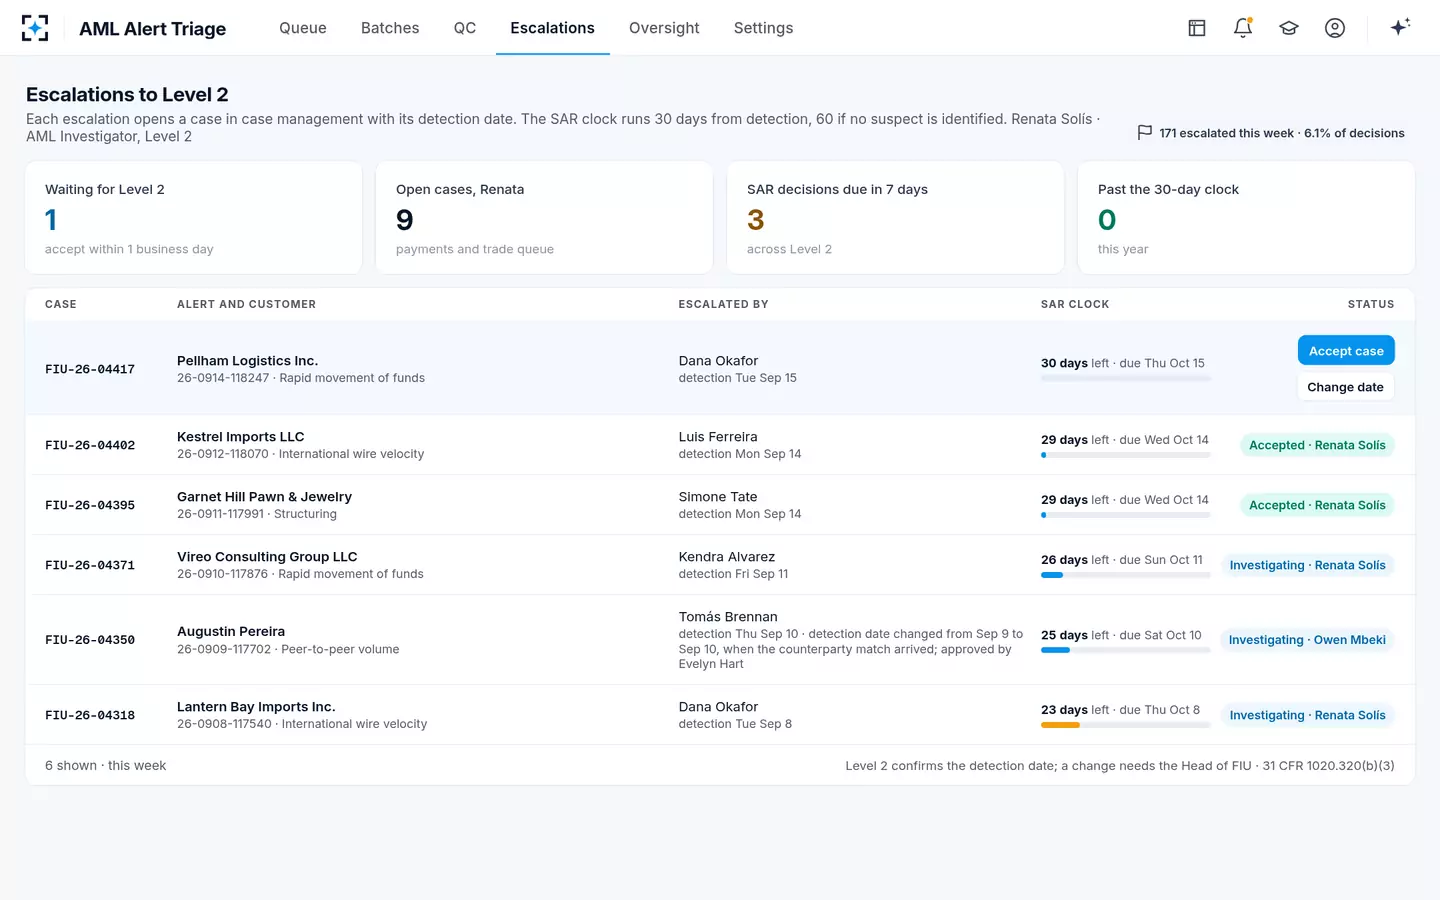
Escalations carry their dates. When an analyst escalates, the escalation writer records the detection date with its reason and opens the Level 2 case with the 30-day filing date, or 60 if no suspect is identified, as 31 CFR 1020.320(b)(3) sets out; only the Head of FIU can approve a change to that date. The SAR-timeliness line of a board report then comes from the record rather than from an investigator's memory.
Every escalation with its clock, and any changed date with its approver
The solution also feeds the below-the-line question from the other direction. Its tuning analyst agent finds alerts closed again and again for the same reason and writes a proposal for the Head of FIU with the evidence and expected effect, and it recommends no change where SARs were filed. It never changes a scenario. Whether the familiar claims about how many alerts are noise survive scrutiny is the subject of AML false positive rates.
Questions people ask
What is SAR yield?
SAR yield is the percentage of alerts, cases or alert groups that result in a SAR, usually measured per scenario or risk factor. FinCEN's 2026 Bank of America order defines it that way and says it is useful but "not the only metric that can be considered".
Is a low alert to SAR conversion rate bad?
Not by itself. A scenario built for coverage will convert few alerts, and the 2021 interagency statement said banks may accept more alerts in exchange for coverage. A low rate is a reason to test the scenario, including below its threshold, not to switch it off.
Should the alert to SAR ratio be used to tune scenarios?
Only alongside below-the-line testing. A yield measured on investigated alerts says nothing about the ones excluded; Bank of America's groups just below its line produced SARs more often than those just above it.
Do regulators set a target alert to SAR ratio?
No. Neither FinCEN nor the federal banking agencies publish a benchmark, and examiners judge whether the monitoring and decision process is reasonably designed and followed rather than whether it hits a ratio.
What is a false negative tolerance in AML?
It is the share of suspicious activity a bank accepts its thresholds may miss, measured by sampling below them. Bank of America adopted a 5% tolerance, with 7.5% as the level for escalation to its board, only near the end of the period FinCEN examined.