A cyber catastrophe modeling tool is software that simulates thousands of possible cyber events, such as cloud outages, self-spreading malware or a compromised software update, across an insurer's portfolio, and estimates how often losses of each size could occur. Its outputs are an average annual loss and an exceedance curve by return period, which feed pricing, capital and the reinsurance purchase. It is one of three ways insurers count cyber accumulation. The second is a list of the vendors insureds declared on their applications, added up in a spreadsheet. The third is a dependency index that names, for each shared vendor, the insureds that rely on it and the evidence for each. They answer different questions: how bad could a year be; what did insureds tell us; and who is in this event, now. Botminds' Cyber Accumulation Management is the third kind, with agents that read scans, applications, provider disclosures and policy terms; it does not replace a catastrophe model and is not sold as one.
Examples of the third method use a fictional sample book run through the solution: Thistlebrook Specialty, 2,846 insureds, $2.93 billion of cyber limit and 11 shared vendors. Every company in it is invented. Facts about catastrophe models come from Treasury, the PRA, EIOPA and the BIS Financial Stability Institute with the IAIS.
Three methods on one vendor outage: what each answers, and what each misses
| Question | Catastrophe modeling tool | Declared-vendor spreadsheet | Dependency index with agents |
|---|---|---|---|
| What it answers | How often could losses of each size occur in a year? | How much limit sits with insureds who named this vendor? | Which insureds are in this event, and what might each lose? |
| Who depends on the vendor | Assumed from industry data by sector and size, unless you supply your own. | Those who declared it at their last renewal. | Named from scans, applications and provider disclosures, each dated. |
| Policy terms | Coverage bands and averages; Treasury’s runs applied no exclusions. | Usually limit only. | Each policy’s sublimit, waiting period, retention, system-failure cover. |
| Output on the day | A return period for an event like this one. | A total limit. | A named list, limit against tolerance, an estimate at several outage lengths, gross and net. |
| Main blind spot | Your own technology dependencies and wordings. | Anything undeclared, stale or through a provider. | Frequency: it says nothing about how often. |
| Best used for | Capital, pricing, reinsurance structure. | A first screen when nothing else exists. | Tolerance between events; action within the hour during one. |
What is a cyber catastrophe model?
It is a probabilistic simulation of cyber events and their insured cost. Treasury described the class in its June 2026 report to Congress: "Probabilistic cyber risk modeling tools provide insurers with the ability to simulate the frequency and potential severity of economic and insured losses from a variety of scenarios", running "simulations thousands of times under various attack scenarios including data breaches, distributed denial of service disruptions, cloud outages, ransomware and malware infections" and others (U.S. Treasury, Report on the Effectiveness of the Terrorism Risk Insurance Program, June 2026).
The outputs are two. Average annual loss is "the estimated annual policy premium needed to cover losses from modeled cyber catastrophes over time, assuming the exposure remains constant." The aggregate exceedance probability curve shows the chance that a year's losses exceed each threshold, "typically ranging from 20 years (5 percent chance of occurring) to 1,000 years (0.1 percent chance of occurring)."
How do cyber cat models work?
They combine three things: exposure data on each insured, a catalogue of event scenarios, and probabilistic simulation. The BIS's Financial Stability Institute and the IAIS put it this way in 2026: "These models typically combine exposure data (eg firmographics, sector, technology stack), incident scenarios and probabilistic simulations to estimate expected losses across all policies" (FSI Insights No 75, 2026). The same paper notes that "Three major vendors provide such cyber catastrophe models, which suggests some concentration in the market."
The phrase "technology stack" is where a model meets accumulation. If the model is told which insureds use which cloud, identity provider and software, its cloud outage scenarios land on the right policies. If it is not, it uses industry assumptions about typical technology by sector and size. Correlation is the reason this matters more in cyber than elsewhere: CISA's 2018 assessment of the market observed that "Correlated risks are particularly likely in the cyber environment, because of the similarity of computer systems across the globe" (CISA, Assessment of the Cyber Insurance Market, December 2018).
What the models say: Treasury's three modelled events
Treasury ran a commercial cyber model over synthetic portfolios built from its terrorism-program data for the June 2026 report, which gives a rare public look at model output. Three scenarios, three portfolios, and losses that are zero or small at short return periods and very large at long ones.
Modelled losses climb steeply with return period: three cyber scenarios run by Treasury
Two things in Treasury's runs bear on accumulation. Business interruption was the largest coverage in both large scenarios (52.9% of losses in the endpoint worm, 39.2% in the certificate-authority event), which is the cover whose waiting periods decide who has a loss. And the runs used assumptions, not wordings: deductibles, sub-limits and waiting periods were estimated from the model's industry database rather than read from policies (the cyber insurance waiting period guide quotes Treasury's note). That is a sensible choice for a market study and a known gap for a single book.
What are the limits of cyber catastrophe models?
The supervisors who have seen the most model output are candid about it. After its 2022 stress test, in which most UK insurers used at least one external vendor model, with "three external models most commonly cited", the PRA wrote: "we encourage boards to understand the limitations and lack of convergence in existing cyber catastrophe modelling, and to ensure that they are satisfied with any measures taken to mitigate shortcomings in current approaches" (PRA, Insurance Stress Test 2022 feedback, January 2023).
How far apart insurers’ views of one cloud outage were
1-in-50
the shortest return period insurers gave the PRA’s seven-day cloud outage
1-in-475
the longest, for the same scenario
3
external vendor models most commonly cited by participants
1-in-200
the extreme return period the PRA expects cyber stress tests to reach
EIOPA added a forward-looking warning in June 2026. Advances in AI-assisted attack tools, it wrote, are "particularly relevant for cyber insurance portfolios and for business interruption coverage linked to ICT failures, where accumulation models may underestimate the potential impact of systemic cyber events" (EIOPA Financial Stability Report, June 2026). A model calibrated on yesterday's events is least reliable exactly where accumulation is worst.
the advancement of these models is likely to make the cyber threat landscape more dynamic, less predictable, and less suitable for traditional actuarial modelling approaches.
EIOPA, Financial Stability Report, June 2026, on advanced AI models in attackers’ hands
The other limit is closer to home. When the PRA asked insurers which cloud providers their insureds used, three standalone policies in four came back without one, and some of the named providers came from the model's market-share assumptions rather than the insurer's own data. When the book's dependency data is missing, the model's assumptions stand in for it, and the result describes the market rather than the book.
Can a spreadsheet track cyber accumulation?
For a first screen, yes; for an event, rarely well. A spreadsheet that adds up limit by declared hosting provider, identity provider and payroll vendor is cheap and better than nothing. Its weaknesses are structural. It only knows what insureds declared, at their last renewal; it rarely records region; it misses dependencies through managed-IT and software providers, which insureds often do not know about; and it carries limit, not the waiting periods and system-failure terms that decide loss.
In the sample book, 131 of the 418 insureds on the failed vendor were found from application answers. A declared-vendor spreadsheet would have seen those 131 and $104 million of limit; the full count, with scans and provider disclosures, was 418 and $340 million. The difference is the share of the event a spreadsheet would have missed on the morning it happened.
What is a deterministic cyber scenario?
It is one specified event, run with fixed assumptions. The FSI and IAIS define it against the stochastic kind: "deterministic scenario analysis defines a specific but plausible cyber event – such as a cyber attack on critical infrastructure or a large-scale cloud service outage – with fixed assumptions about the attack vector, affected systems, duration and economic impact." The PRA's 2022 cloud-down scenario, a seven-day outage of each insurer's largest cloud provider, is the best-documented public example, and the cloud outage scenario analysis guide sets out its assumptions.
New York's DFS asked for exactly this kind of exercise in 2021: insurers "should conduct internal cybersecurity stress tests based on unlikely but realistic catastrophic cyber events" (NYDFS Insurance Circular Letter No. 2, 2021). A deterministic scenario is only as good as the list of insureds it runs on, which is where a dependency index earns its place.
Three methods on one vendor event
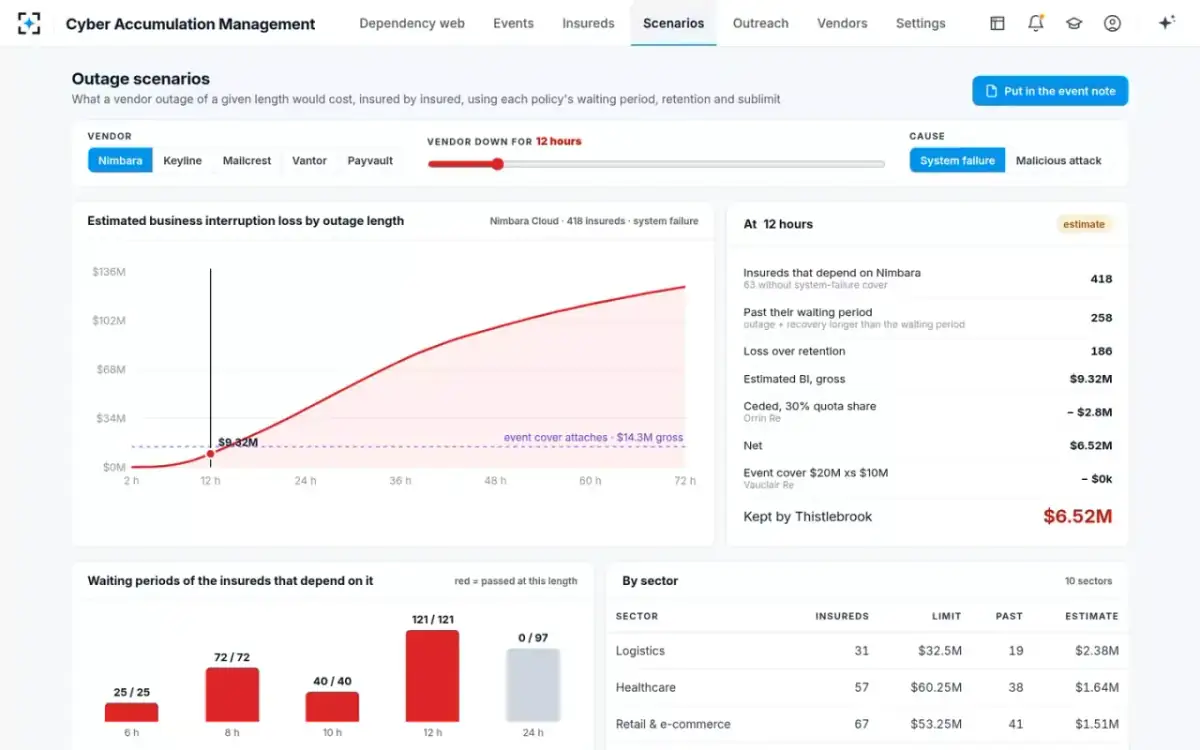
Take the sample book's outage: the cloud vendor's US-East 3 region fails at 06:12 on a Monday. The catastrophe model can say how unusual an outage of this kind and length is and what the book should expect to lose from such events over time; it cannot say, by 06:30, which 418 insureds are down. The spreadsheet can say that 131 insureds named the vendor; it cannot say which of them use that region, or which of the others depend on it through a provider. The dependency index named 418 insureds by 06:24, with $340 million of limit and $181.5 million of dependent business interruption sublimits, read the policies and estimated $9.32 million gross at 12 hours; it cannot say how often such a day comes.
The standing view between events: every shared vendor, limit against tolerance
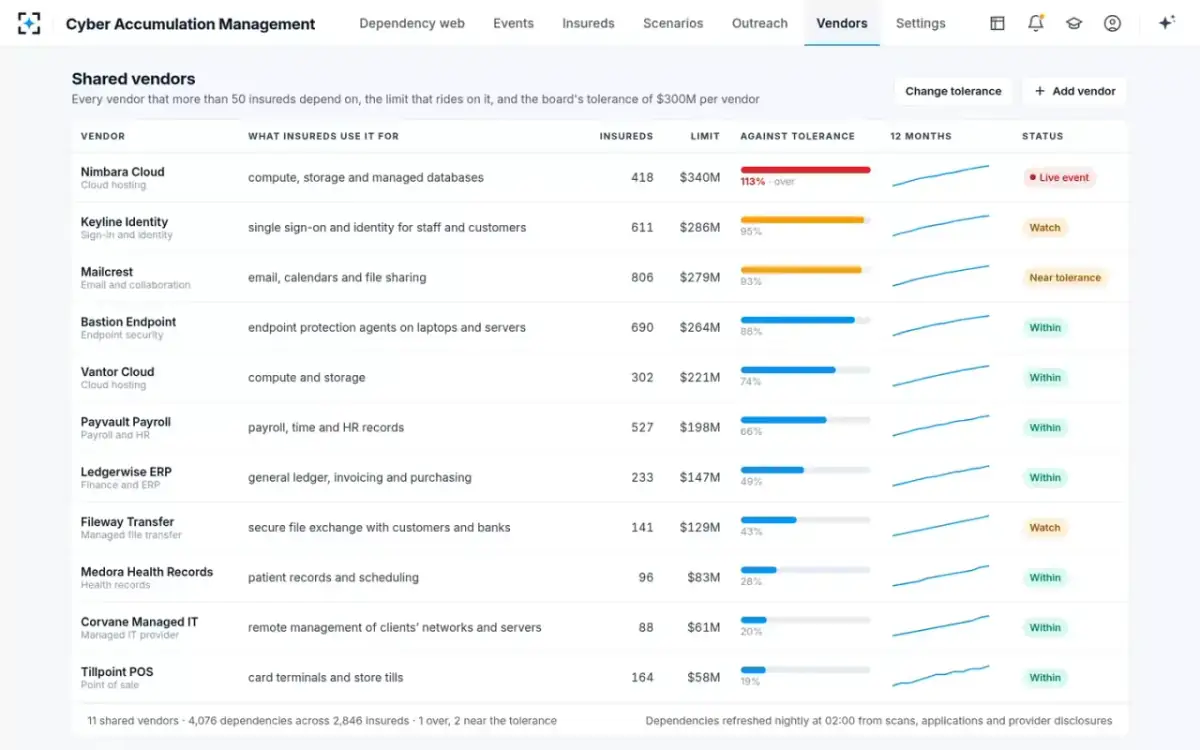
Used together, each covers the others' blind spot. The index feeds the model the book's real dependencies; the model gives the index the return periods that set tolerances and reinsurance; and the spreadsheet is retired once the index holds everything it did, with evidence.
Which cyber accumulation method do regulators expect?
Supervisors expect outcomes, not a product: a measured exposure, stress tests at extreme return periods, and board oversight. The PRA's statement asks for "cyber insurance underwriting risk stress tests that explicitly consider the potential for loss aggregation (eg via the cloud or cross-product exposures) at extreme return periods (up to 1 in 200 years)" (PRA SS4/17, 3.3). That needs a probabilistic view for the return period and a scenario view for the cloud event, on data that reflects the book.
None of the supervisors quoted on this page names a model or vendor, and the PRA's 2022 feedback puts the responsibility for model limitations on boards. For a buyer, that means the evidence behind any method (whose dependency data, which wordings, which assumptions) matters more than the method's name.
How accurate are cyber catastrophe models?
No regulator or academic source has published a validation of cyber catastrophe models against realised losses, and the record suggests wide disagreement: insurers' return periods for the same cloud outage ranged from 1-in-50 to 1-in-475 in the PRA's test. Accuracy for a single book can be tested, though, by replaying a real past event against the book as it stood the day before and comparing with the claims that followed; replaying 19 July 2024 sets out how.
The event-day view a model cannot give: loss by outage length, cause and waiting period
Buying: what to ask of each method
Ask each method to show its working on your book. A model vendor should show which of your insureds it placed on which provider, and why. A spreadsheet owner should show how current the declarations are. A dependency index should show the evidence for any dependency you pick, and run your last real vendor event.
Questions that separate the three methods in an evaluation
- Which of our insureds does your cloud scenario put on the failed provider?
If the answer is a market share, the scenario describes the market.
- Where did each dependency come from, and when?
Scan, application or provider disclosure, with a date; or an assumption.
- Do you read our waiting periods, sublimits and system-failure terms?
Or estimate them from industry data, as Treasury’s modelling did.
- What happens when the cause changes from system failure to attack?
The count of responding policies should change.
- Can you run our last real vendor event as of the day before?
And compare with what we paid.
- What do you not do?
An index gives no return periods; a model names no insureds on the day; a spreadsheet does neither.
Cyber Accumulation Management fits where the gap is the named, evidenced list and the estimate within the hour, and where an existing model needs better dependency data. It is not a fit if the need is a capital model or return periods; for that, keep or buy a catastrophe model and feed it from the index. The cyber aggregation tools guide covers the integration.
Questions people ask
What is the difference between AAL and an exceedance curve?
Average annual loss is the long-run average yearly cost of modelled catastrophes, used in pricing. The aggregate exceedance probability curve shows the chance that a year's total losses exceed each amount, used for capital and reinsurance; Treasury's runs report it from 1-in-20 to 1-in-1,000 years.
Do cyber catastrophe models include cloud outages?
Yes. Treasury lists cloud outages among the attack scenarios such tools simulate, and the PRA's 2022 stress test ran a seven-day cloud outage. How well the scenario fits a given book depends on whether the model knows which insureds use which provider.
How many cyber catastrophe model vendors are there?
The FSI and IAIS wrote in 2026 that three major vendors provide such models, which suggests some concentration, and the PRA found three external models most commonly cited in its 2022 test. Some insurers blend several models or build deterministic ones in house.
Can a cyber catastrophe model replace an exposure team?
No. A model turns exposure data into loss distributions; it does not collect the book's dependencies, read its wordings or decide what goes to reinsurers. The PRA expects boards to understand models' limitations and lack of convergence.
Is a dependency index a catastrophe model?
No. It names the insureds exposed to a shared vendor and estimates loss for an outage you specify; it does not simulate how often outages occur. In the sample book, it matched 418 insureds 12 minutes after a vendor's notice.