Cyber aggregation tools are the software an insurer uses to add up how much of its cyber limit one cause could hit at once. They come in three kinds. Probabilistic catastrophe models simulate thousands of events to estimate how often losses of each size occur, for capital and reinsurance. Exposure spreadsheets or data warehouses add up limit by sector and by the vendors insureds declared on their applications. Dependency indexes name, for each shared vendor, the insureds that rely on it and the evidence for each. The three are not substitutes. The model knows the market and the tail; the spreadsheet knows what was declared; only the index knows which of your insureds were seen running on a particular cloud region last night. Botminds' Cyber Accumulation Management is a dependency index with agents attached: it reads scans, applications and provider disclosures, reads each policy's terms, and estimates the loss for an outage you choose or one that is happening, leaving the decisions to the head of cyber.
Examples come from a fictional sample book run through the solution: Thistlebrook Specialty, 2,846 insureds, $2.93 billion of cyber limit and 11 shared vendors. Every company and person in it is invented.
Data in, a dependency list out, and the people who approve each step
Agent
Event watcherReads vendor status pages, advisories and CISA’s known-exploited list every five minutes; matches vendor, product and region.
Never: declare an event
Agent
Dependency matcherFinds insureds on each vendor in scans, applications and provider disclosures, keeping the evidence type, the source and its date.
Never: count a dependency without evidence, or mix provider-only dependencies with direct ones
Agent
Policy readerReads limit, dependent business interruption sublimit, waiting period, retention and system-failure cover from each policy and endorsement in force.
Never: assume a cover the wording does not give
A person decides
Portfolio manager approvesWhich evidence counts, recovery assumptions, cause rules and reinsurance terms, as a versioned set.
A person decides
Analyst loads the cat modelExports the dependency list per insured and vendor and loads it as the model’s exposure input, so scenarios run on the book, not a market share.
A person decides
Head of cyber decidesDeclares events and signs anything that goes to reinsurers; underwriters send broker outreach.
What are cyber aggregation tools?
They are tools for one question: if this cause happens, how much of our book is in it? A probabilistic catastrophe model answers it for thousands of hypothetical causes at once and returns loss against likelihood. A spreadsheet answers it for the causes someone thought to list, from the vendors insureds wrote on their applications. A dependency index answers it for each shared vendor in the book, with the evidence for every insured it names.
The gap they all try to close is the same one, and the BIS's Financial Stability Institute and the IAIS described it precisely in 2026. Cyber incidents "may originate outside the insured’s perimeter – such as through a compromised cloud provider, managed service provider or widely used software component – yet still trigger first-party losses and liability claims across multiple insureds simultaneously," and this "can lead to hidden correlations, delayed loss recognition and underestimation of accumulation risk, particularly where third-party exposures are not explicitly captured in underwriting questionnaires or exposure models" (FSI Insights No 75, 2026). The last clause is the brief for any aggregation tool: capture the third-party exposure explicitly, or it will be missed.
How do insurers track cyber aggregation today?
Mostly by sector and by declared vendor, with the model's market-share assumptions filling the gaps. That works for questions such as how much limit sits in healthcare. It fails for the question that matters on the day of an outage, because few books record the cloud provider, let alone the region, for most insureds. When the UK's Prudential Regulation Authority asked insurers in its 2022 stress test which cloud providers their insureds relied on, three standalone policies in four came back without one; the detail is in cloud outage scenario analysis.
The indirect route is where tracking breaks down most. The U.S. Treasury's 2023 review of cloud adoption in financial services noted that firms "can also rely indirectly on other third-party providers that may also use the same small number of CSPs" (U.S. Treasury, The Financial Services Sector's Adoption of Cloud Services, February 2023). The cyber insurance record has a sharp example. In July 2021, GAO recorded, Kaseya, a provider of IT management tools to managed service providers and small businesses, "reported that its tools were compromised and used to conduct ransomware attacks that affected about 1,500 organizations" (GAO-22-104256, June 2022). Almost none of those organisations would have named Kaseya on an application.
Do cyber cat models identify vendor dependencies?
At market level, yes; for your named insureds, usually not. Catastrophe models carry industry exposure data that describes typical technology use by sector and size, and they apply it to your schedule. Treasury's own modelling for its June 2026 report to Congress built synthetic portfolios from "commercial policyholder information such as industry sector, size by annual revenue and people employed, type of policy (e.g., standalone vs. packaged), and cyber coverage levels" drawn from a model's industry database (U.S. Treasury, TRIP Effectiveness Report, June 2026). That is the right input for a market view. It is not the same as knowing that Calloway Freight Systems' booking platform runs in one region of one provider.
A catastrophe model and a dependency index answer different questions
Probabilistic catastrophe model: How often could losses of each size occur in a year?
Dependency index, with agents: Which of our insureds are in this event, and what might it cost them?
Probabilistic catastrophe model: Thousands of simulated events across the book.
Dependency index, with agents: One shared vendor or region, named.
Probabilistic catastrophe model: Industry assumptions by sector and size, unless you supply your own.
Dependency index, with agents: Per insured: scan record, application answer or provider disclosure, each dated.
Probabilistic catastrophe model: Coverage bands and averages, often without exclusions.
Dependency index, with agents: Each policy’s sublimit, waiting period, retention and system-failure cover.
Probabilistic catastrophe model: Average annual loss, exceedance curve, return periods.
Dependency index, with agents: Named list, limit against tolerance, estimate at several outage lengths, gross and net.
Probabilistic catastrophe model: Capital, pricing, reinsurance purchase.
Dependency index, with agents: Between events to watch tolerance; during an event to act within the hour.
What data feeds a cyber accumulation tool?
Five feeds, and the tool is only as good as the weakest one it relies on. Each kind of evidence proves something different and misses something different, so a dependency should record which kind it rests on and how old it is.
Five feeds into a cyber accumulation tool: what each proves, and what it misses
Outside-in scans
What it provesWhich internet-facing hosts answer from a vendor’s addresses, region by region, on a given date.
Blind spotServices the insured runs privately; anything behind a provider.
RefreshNightly
Application answers
What it provesWhat the insured says it depends on: primary hosting, identity, payroll, managed IT, share of revenue through those systems.
Blind spotChanges since the last renewal; region often missing.
RefreshBind and renewal
Provider disclosures
What it provesWhich managed-IT and software providers run on the vendor, so their clients inherit the dependency.
Blind spotWhich of the provider’s clients actually use that service.
RefreshAs disclosed
Policy system
What it provesLimit, dependent business interruption sublimit, system-failure cover, waiting period, retention, endorsements in force.
Blind spotNothing about technology; it says what a loss costs, not who has one.
RefreshDaily
Vendor notices and advisories
What it provesWhat failed, where, and when, quoted with its time; CISA’s list of exploited vulnerabilities.
Blind spotCause is often unknown for hours.
RefreshEvery five minutes
Insureds can help more than they usually do. NIST's Cybersecurity Framework 2.0 asks organisations to manage their suppliers, including "GV.SC-04: Suppliers are known and prioritized by criticality" (NIST CSWP 29, February 2024). An application that asks for the critical suppliers an insured already lists for its own risk management, with region and the share of revenue through each, turns a vague "primary hosting provider" answer into usable evidence.
Can an accumulation tool read applications?
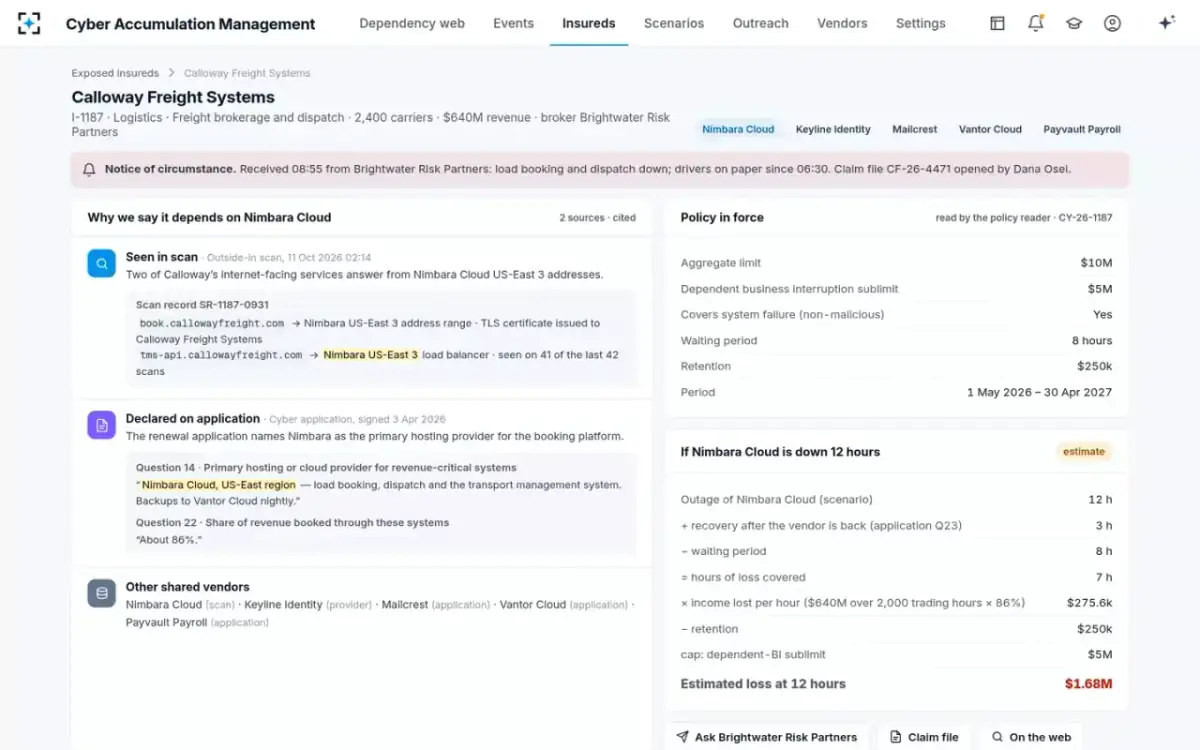
Yes, and it should, provided every reading is shown with its source. Which application questions carry usable evidence is covered in the underwriting series on cyber insurance application questions. Applications hold the most specific dependency facts an insurer has: in the sample, Calloway Freight Systems' April 2026 renewal answered question 14, primary hosting provider for revenue-critical systems, with "Nimbara Cloud, US-East region", and question 22 put about 86% of revenue through those systems. The scan of 11 October found two of its hosts on the same region's addresses. Two independent sources, each dated, is what a dependency should look like.
Reading by machine raises a governance question that supervisors have already answered. New York's DFS told insurers in 2024 that responsibility for understanding a vendor-built underwriting or pricing tool stays with the insurer (NYDFS Insurance Circular Letter No. 7, 2024; what to ask a vendor is in the AI vendor risk assessment questionnaire). EIOPA's 2025 opinion adds that insurance law already requires proportionate governance and risk management of mathematical models, whether or not they count as AI systems (EIOPA Opinion on AI governance and risk management, August 2025). The practical test is whether a person can open any dependency and see what the agent read.
One insured, two sources, and the estimate line by line
How does an aggregation tool work with a cat model?
In both directions. Into the model, the index supplies per-insured technology dependencies, so a cloud outage scenario runs on the insureds you can name instead of an assumed market share. Out of the model, the index takes the scenarios and return periods the analyst trusts, and applies them to an event that is actually happening, policy by policy. Between them sits the analyst, who decides which evidence is strong enough to load.
Run this way, the index also checks the model. If the model's market-share assumption puts 35% of your insureds on the largest cloud provider and your evidence puts 48% there, one of them is wrong, and you want to know which before the reinsurance renewal rather than after an outage. A replay of a past event, covered in CrowdStrike outage insured losses, is the cleanest way to settle it.
What should a cyber aggregation tool output?
Four things, each tied to a decision. If a tool's output does not change what someone does, it is a report, not a tool.
Four outputs, and the decision each one serves
| Output | What it contains | Who uses it, for what |
|---|---|---|
| Exposed-insureds list with evidence | Every insured on the vendor, how the dependency is known, the source and its date; provider-only dependencies apart. | The analyst checks it; claims opens files from it. |
| Aggregate limit and sublimit exposure | Limit and dependent business interruption sublimits on the vendor, against tolerance; policies with no system-failure cover. | The head of cyber decides whether to declare. |
| Broker and insured outreach list | One list per broker of its exposed insureds, with what to ask and how to notify a circumstance. | Underwriters review and send. |
| Event note | What happened, who is exposed, the estimate at three outage lengths, the reinsurance, next steps; every number cited. | The head of cyber signs; the chief underwriting officer and reinsurers read. |
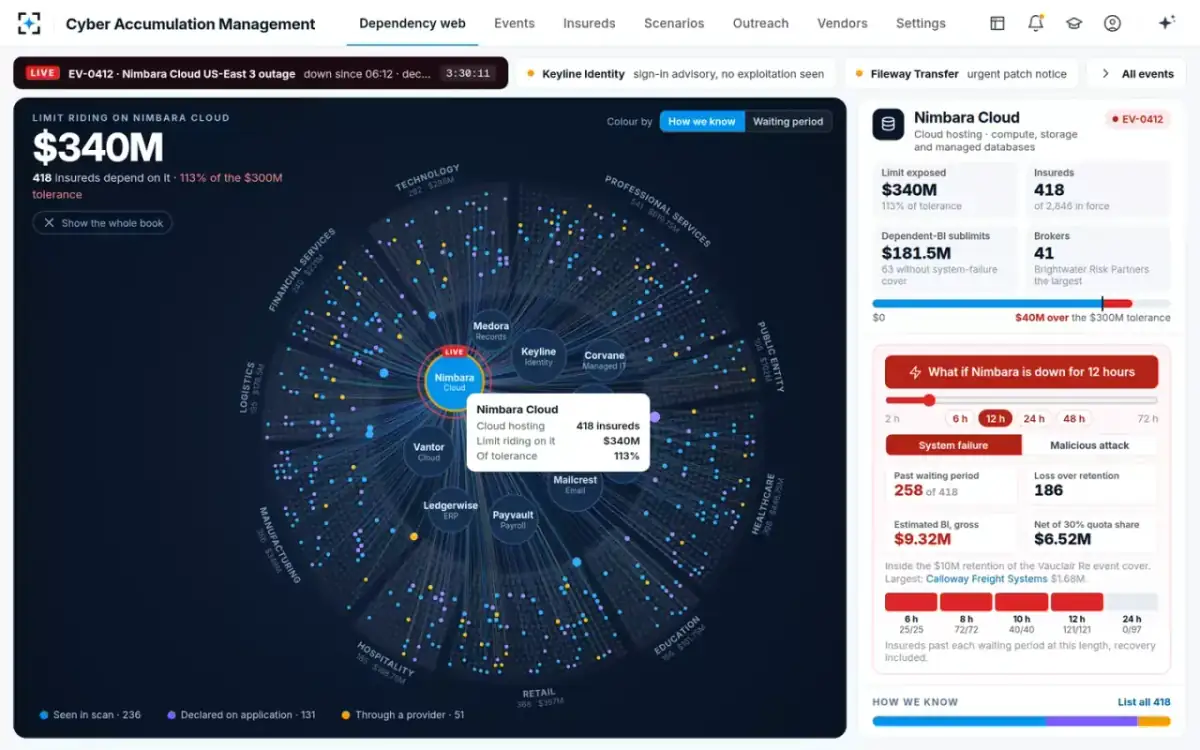
One vendor chosen, every dependent insured lit, coloured by how it is known
Evaluating cyber aggregation tools: a pilot on one past event
The fastest honest evaluation is a short pilot on your own book: load your in-force policies, your scan feed and your applications, choose one real vendor event from the last two years, and compare the tool's named list and estimate with what your claims files show. A tool that cannot show its evidence for a dependency, or cannot move from gross to net, will show it in the first week.
A pilot that tells you whether a cyber aggregation tool earns its place
- Pick one real past vendor event and fix the cut-off date.
Only evidence and wording dated before the event count on the estimate side.
- Count named insureds against notified insureds.
Hits, false alarms and misses, with the reason for each miss.
- Open ten dependencies at random.
Each should show what was read, from where, and when.
- Switch the cause and the outage length.
System failure against attack; 6 to 48 hours. The estimate should move for reasons you can explain.
- Export the list into your catastrophe model.
Run your standard cloud scenario on it and compare with the market-share version.
- Check who can send, declare and sign.
Drafting can be automatic; decisions should not be.
Where Cyber Accumulation Management fits: a book that writes cyber limit across shared vendors and needs a named, evidenced list and an event-day estimate within the hour. Where it does not: it is not a probabilistic model and will not produce return periods or a capital figure, and its estimates are not reserves. For the program around it (tolerances, board measures, reporting), see the KPIs a board should see.
Questions people ask
Is a cyber aggregation tool the same as a cyber catastrophe model?
No. A catastrophe model estimates how often losses of each size could occur across many simulated events; an aggregation tool adds up the exposure to a given cause. A dependency index is an aggregation tool that names the insureds and the evidence for each.
Can scan data alone identify which insureds use a cloud provider?
Partly. Scans see internet-facing services and the addresses they answer from, but not private workloads or dependencies through a provider. In the sample book, scans found 236 of the 418 insureds on the failed vendor; applications and provider disclosures found the rest.
Should provider-only dependencies be counted?
Counted and labelled. GAO's account of the 2021 Kaseya compromise, which reached about 1,500 organisations through IT management tools, shows why the indirect route matters. In the sample book, provider-only dependencies are a separate colour and a setting.
How often should dependency data be refreshed?
Scans nightly, applications at bind and renewal, provider disclosures when they change, and policy terms daily. Each dependency should keep its date so stale evidence can be seen and, if you choose, excluded.
Does an AI-assisted tool change who is accountable?
No. New York's DFS says insurers retain responsibility for third-party tools used in underwriting and pricing, and EIOPA applies the same governance to models whether or not they are AI. Keep the decisions, and the evidence behind each reading, with named people.