Critical data elements in banking, or CDEs, are the data items that a bank's most important risk figures depend on. The ECB defines them as "those data elements that are used to calculate the key risk indicators and have a direct or significant impact on the value of the indicator or technical routine of the calculation and the reporting" (ECB Guide on RDARR, May 2024, footnote 19). Under BCBS 239 they are the unit of control: each has an owner, a lineage back to its source, quality controls and a reconciliation. The difficulty is keeping the list alive and measuring accuracy where errors actually enter, which is usually in the middle of a chain of systems and spreadsheets, not at its end. Botminds' BCBS 239 Compliance treats every figure on a board, regulatory or supervisory report as a critical data element, traces it to source and reconciles it at every hop, with the unexplained part of any difference shown rather than hidden.
Examples come from a fictional sample bank, Corvane National Bank, a $92 billion regional lender with 312 critical data elements across 41 risk reports fed by nine source systems.
Where one critical data element goes wrong: the difference at each hop of commercial real estate exposure
What are critical data elements? The ECB's definition, and why it starts from indicators
A critical data element is defined by what it feeds. The ECB's Guide asks banks to define the key risk indicators in scope (at least the risk appetite indicators and the other indicators used in internal risk, financial and supervisory reports and models) and adds that "the critical data elements underlying the key risk indicators should also be explicitly identified". The indicator comes first; the elements are whatever moves it.
That ordering matters in practice. A list of CDEs built from the bottom up, by asking each system owner which fields matter, grows long and still misses the spreadsheet column that a board figure depends on. A list built from the top down, from the reports and indicators the board and supervisors read, is shorter and complete by construction. The Basel text points the same way: banks should keep "a “dictionary” of the concepts used, such that data is defined consistently across an organisation", and "an inventory and classification of risk data items which includes a reference to the concepts used to elaborate the reports" (BCBS 239, paragraphs 37 and 67).
There is a terminology trap here. The ECB distinguishes a data element, which carries the values an indicator is computed from, from a data attribute, the metadata that describes it in a system, and expects lineage at attribute level. A CDE inventory therefore needs both: the business element (commercial real estate exposure, committed) and the attributes that carry it through each system (a property-type code, a participation's sold percentage).
How do you identify critical data elements?
Start from the reports, apply a written rule, and let the rule decide. The ECB says the set of key risk indicators "depends on the risk profile of the institution and should be defined by the institution itself", so no regulator hands a bank its list. What supervisors look for is a clear, documented rule applied consistently, with the elements "identified and linked to key metrics", as the ECB recorded among best practices in its 2018 review (ECB Thematic Review, 2018).
A test for whether a data element in banking is critical
- Does it appear on a board risk report?
Any figure the board or its risk committee reads is in.
- Does it appear on a regulatory or supervisory report?
The ECB puts supervisory reports in scope; FINREP, COREP and stress-test submissions among them.
- Is it used in a risk limit or risk appetite indicator?
If breaching it would trigger escalation, it is critical.
- Does it feed a key model?
Model inputs and outputs that drive capital or provisions, such as PD, LGD and EAD.
- Would an error change a decision?
The Basel materiality test: would decision-makers have judged differently with the right number?
- Is it material in amount?
Your own threshold, applied to management reports you choose to add.
How many critical data elements should a bank have?
As many as its reports and indicators require, and no regulator sets a number. The count follows from the rule: the sample bank's rule ("a figure on a board, regulatory or supervisory report, or used in a risk limit") produces 312 elements across 41 reports and nine source systems. Extending the rule to management reports above a materiality threshold would add about 140 more. Both are reasonable; what matters is that the rule is written down, approved and applied the same way every year.
The more useful number is how many of them are under control. An inventory of 312 with lineage confirmed for 268 is a different programme from one with lineage confirmed for 40, and a board should see that split, not the total.
312 critical data elements, by the state of their lineage
How is data accuracy measured under BCBS 239? A reconciliation at every hop
Accuracy is measured by reconciling, and the question is where. Principle 3's guidance says "Controls surrounding risk data should be as robust as those applicable to accounting data" and that risk data "should be reconciled with bank’s sources, including accounting data where appropriate". Paragraph 40 adds that "Supervisors expect banks to measure and monitor the accuracy of data and to develop appropriate escalation channels and action plans". The ECB's Guide asks for data quality controls "from front office systems (and other capture systems) to the reporting layer" for every key risk indicator and critical data element, "automated where appropriate", plus "periodical reconciliation with institutions’ sources and reports".
Most banks satisfy the letter of that with one comparison: the report total against the general ledger, at the end of the chain. That test is real but blind in the middle. If a spreadsheet adds $212 million and nothing downstream checks it against the staging table, the report and the general ledger can still be compared, the difference attributed to timing or scope, and the element marked accurate. Reconciling every hop to the hop before it turns one unexplained total into a located, sized, owned difference.
Accuracy at one hop of a critical data element, written as a sum
Amount at this hop
A(n)
The element as held here: the workbook total to upload, $14,860.0M.
Read from the extract or file
Amount at the hop before
− A(n+1)
The same element one step nearer the source: staging, $14,648.0M.
Read from the extract
Differences cited to a row or rule
− Σ explained
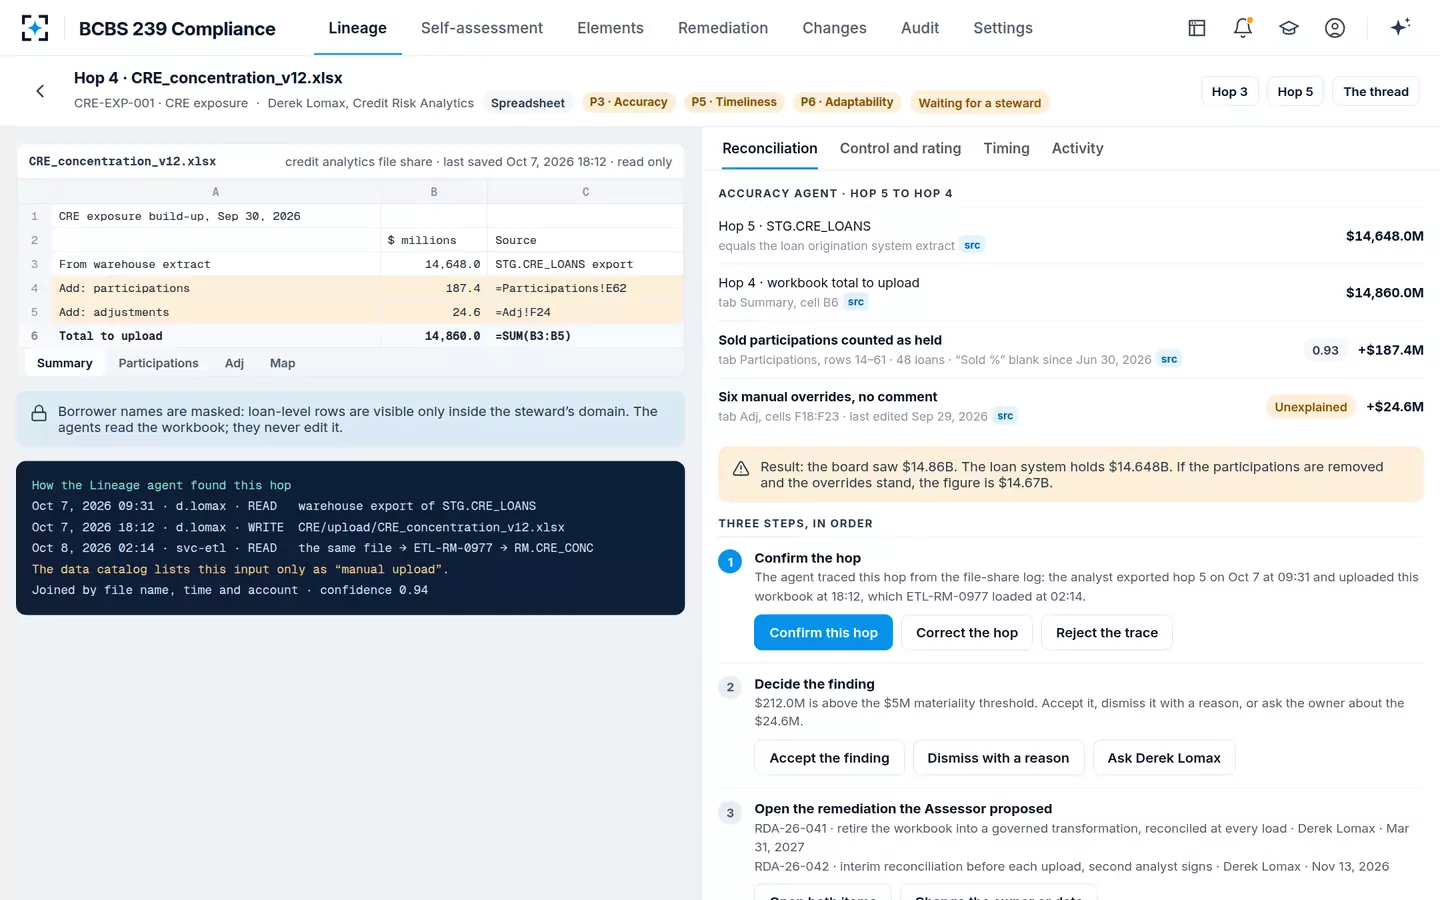
$187.4M of sold participations, cited to 48 loans on the Participations tab.
Proposed by an agent, accepted by the steward
Unexplained remainder
= $24.6M
Six overrides with no comment. Raised as a finding because it exceeds the $5M materiality setting.
Decided by the steward
The unexplained remainder is the number a board should see
The remainder is the honest measure because it cannot be argued away. In the sample bank, the $187.4 million is unwelcome but understood: 48 participations sold to other banks were pasted onto the workbook's Participations tab with the "Sold %" column blank, so the full commitment counted as held. The fix is clear and has an owner. The $24.6 million is six hard-coded overrides on a tab called Adj, last edited on September 29, 2026, with no comment. Until someone explains them, the board's figure is wrong by an unknown amount.
Three rules keep the measure honest. An agent may propose an explanation, but it must cite the row, tab or rule, and carry a confidence; the participations explanation came at 0.93. Nothing is forced to zero: the Accuracy agent marks the overrides unexplained rather than guessing. And differences under the materiality threshold are listed, not raised, so the queue stays readable. Supervisors have asked for exactly this kind of transparency: the ECB's 2018 review criticised reports where key data concerns appeared only "in the form of footnotes and commentary".
The difference at hop 4, split into what is cited and what is not
What are the BCBS 239 data quality dimensions?
BCBS 239 does not publish a list called data quality dimensions, but its aggregation principles name four, and the ECB uses the same set. Its Guide asks for data quality controls and indicators "covering, at least, the dimensions of accuracy and integrity, completeness and timeliness", each "including tolerance levels and robust correction processes". Adaptability is the fifth property the aggregation principles demand, though it is tested by requests rather than by a control on a field. The Basel annex defines each term.
The BCBS 239 data quality dimensions, defined and measured on a critical data element
| Dimension | BCBS 239 definition (Annex 1) | How to measure it on one element |
|---|---|---|
| Accuracy | “Closeness of agreement between a measurement or record or representation and the value to be measured, recorded or represented” | Unexplained remainder at each hop, against materiality |
| Integrity | “Freedom of risk data from unauthorised alteration and unauthorised manipulation” | Overrides and manual edits at each hop: who, when, with what approval |
| Completeness | “Availability of relevant risk data aggregated across all firm’s constituent units” | Rows, entities or categories lost or added between hops |
| Timeliness | “Availability of aggregated risk data within such a timeframe as to enable a bank to produce risk reports at an established frequency” | Elapsed time per hop, in normal runs and in the last stress drill |
| Adaptability | “The ability of risk data aggregation capabilities to change (or be changed) in response to changed circumstances” | Whether a new cut of the element needs a manual step |
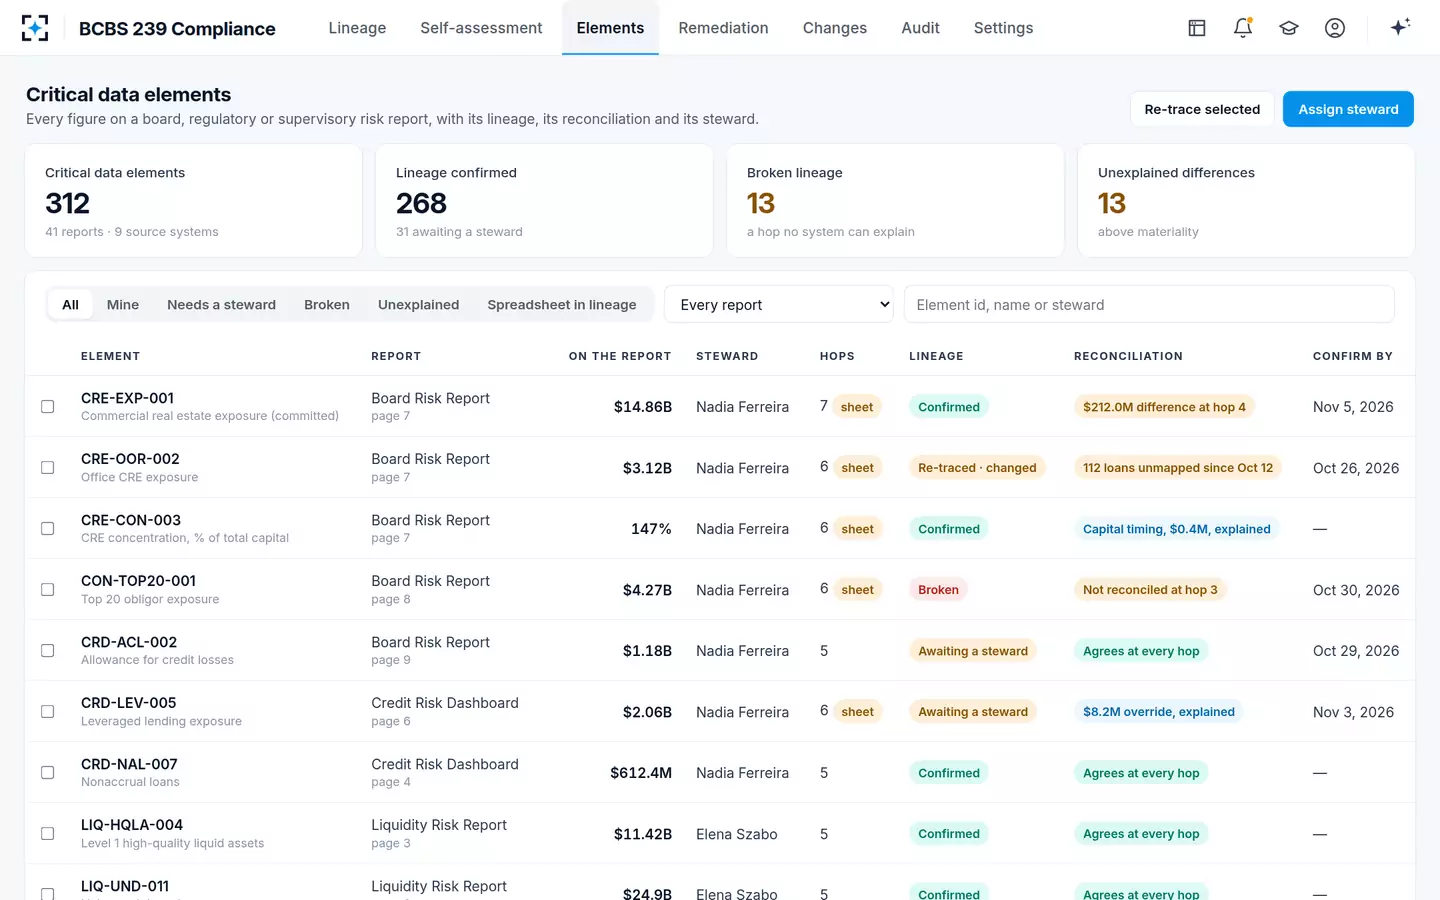
Completeness is where hop-by-hop measurement earns its keep a second time. When the sample bank's loan origination system renamed a property-type field in October, the commercial real estate figure did not change, but a related element, office exposure, did: 112 office loans fell out of the workbook's mapping, understating the figure until the mapping is fixed. Nothing at the end of the chain would have shown that. End user computing controls covers the workbook itself.
Who owns a critical data element?
A named data owner, for the whole path. The ECB expects data owners to be responsible for key risk indicators and critical data elements from front to end, contributing to the definition of data quality controls and ensuring remediation. In the sample bank the commercial real estate element has a steward who confirms each hop and a separate owner for the workbook at hop 4, who answers for its controls. Data owner vs data steward sets out who does what at each hop, and why the regulators' texts never use the word steward.
Keeping a critical data element inventory current
An inventory kept in a spreadsheet drifts from the reports within months, because reports, templates and systems change and nobody updates the list in step. The ECB's 2018 review saw the opposite practice at the better banks: critical data points were mapped to "source, control process, remediation plan", and institutions "recertified those critical data points on an ongoing continuous basis". The ECB's Guide adds a register of data quality issues with severity, root cause, a "quantitative impact analysis", deadlines and "a date for effective remediation (including appropriate evidence)".
In BCBS 239 Compliance the inventory is tied to the lineage, so a change re-opens only the elements it touches. The Change agent watches system releases, schema and job changes and report templates. In the 60 days to the sample bank's October assessment it saw four changes and re-traced 20 elements; one release changed one element, and one re-trace paused because the risk reporting platform stopped answering, with nothing marked unchanged until it did. Every confirmation and finding carries a person's name and a reason code. Automated data lineage explains how the re-trace works.
The critical data element inventory in BCBS 239 Compliance, with lineage and reconciliation per element
Questions people ask
What is a CDE in banking?
A critical data element: a data item that a key risk indicator, board figure, regulatory report or model depends on. The ECB defines CDEs as the elements used to calculate key risk indicators that have a direct or significant impact on the indicator's value or on how it is calculated and reported.
What are examples of critical data elements in banking?
Committed exposure by counterparty or sector, the property type and location of a commercial real estate loan, the sold share of a participation, a loan's delinquency status, collateral values, high-quality liquid assets and probability of default. Each feeds a figure the board or a supervisor reads.
Is there a regulatory list of critical data elements?
No. The ECB says the key risk indicators depend on the institution's risk profile and should be defined by the institution, with the underlying critical data elements explicitly identified. Supervisors check that the rule is documented, applied consistently and covers board, financial and supervisory reports.
What is risk data accuracy?
The closeness of a risk figure to the true value it represents; BCBS 239 defines accuracy as "Closeness of agreement between a measurement or record or representation and the value to be measured". In practice it is shown by reconciling the figure to its sources and explaining any difference.
How often should critical data elements be reviewed?
Whenever something they pass through changes, and at least once a year as part of the self-assessment. The ECB's 2018 review found better banks recertifying critical data points on an ongoing basis, and re-running certification after major system changes.
What is the difference between a critical data element and a key risk indicator?
A key risk indicator is the measure the bank steers by, such as a concentration ratio or a limit utilisation. Critical data elements are the inputs that indicator is calculated from; an error in one of them moves the indicator.