An operational resilience dashboard shows a bank's important business services against their impact tolerances: for each service, the slowest recovery tested this year against the tolerance the board approved, with the tests still to run, the fixes still open, and the state of the self-assessment. It is how a head of operational resilience, a chief operations officer and a board committee see in one place whether the bank could stay within tolerance today. The difficulty is that every number on it rests on a service map and a test result, and both age. SYSC 15A requires maps to be kept under review and refreshed at least yearly, but the systems behind a service change weekly. Botminds' Operational Resilience Management is an agentic solution that compares every confirmed map with the CMDB, the third-party register, continuity plans and runbooks each night, so its dashboard leads with what has changed and who must confirm it.
The examples are from the solution's fictional sample bank, Corvane Bank UK, with 11 important business services, on Thursday, October 22, 2026. The rules are quoted and linked where they appear.
One supplier hosting move in a year: found at the annual review, or found the night it is announced
- Map v14 confirmed Oct 97 days
- Both gateways on one cloud region, not in the mapup to 358 days
- Map v14 confirmed Oct 97 days
- Found Oct 16, confirmed that afternoon, test proposed for Dec 2known
What should an operational resilience dashboard show?
It should show each important business service against its impact tolerance, and the evidence behind that position: how recent the map is, how recent the test is, and what is still open. A status colour per service is the least useful version, because it hides the two things a reader needs to know, how close the service is to its line and how old the evidence is that says so.
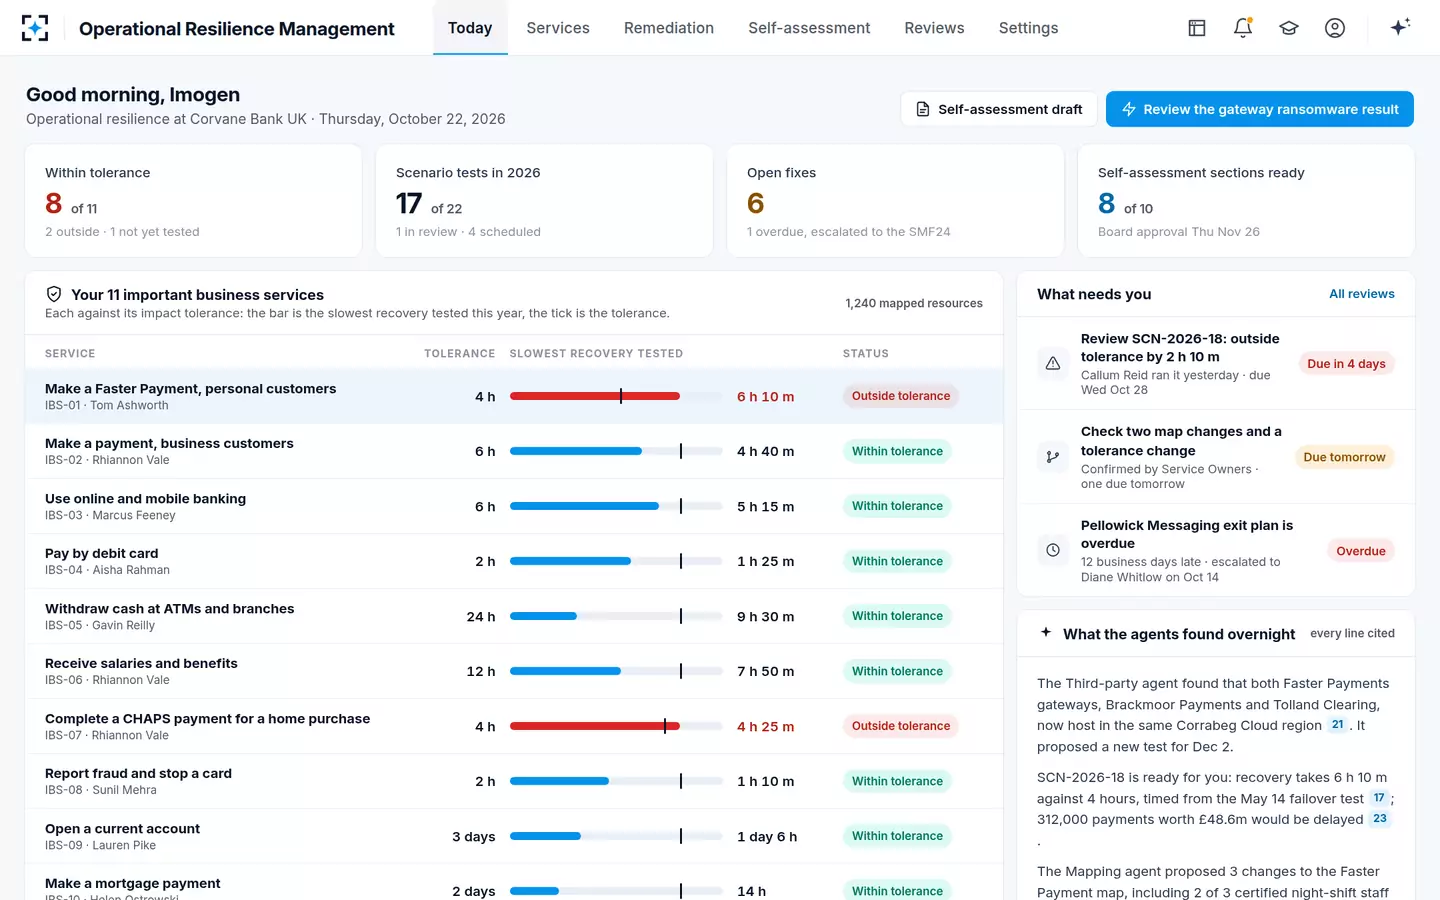
The sample bank's morning view leads with four counts: 8 of 11 services within tolerance, 2 outside and 1 not yet tested; 17 of 22 scenario tests done; 6 open fixes, 1 overdue; 8 of 10 self-assessment sections ready. Below them each service is a bar, the slowest recovery tested this year, with a tick at its tolerance. To the side is a list headed "What needs you": a scenario result to check, two map changes and a tolerance change, an overdue exit plan. The FCA counts that kind of visibility as good governance; its 2026 review noted that "Dashboards are used to make key metrics and progress more visible" (FCA, March 2026).
Eleven important business services against their impact tolerances
How often should service mapping be updated?
At least once a year and whenever something material changes, under both regulators' rules, and in practice as often as the underlying records change. The FCA requires a firm to review its mapping "if there is a material change to the firm's business, the important business services identified … or impact tolerances" and in any case within a year of the last review (SYSC 15A.4.3R). The PRA expects firms "to update their mapping annually at a minimum, or following significant change if sooner" (SS1/21, 5.9).
The phrase that does the work is "following significant change", and it presumes the bank knows a change has happened. Most changes that break a map happen outside the resilience team: a supplier moves data centres, a team is reorganised, a runbook is rewritten, a software version is replaced. A yearly mapping exercise satisfies the date in the rule and misses the trigger. The FCA's 2026 review credited firms where named owners of mapping data kept it from going stale or wrong (FCA, March 2026; quoted in who maps, tests, checks and signs); ownership is half of the answer, and noticing the change is the other half.
How do you know a service map is out of date?
Compare it with the records it was built from and look for disagreements. A map says which applications, people, sites, suppliers and procedures a service depends on; each of those facts also lives in a system of record that changes on its own schedule. When the map and the record disagree, either the map is out of date or the record is wrong, and either way someone should look.
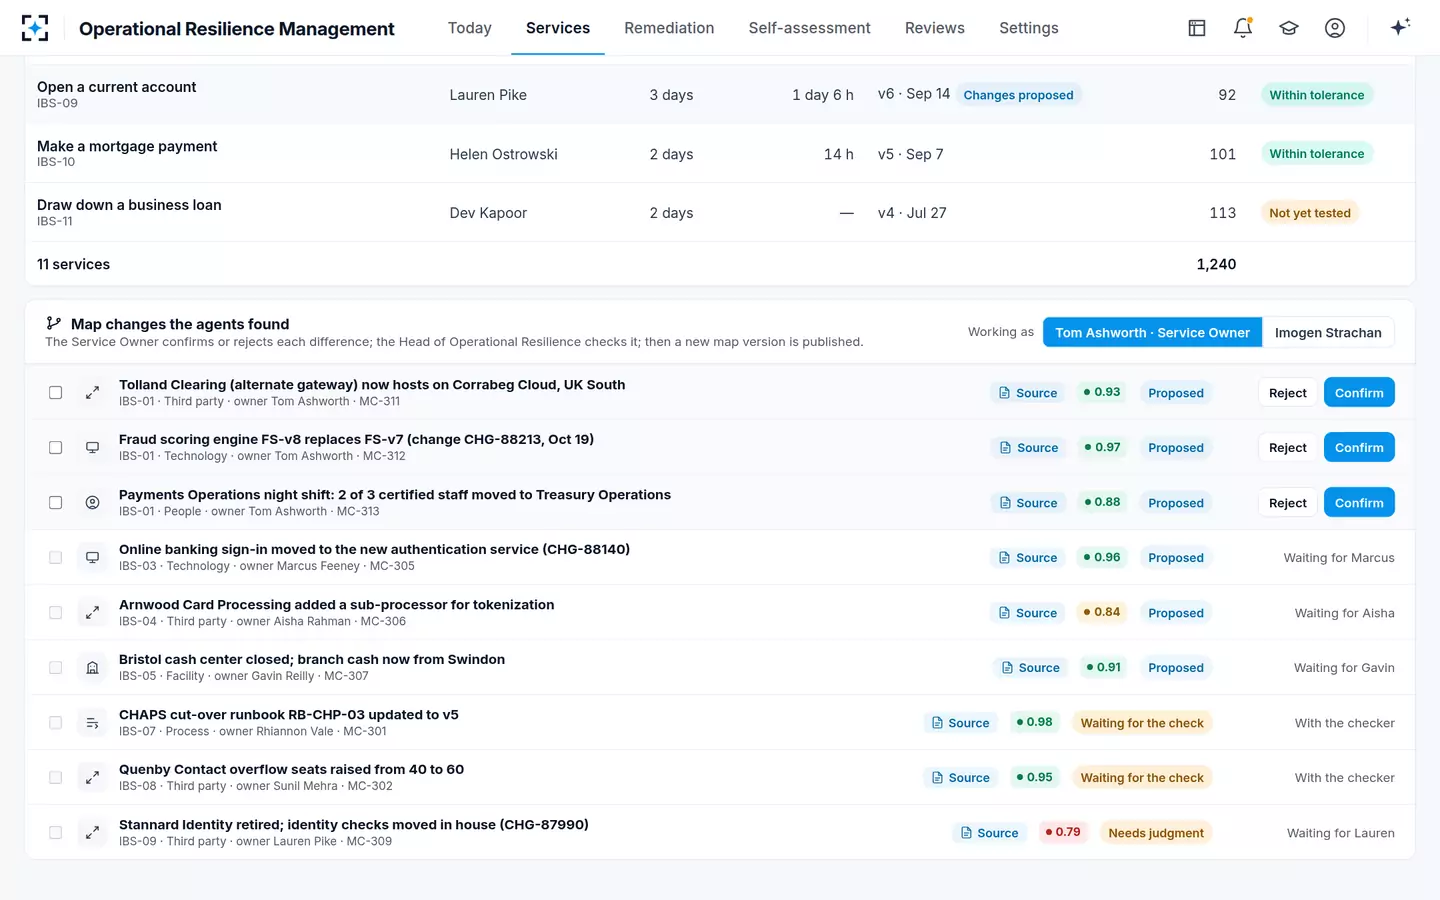
That comparison is mechanical and is what the sample bank's Mapping agent does each night against the CMDB, the third-party register, continuity plans and runbooks. On the day of the sample it had nine differences open, each with its source and a confidence: the alternate gateway's new hosting region (0.93), a fraud scoring engine version replaced (0.97), two of three certified night-shift staff moved to another team (0.88), a cash centre closed, a runbook updated, and more. A service owner confirms or rejects each one, the head of operational resilience checks it, and only then is a new map version published.
The map differences the agents found, waiting for their owners
What is operational resilience mapping, and why does it drift?
Operational resilience mapping is identifying and documenting the people, processes, technology, facilities and information each important business service needs, in enough detail "to allow the firm to identify vulnerabilities and remedy these as appropriate" (SYSC 15A.4.1R). It drifts because each of those five kinds of resource is owned by a different part of the bank and changes for reasons that have nothing to do with resilience.
The FCA's review found that maps drift in a predictable direction: they have centred on technology, the easiest part to keep current from a CMDB, and are weaker on facilities, people, processes, information and the resilience of third parties (FCA, March 2026). The three examples above are one of each: a third party, a technology version and people. A dashboard that refreshes only the technology layer will look current while its weakest layers age.
What triggers a re-test of an important business service?
Three things, under the FCA's rule: a material change, a fix, and the passage of time. A firm must carry out scenario testing "if there is a material change to the firm's business, the important business services identified … or impact tolerances", after it has made improvements in response to an earlier test, and regularly in any case (SYSC 15A.5.7R). The PRA adds that "firms that implement changes to their operations more frequently should undertake more frequent scenario testing" (SS1/21, 6.6).
Six events that should put a re-test on the dashboard
- A confirmed map change on a link that broke in a previous test.
The tested recovery no longer describes the service.
- A supplier change: new hosting, a new subcontractor, a new contract term.
The FCA found third-party issues were the leading cause of reported incidents in 2022 and 2023.
- A remediation item closed.
The FCA expects a closed fix to be proven by re-running the scenario.
- A real incident on the service.
Its timeline is new evidence, and lessons learned are required after a disruption (SYSC 15A.5.8R).
- Evidence passing its age limit.
In the sample bank, a recovery step timed from evidence over 12 months old becomes an estimate.
- A tolerance change.
A material change under SYSC 15A.5.7R, and a reason to check the previous result against the new line.
In the sample bank, the hosting change produced exactly that chain: the Third-party agent found it on October 16, the third-party risk manager confirmed it the same afternoon, and a test of an outage in the shared cloud region was proposed for December 2 and sent for checking like any other plan change.
Can a dashboard show impact tolerance breaches?
Yes, and it should show how far inside or outside each service sits, not just which side. A breach found in a test is a vulnerability on the remediation plan; a breach in a live incident is something the FCA expects to be told about (SYSC 15A.2.11G). A dashboard should distinguish the two and show, for tested breaches, the fix, its owner and its date.
How much of its tolerance each service's slowest tested recovery uses
Read as a share of tolerance, the list reorders itself. Online and mobile banking is "within tolerance" but uses 88% of it, which is why a proposal to widen its tolerance from 6 to 8 hours deserved the scrutiny it got. A service at 29% has room to absorb a bad change; a service at 88% may not survive one supplier change.
What metrics go on an operational resilience dashboard?
The metrics that predict whether the next test or incident will breach a tolerance, and the ones that show whether the programme is keeping its promises. The table sets out a short list, with the rule each one serves.
Operational resilience dashboard metrics, and the rule each one serves
| Metric | Why it matters | Rule it serves | Sample value |
|---|---|---|---|
| Services within, outside, untested | The headline position against tolerances | SYSC 15A.2.9R | 8 within, 2 outside, 1 untested |
| Share of tolerance used, per service | Distance from the line, not just the side | SYSC 15A.2.9R | 29% to 154% |
| Tests done against the year's plan | Whether the testing plan is being kept | SYSC 15A.5.1R, 15A.5.3R | 17 of 22 |
| Map differences open, and their age | Whether maps describe the service as it is | SYSC 15A.4.3R | 9 open |
| Recovery steps on evidence over the age limit | Which minutes are estimates | SYSC 15A.6.1R(5) | 0 on the breached service |
| Open fixes, overdue, unfunded | Whether remediation is real | SYSC 15A.5.9R; FCA 2024 | 6 open, 1 overdue |
| Material suppliers with untested or missing exit plans | Third-party exposure | SYSC 15A.4.2G, 15A.5.5G | 5 untested, 2 missing of 38 |
| Self-assessment sections ready | Readiness for board approval | SYSC 15A.6.1R, 15A.7.1R | 8 of 10 |
How do you report operational resilience to the board?
Report the decisions the board must take, with the evidence one step behind them. The PRA expects boards to have the management information and the knowledge to challenge senior management (SS1/21, 7.2), and to judge whether a breach found in a scenario is acceptable (SS1/21, 6.12); who maps, tests, checks and signs quotes both passages. The FCA's 2026 good-practice list includes testing plans "clear, concise, and tailored for board-level review, enabling informed investment decisions" (FCA, March 2026).
For a board, that means three items rather than eleven bars: which services are outside tolerance and what fixing each costs; which services are close to their line and why; and what the bank does not yet know, such as untested services and steps resting on old evidence. The dashboard is the head of operational resilience's working tool; the board pack is its summary, and it should trace back to the same numbers. The self-assessment is where those numbers are formally approved.
Buying an operational resilience dashboard: what to ask
Ask where each number comes from and how old it is, because a dashboard drawn on stale maps is a picture, not a measurement. Four questions separate products quickly. Does each tile open the records behind it? Does the dashboard know the date each map was last confirmed and each recovery step last evidenced? What happens when a system of record changes: does anything appear on the dashboard before the next annual review? And who confirms a change before it alters a published map?
Operational Resilience Management answers those with agents that compare and propose and people who confirm and sign; it does not replace the systems of record it reads, and it shows what those records say, including when they disagree. A bank with a few services and a stable estate may find a periodic dashboard enough. One with many suppliers and frequent change will find the nightly comparison is where the value is. The inputs a resilience tool needs lists what to have ready; to see the dashboard on one of your services, start from Operational Resilience Management.
Questions people ask
What is continuous mapping in operational resilience?
It is keeping service maps current by comparing them with their systems of record continuously, rather than re-drawing them once a year. The rules require review after material change and at least yearly; continuous comparison is how a bank notices the material change in the first place.
How often should an operational resilience dashboard update?
As often as its sources change. Test results and remediation status change when people act; maps and supplier data change when the estate changes, which can be daily. The sample bank's agents compare maps with four systems each night and propose differences the next morning.
What is the difference between an operational resilience dashboard and a risk dashboard?
A risk dashboard reports risks and controls against appetite. An operational resilience dashboard reports services against impact tolerances, set at the point of intolerable harm and assuming disruption happens; its measures are recovery times, harm counts and the evidence behind them.
Should the board see the operational resilience dashboard?
The board should see what it must decide: services outside tolerance, the fixes and their cost, services close to their line, and what is untested. The PRA expects boards to have appropriate management information; the full dashboard is a working tool behind that summary.
Can a dashboard replace the annual mapping review?
No. SYSC 15A still requires a review no later than a year after the last, and the review is a judgement about whether the map is sufficient, not just current. A nightly comparison makes the annual review shorter, because the differences have already been confirmed through the year.